"
"
Team:Grenoble-EMSE-LSU/Project/Monitoring/Cell2Machine
From 2013.igem.org
(Difference between revisions)
| (11 intermediate revisions not shown) | |||
| Line 18: | Line 18: | ||
<li id="titre"> | <li id="titre"> | ||
<h1>Cell to Machine Communication</h1> | <h1>Cell to Machine Communication</h1> | ||
| - | <p>To create a means of communication from cell to machine, we chose the red fluorescence protein KillerRed as a reporter protein. The first condition that our device needs to fulfill is to record light intensity. Then it needs to generate fluorescence thanks to a light source and a couple of excitation and emission filters. | + | <p>To create a means of communication from cell to machine, we chose the red fluorescence protein KillerRed as a reporter protein. The first condition that our device needs to fulfill is to record light intensity. Then it needs to generate fluorescence thanks to a light source and a couple of excitation and emission filters. First we will explain how we chose<a href="#Component">the different components</a>, then the experiments we did to find the most accurate parameters for each part of the device – <a href="#Photodiode">the photodiode</a>, <a href="#Arduino">Arduino</a> and <a href="#Optic">the optical components</a>.</p> |
</li> | </li> | ||
<li> | <li> | ||
<h2 id="Component">The components</h2> | <h2 id="Component">The components</h2> | ||
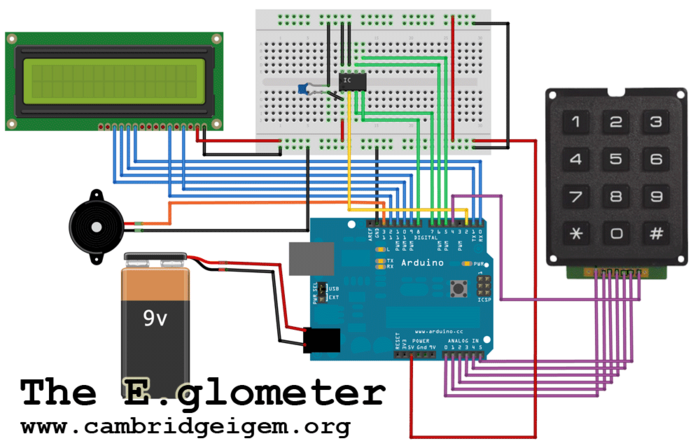
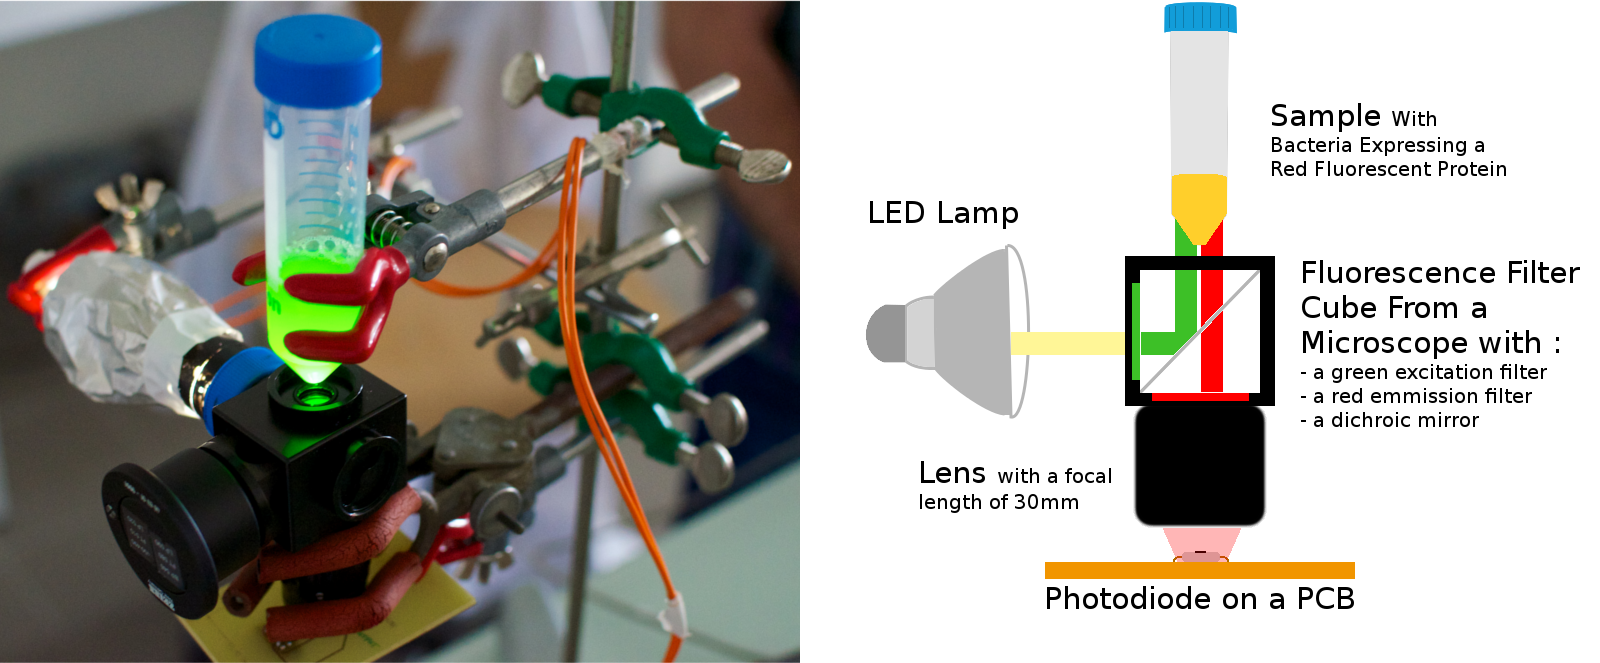
| - | <p>To record light intensity, we were inspired by the E. glometer of the | + | <p>To record light intensity, we were inspired by the E. glometer of the Cambridge team of iGEM 2010.<br> |
<p align="center"><img src="https://static.igem.org/mediawiki/2013/a/a7/Eglometer.png" alt="The Eglometer" width="500px" /></p> | <p align="center"><img src="https://static.igem.org/mediawiki/2013/a/a7/Eglometer.png" alt="The Eglometer" width="500px" /></p> | ||
| Line 33: | Line 33: | ||
<br> | <br> | ||
<p> | <p> | ||
| - | We use | + | We use a similar photodiode (TSL230RD) – the same as the TSL230RP-LF but as a surface mounted device (SMD) – and an Arduino Uno. Arduino is a single-board microcontroller created to make electronics more accessible. The main asset of the photodiode is that the output can be either a pulse train or a square wave (50% duty cycle) with its frequency directly proportional to light intensity. Since we are using a microcontroller, it is easy to calculate the frequency with the digital input of the microchip thanks to high or low level detection and we will have a better resolution because low frequencies are easier to measure than low voltages at low light levels. For the optical part we use a LED lamp and a cube filter from a fluorescence microscope with excitation and emission filters and an adjustable lens. The LED lamp was chosen so that e didn't have to buy high-power LEDS and build a card with heat sinks. This lamp illuminates with 520 lumens in a 40° cone under 12V and 6W. The low voltage was chosen as a safety measure and the small angle to avoid losing too much light. The excitation filter is a green interferential filter to excite the red fluorescent protein and the red emission filter is only a colored filter to collect all the red light in order to have a more precise measure. In the cube there is also a dichroic mirror that reflects all the green light and transmits all the red light. This mirror enables us to separate the photodiode from the light source completely. |
</p> | </p> | ||
</li> | </li> | ||
<li> | <li> | ||
<h2 id="Photodiode">The photodiode</h2> | <h2 id="Photodiode">The photodiode</h2> | ||
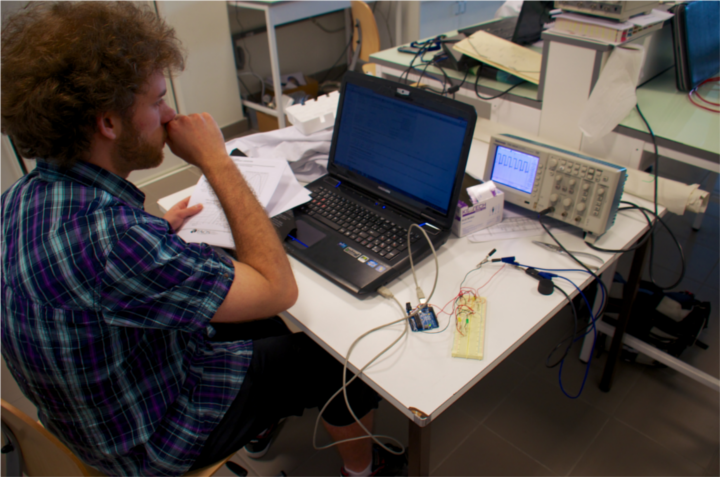
| - | <p>Before measuring with the photodiode, we need to know if the photodiode works as indicated in the datasheet. The photodiode was | + | <p>Before measuring with the photodiode, we need to know if the photodiode works as indicated in the datasheet. The photodiode was plugged in on a 5V stabilized power supply.</br></p> |
| - | </ | + | |
| - | < | + | <p align="center", style="margin:20px"><img src="https://static.igem.org/mediawiki/2013/5/5f/IGEMerworkphotodiode.png" alt="memberworkingonphotodiode" width="500px"></p> |
| - | <p align="center"><img src="https://static.igem.org/mediawiki/2013/5/51/Oscilloscope.png" alt=" | + | <p id="legend"><strong><em>A member of the team working on the photodiode</em></strong></br></p> |
| - | <br> | + | |
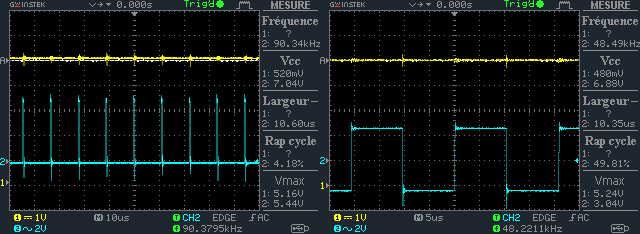
| - | <p>Since this frequency will be calculated by the Arduino controller, it may cause some trouble to the program to use a pulse train because the duration of the pulse is always 500ns and can be missed by the controller. The square wave (50% duty cycle) seems to be a better solution because of the 50% duty cycle. It means that the pulse duration depend on the frequency. Its duration is equal to 1/2f and since the light intensity we want to measure will be low this type of signal can be easily detected by Arduino.</p> | + | <p>For the same amount of light, we measure the frequency at the output of the photodiode for a pulse train or a square wave (50% duty cycle). According to the datasheet, when using a pulse train the linear relation between the frequency and the irrandiance is given by 1kHz=1µW/cm². When using a square wave (50% duty cycle) it is 1kHz=2µW/cm². This is what we can see on the figure #. |
| + | </br></p> | ||
| + | <p align="center"><img src="https://static.igem.org/mediawiki/2013/5/51/Oscilloscope.png" alt="Oscillogram" width="650px" /></p> | ||
| + | <p id="legend"><strong><em>Oscillograms showing the two different mode of the photodiode.</em></strong></br>The first oscillogramm shows the pulse train mode and the second the 50% duty cycle mode</br></p> | ||
| + | |||
| + | <p></br>Since this frequency will be calculated by the Arduino controller, it may cause some trouble to the program to use a pulse train because the duration of the pulse is always 500ns and can be missed by the controller. The square wave (50% duty cycle) seems to be a better solution because of the 50% duty cycle. It means that the pulse duration depend on the frequency. Its duration is equal to 1/2f and since the light intensity we want to measure will be low this type of signal can be easily detected by Arduino.</p> | ||
</li> | </li> | ||
<li> | <li> | ||
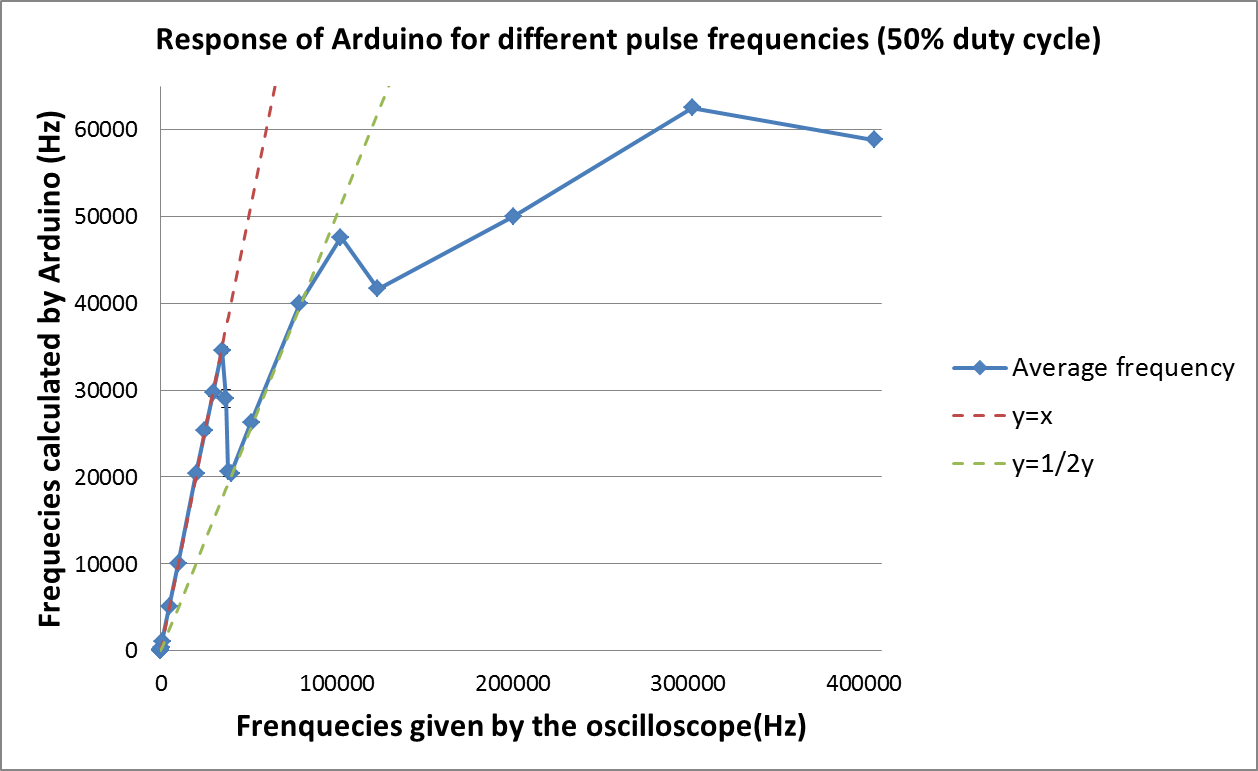
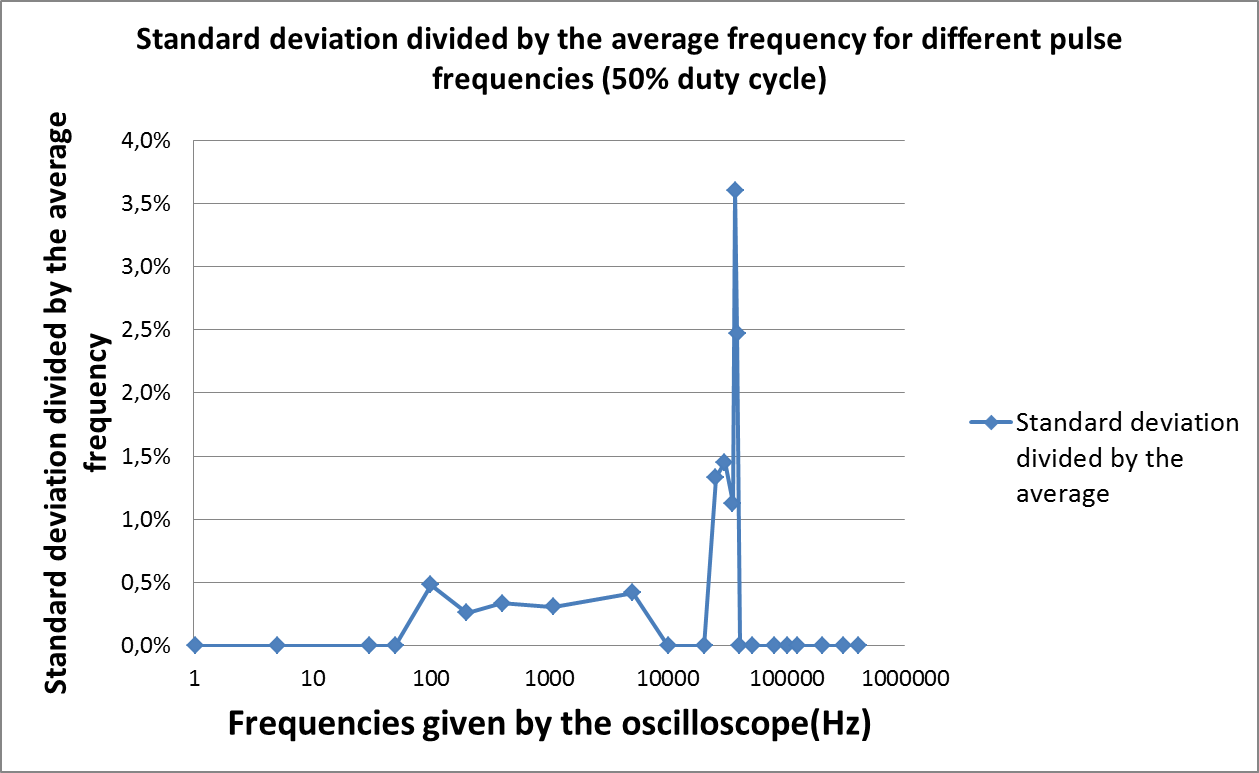
| Line 54: | Line 59: | ||
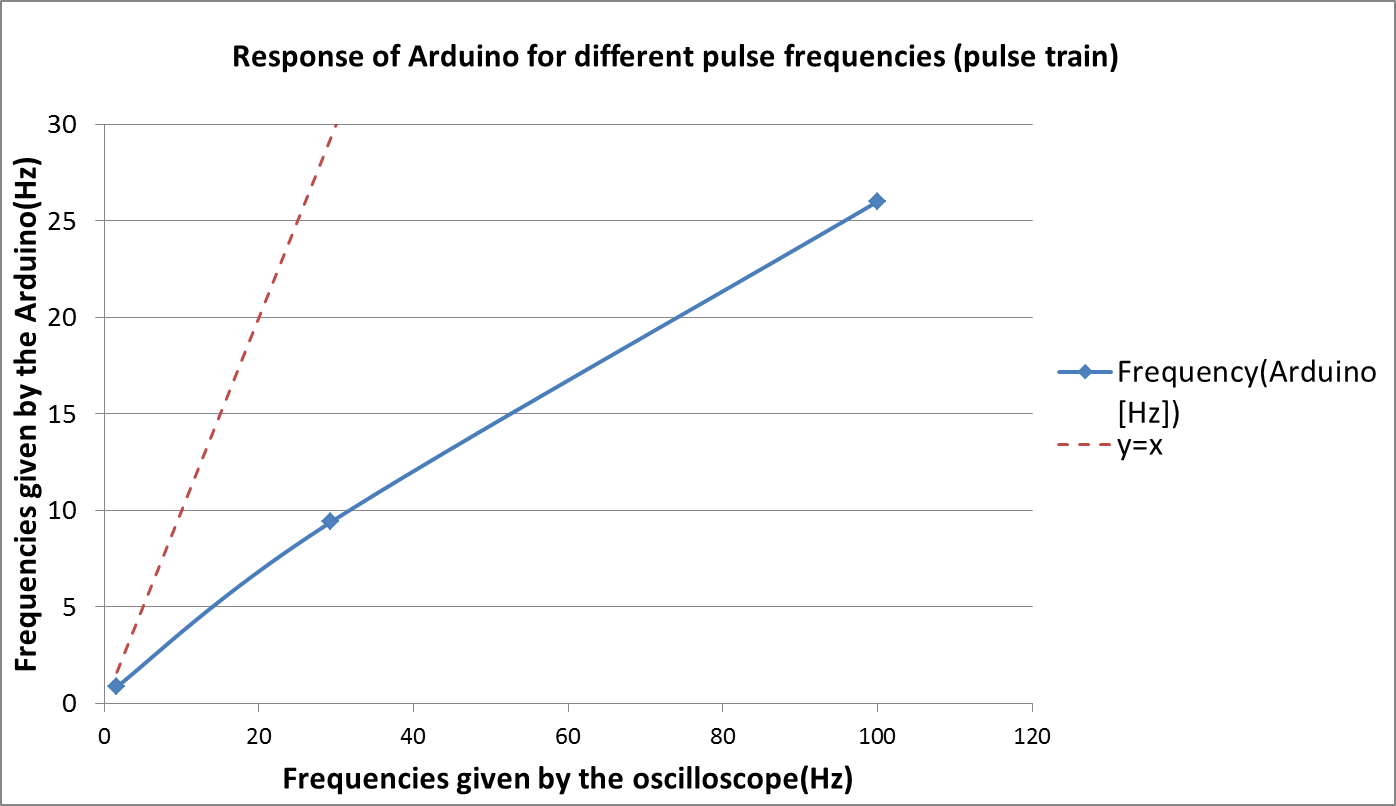
If the algorithm is right, the curve should follow the equation x=y, which means that Arduino and the oscilloscope measure the same frequencies.</br></p> | If the algorithm is right, the curve should follow the equation x=y, which means that Arduino and the oscilloscope measure the same frequencies.</br></p> | ||
| - | <p align="center"><img src="https://static.igem.org/mediawiki/2013/3/31/Arduino_mode1.png" alt="Arduino Mode1" width="700px"> | + | <p align="center", style="margin:30px"><img src="https://static.igem.org/mediawiki/2013/3/31/Arduino_mode1.png" alt="Arduino Mode1" width="700px"> |
<img src="https://static.igem.org/mediawiki/2013/8/86/Arduino_mode2.png" alt="Arduino Mode2" width="700px"> | <img src="https://static.igem.org/mediawiki/2013/8/86/Arduino_mode2.png" alt="Arduino Mode2" width="700px"> | ||
<img src="https://static.igem.org/mediawiki/2013/4/40/Arduino_std.png" alt="Arduino Mode2 standard deviation" width="700px"> | <img src="https://static.igem.org/mediawiki/2013/4/40/Arduino_std.png" alt="Arduino Mode2 standard deviation" width="700px"> | ||
Latest revision as of 20:13, 16 September 2013