"
"
Team:Grenoble-EMSE-LSU/Project/Monitoring/Cell2Machine
From 2013.igem.org
(Difference between revisions)
| Line 23: | Line 23: | ||
<li> | <li> | ||
<h2>The components</h2> | <h2>The components</h2> | ||
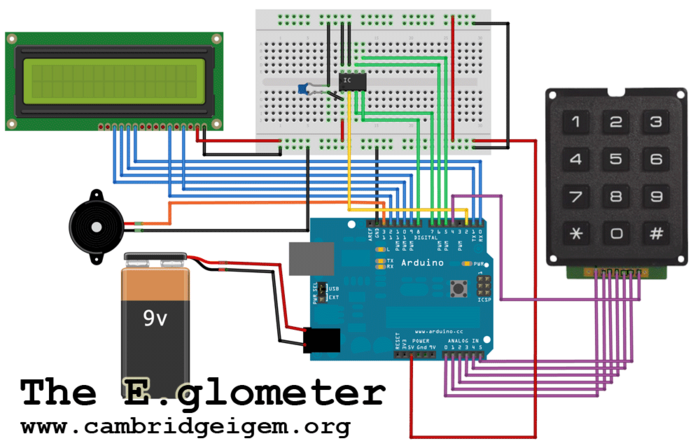
| - | <p>To record light intensity, we were inspired by the E. glometer of the Cambridge team of iGEM 2010.<br><br> | + | <p>To record light intensity, we were inspired by the E. glometer of the Cambridge team of iGEM 2010.<br> |
| + | |||
| + | <img src="https://static.igem.org/mediawiki/2013/a/a7/Eglometer.png" width="600px" /> | ||
| + | <p id="legend"><strong><em>The E. glometer of Cambrige team (iGEM 2010)</em></strong><br> | ||
| + | Device built by Cambrige team in 2010 to measure the light intensity of their LuxBrick | ||
| + | <em><strong>Source:</strong></em> https://2010.igem.org/Team:Cambridge | ||
| + | </p> | ||
| + | |||
| + | <br> | ||
We use quite the same photodiode (TSL230RD) – same as the TSL230RP-LF but in surface mounted device (SMD) – and an Arduino Uno. Arduino is a single-board microcontroller created to make electronics more accessible. The main asset of the photodiode is that the output can be either a pulse train or a square wave (50% duty cycle) with frequency directly proportional to light intensity. Since we are using a microcontroller, it is easy to calculate a frequency with the digital input of the microchip thanks to high or low level and we will have a better resolution because low frequencies are easier to measure than low voltages. For the optic part we use a domestic LED lamp and a cube filter from a microscope with excitation and emission filters and an adjustable lens. A domestic LED lamp was chosen to allow us not to buy several high-power LEDS and built a card with a heat sink. This lamp illuminate with 520 lumens in a cone of 40° under 12V and 6W. The low voltage was chosen as a safety condition and the small angle to avoid losing to much light. The excitation filter is a green interferential filter to excite the red fluorescent protein and the emission filter is only a colored filter to have all the red light in order to have a more efficient measure. In the cube there is also a dichroic mirror that reflects all the green light and transmits all the red light. This mirror enables us to separate completely the photodiode from the light source. | We use quite the same photodiode (TSL230RD) – same as the TSL230RP-LF but in surface mounted device (SMD) – and an Arduino Uno. Arduino is a single-board microcontroller created to make electronics more accessible. The main asset of the photodiode is that the output can be either a pulse train or a square wave (50% duty cycle) with frequency directly proportional to light intensity. Since we are using a microcontroller, it is easy to calculate a frequency with the digital input of the microchip thanks to high or low level and we will have a better resolution because low frequencies are easier to measure than low voltages. For the optic part we use a domestic LED lamp and a cube filter from a microscope with excitation and emission filters and an adjustable lens. A domestic LED lamp was chosen to allow us not to buy several high-power LEDS and built a card with a heat sink. This lamp illuminate with 520 lumens in a cone of 40° under 12V and 6W. The low voltage was chosen as a safety condition and the small angle to avoid losing to much light. The excitation filter is a green interferential filter to excite the red fluorescent protein and the emission filter is only a colored filter to have all the red light in order to have a more efficient measure. In the cube there is also a dichroic mirror that reflects all the green light and transmits all the red light. This mirror enables us to separate completely the photodiode from the light source. | ||
</p> | </p> | ||
Revision as of 13:32, 19 August 2013