"
"
Team:Grenoble-EMSE-LSU/Project/Validation
From 2013.igem.org
(Difference between revisions)
| Line 39: | Line 39: | ||
<br> | <br> | ||
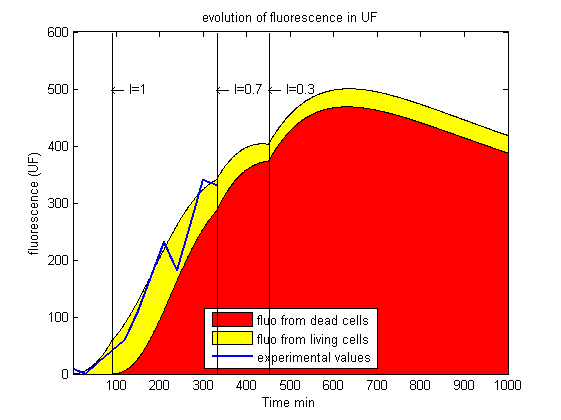
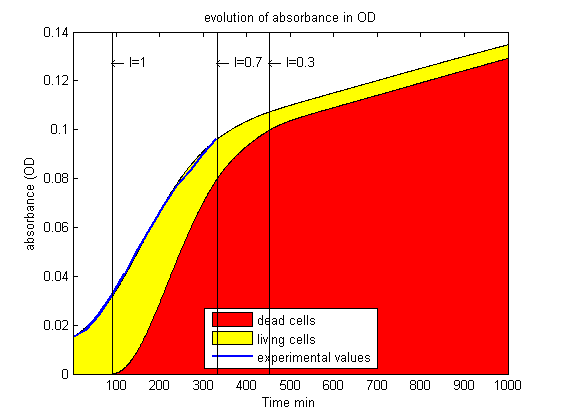
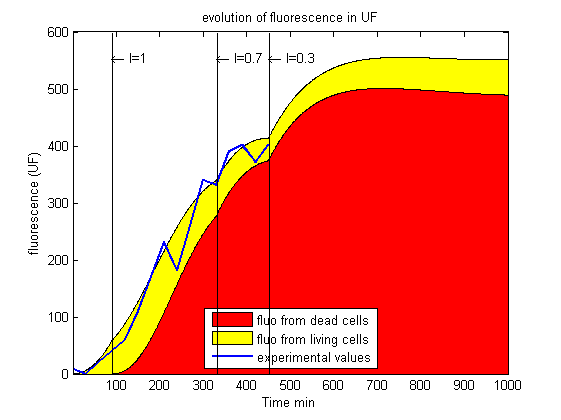
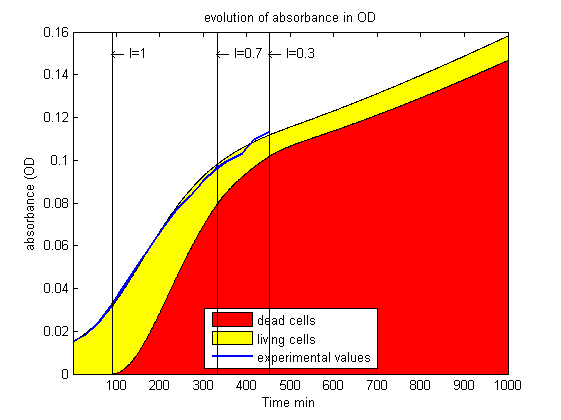
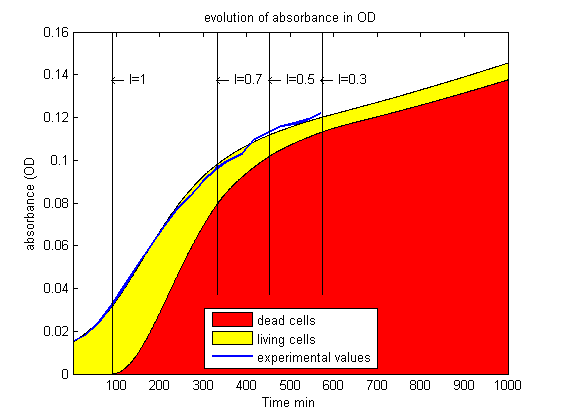
<p>On the curves below:</p> | <p>On the curves below:</p> | ||
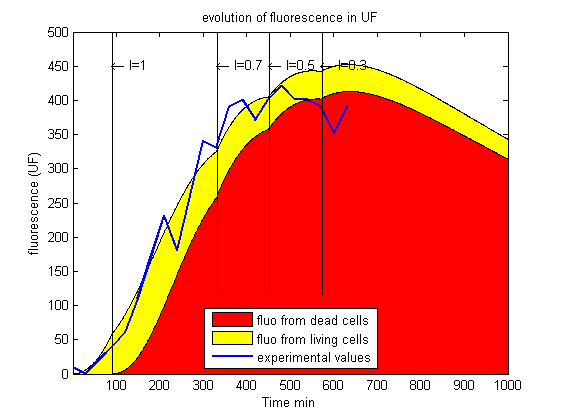
| - | <p> $\bullet$ The red surface is the | + | <p> $\bullet$ The red surface is the predicted absorbance of <b>dead</b> bacteria <a href="https://2013.igem.org/Team:Grenoble-EMSE-LSU/Project/Modelling/Building#equation1">($D$, in $OD_{600}$)</a> in the absorbance panel, and the predicted KillerRed fluorescence in <b>dead</b> bacteria <a href="https://2013.igem.org/Team:Grenoble-EMSE-LSU/Project/Modelling/Building#equation1">($K_D$, in $RFU$)</a> in the fluorescence panel.</p> |
| - | <p> $\bullet$ The yellow surface | + | <p> $\bullet$ The yellow surface represents the predicted absorbance of <b>living</b> bacteria <a href="https://2013.igem.org/Team:Grenoble-EMSE-LSU/Project/Modelling/Building#equation1">($C$, in $OD_{600}$)</a> in the absorbance panel, and the predicted KillerRedfluorescence KillerRed stored in <b>living</b> bacteria <a href="https://2013.igem.org/Team:Grenoble-EMSE-LSU/Project/Modelling/Building#equation1">($K$, in $RFU$)</a> in the fluorescence panel.</p> |
| - | <p> $\bullet$ The blue line | + | <p> $\bullet$ The blue line represents experimental datas.</p> |
<br> | <br> | ||
<p> <b>Step 1</b> ($t=300min$):</p> | <p> <b>Step 1</b> ($t=300min$):</p> | ||
| - | <p> | + | <p> This step is divided in two periods : first 1.5 hours in the dark, then 4 hours at maximal intensity of the lamp ($I = 1$). This procedure has 2 objectives : to obtain a precised model and to reach more rapidly the desired density of living bacteria. A first estimate of the cell culture parameters were determined by fitting the curves obtained so far. We then searched for the light profile that would stabilize the cell population. Light intensity is expressed as a fraction or a percentage of the maximum intensity of the bulb. A constant 30% light level could stabilize the living cell density, but it took to much time. We therefore decided to illuminate first at 70% for 2 hours, then to decrease the intensity to 30%. Below are shown the fit of the 5 first hours and the predicted $OD_{600}$ and fluorescence for the upcoming intensities. The cell density should reach its target level (0.02) after 2 hours.</p> |
<img src="https://static.igem.org/mediawiki/2013/2/22/28_1_fluo.png" style="height:300px;width:400px;"> | <img src="https://static.igem.org/mediawiki/2013/2/22/28_1_fluo.png" style="height:300px;width:400px;"> | ||
<img src="https://static.igem.org/mediawiki/2013/e/e7/28_1_OD.png" style="height:300px;width:400px;"> | <img src="https://static.igem.org/mediawiki/2013/e/e7/28_1_OD.png" style="height:300px;width:400px;"> | ||
| Line 58: | Line 58: | ||
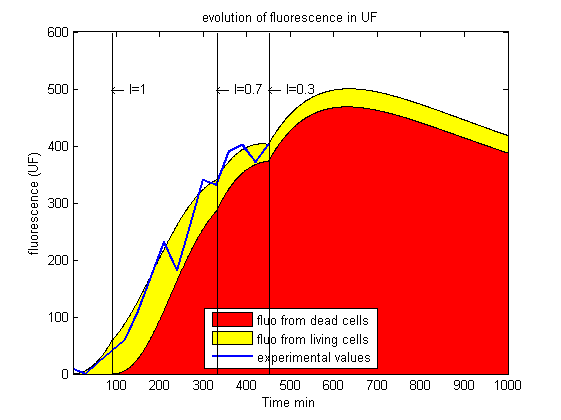
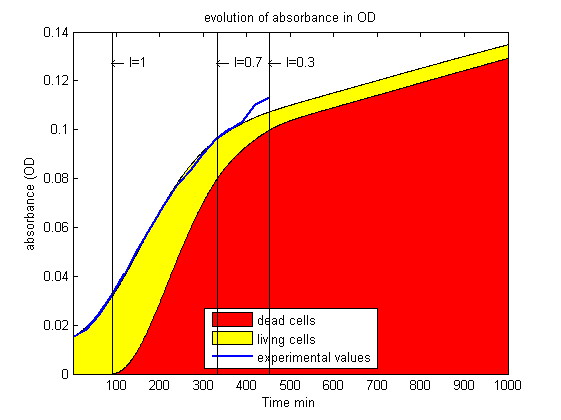
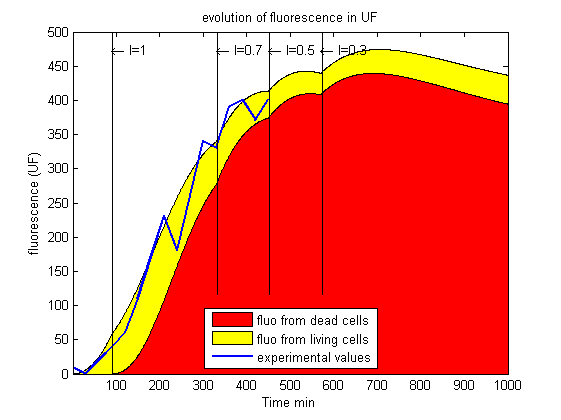
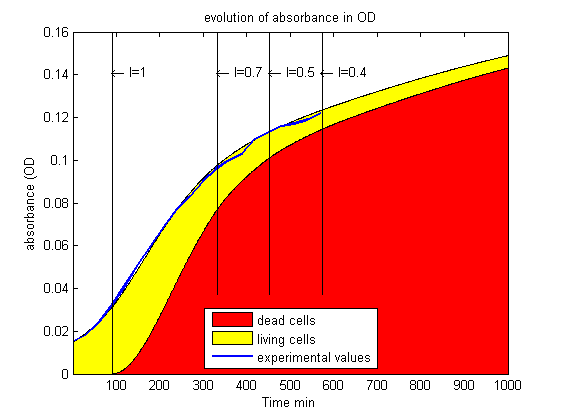
<p> <b>Step 2</b> ($t=450min$):</p> | <p> <b>Step 2</b> ($t=450min$):</p> | ||
| - | <p>After 2 hours, we | + | <p>After 2 hours, we observe that the fluorescence has closely followed the prediction, but that the absorbance has grown up too fast. The model parameters are thus adjusted again and therefore the predicted kinetics are re-calculated. This may force us to change the light intensity time profile.</p> |
<img src="https://static.igem.org/mediawiki/2013/a/a5/28_2_fluo.png" style="height:300px;width:400px;"> | <img src="https://static.igem.org/mediawiki/2013/a/a5/28_2_fluo.png" style="height:300px;width:400px;"> | ||
<img src="https://static.igem.org/mediawiki/2013/e/ee/28_2_OD.png" style="height:300px;width:400px;"> | <img src="https://static.igem.org/mediawiki/2013/e/ee/28_2_OD.png" style="height:300px;width:400px;"> | ||
| Line 64: | Line 64: | ||
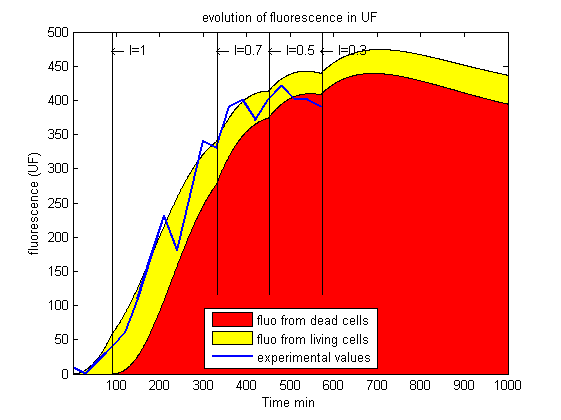
<p> <b>Step 3:</b></p> | <p> <b>Step 3:</b></p> | ||
| - | <p> Here are the | + | <p> Here are the newly predicted kinetics, with the new set of parameters. It seems that an 30% illumination may be insufficient to stabilize the bacterial population.</p> |
<img src="https://static.igem.org/mediawiki/2013/b/b1/28_3_fluo.png" style="height:300px;width:400px;"> | <img src="https://static.igem.org/mediawiki/2013/b/b1/28_3_fluo.png" style="height:300px;width:400px;"> | ||
<img src="https://static.igem.org/mediawiki/2013/5/5a/28_3_OD.png" style="height:300px;width:400px;"> | <img src="https://static.igem.org/mediawiki/2013/5/5a/28_3_OD.png" style="height:300px;width:400px;"> | ||
Revision as of 00:49, 5 October 2013