Experiment
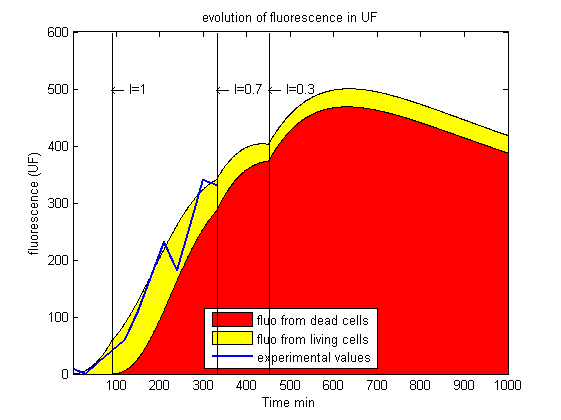
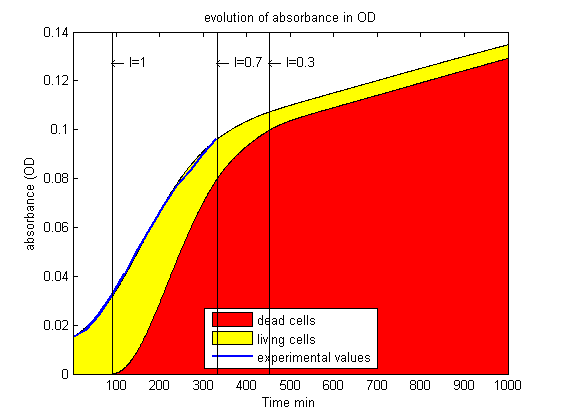
On the curves below:
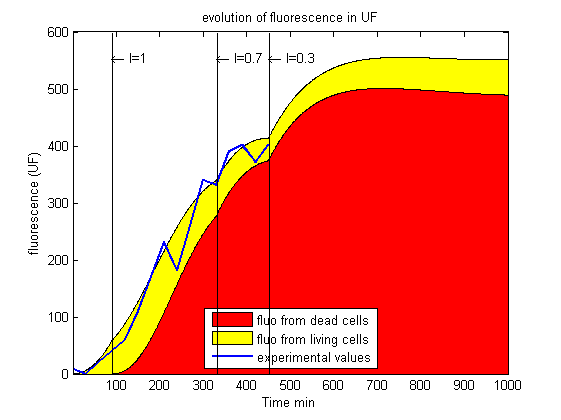
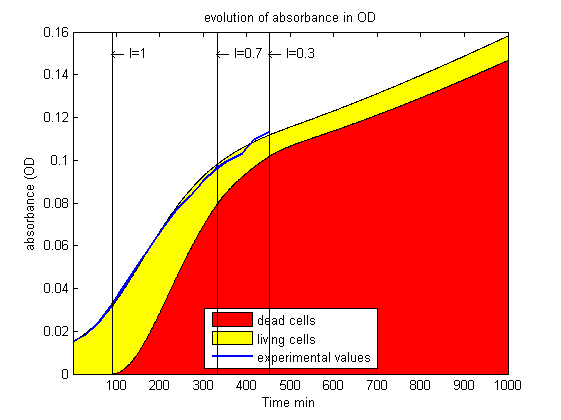
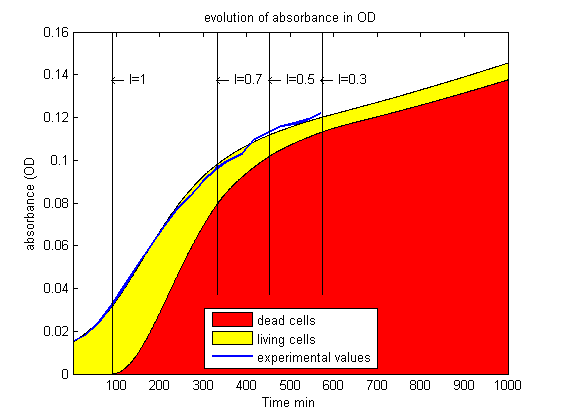
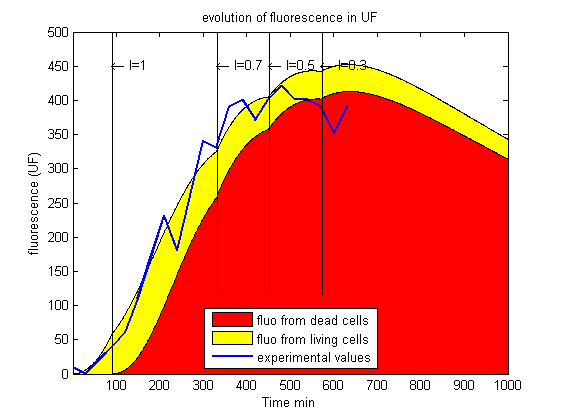
$\bullet$ The red surface is the prediction of absorbance caused by dead bacteria ($D$, in $OD_{600}$) on the absorbance curve, and the prediction of fluorescence caused by KillerRed stored in dead bacteria ($K_D$, in $UF$) on the fluorescence curve.
$\bullet$ The yellow surface is the prediction of absorbance caused by living bacteria ($C$, in $OD_{600}$) on the absorbance curve, and the prediction of fluorescence caused by KillerRed stored in living bacteria ($K$, in $UF$) on the fluorescence curve.
$\bullet$ The blue line follows the collected datas.
Step 1 ($t=300min$):
The experiment is run for 5 hours without control. There is first a period of 1 hour and a half in the dark, then 3 hours and a half at maximal intensity. This process has 2 objectives : to fasten the emergence of the level of the amount of living bacteria and to improve the precision of model. At this point, parameters are found to fit best the curves observed, that is the reason why a long period is needed : it will improve the precision of parameters. Then, we search for the light the will stabilize the population cell. It could have been 30% of maximal intensity all along, but again to fasten the apparition of the level, we decide to illuminate bacteria first at 70% for 2 hours, and then decrease the intensity at 30%. Below are the fit of the 5 first hours and the predictions for the chosen intensities. The level should appear in 2 hours.
Parameters for these predictions:
$R=83 min$
$a=140 RFU.OD^{-1}.min^{-1}$
$b=0,9.10^{-2}RFU.UL^{-1}.min^{-1}$
$k=0,9.10^{-7}OD.RFU^{-1}.UL^{-1}.min^{-1}$
$l=0.983$
$M=110 min$
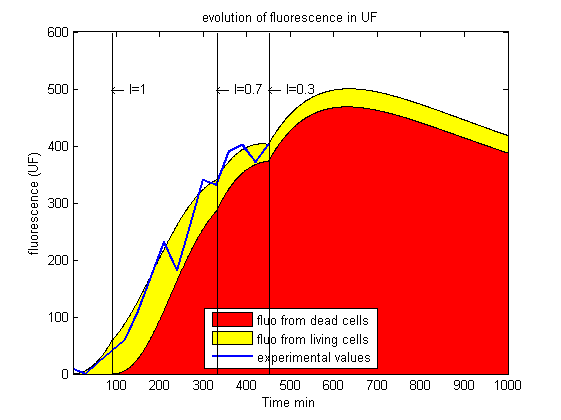
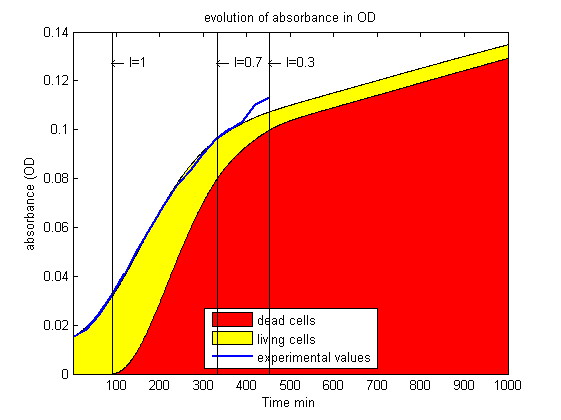
Step 2 ($t=450min$):
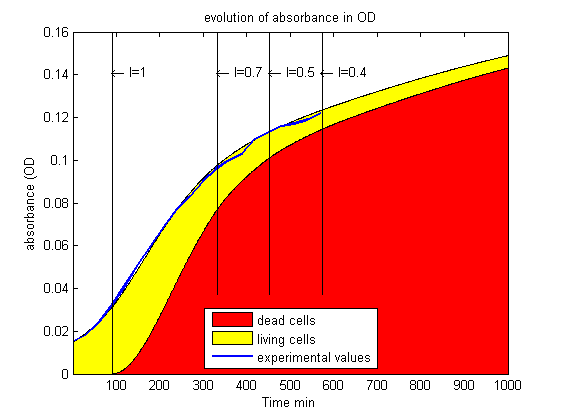
After 2 hours, we observes that the fluorescence has followed the prediction, but the absorbance has grown up too fast. Parameters have to be changed and therefore new predictions have to be calculated. At the end, we may have to change the plan of light intensity.
Step 3:
Here are the new prediction, with new parameters. Unfortunately, it seems that an illumination at 30% is a little too weak to stabilize the population.
Parameters for these predictions:
$R=83 min$
$a=140 RFU.OD^{-1}.min^{-1}$
$b=0,93.10^{-2}RFU.UL^{-1}.min^{-1}$
$k=0,93.10^{-7}OD.RFU^{-1}.UL^{-1}.min^{-1}$
$l=0.9811$
$M=110 min$
Step 4:
The light intensity has to be increase a little bit. Again, to accelerate the emergence of the level, we chose an illumination of 50% for 2 hours, and then an illumination of 30%. Below are the prediction with this illumination.
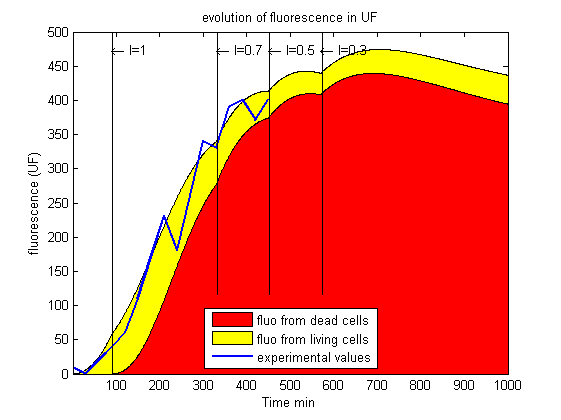

Step 5 ($t=570min$):
This time, the absorbance has been perfectly following the predictions, but the fluorescence has not, it has decreased faster than what was predicted. Just like in 'step 2', the parameters have to be changed to improve the fit.
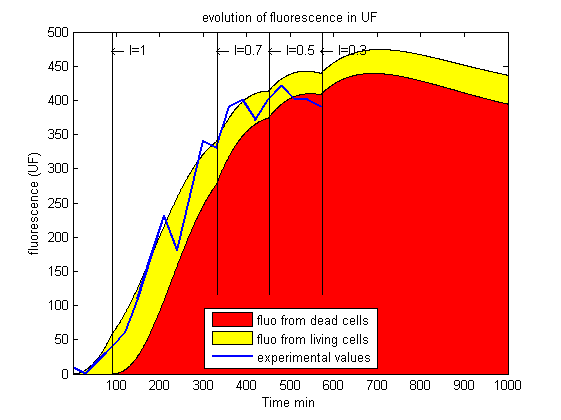
Step 6:
Here are the new predictions. We even have concentrated 2 steps in these kinetics for the future illumination has been changed. For this prediction, 30% of maximal illumination was not enough to stabilize the bacterial population, therefore it has been increase to 40%.

Parameters for these predictions:
$R=84.5 min$
$a=140 RFU.OD^{-1}.min^{-1}$
$b=1.0.10^{-2}RFU.UL^{-1}.min^{-1}$
$k=0,9.10^{-7}OD.RFU^{-1}.UL^{-1}.min^{-1}$
$l=0.9807$
$M=110 min$
Step 7:
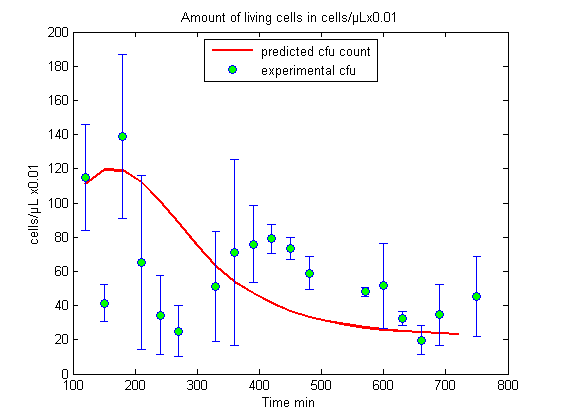
And now we can contemplate a 4-hours long linear increase of absorbance (from $t=360min$ to $t=630min$). It still has to be compared with the count of bacteria on Petri dishes.

On the last absorbance curve, the yellow surface's width is about 0.02, it means that living cells are responsible for an absorbance of $0.02 OD_{600}$. Considering that a cell concentration of $3.10^5 cell/\mu L$ is responsible for an absorbance of $1 OD_{600}$, according to the model, we have a cell concentration of $6000 cell/\mu L$.
The experiment has been continued to create a new set of parameters. Here are the new predictions, with the parameters value of the fifth experiment.


 "
"

