"
"
Team:Grenoble-EMSE-LSU/Project/Validation
From 2013.igem.org
(Difference between revisions)
| Line 44: | Line 44: | ||
<br> | <br> | ||
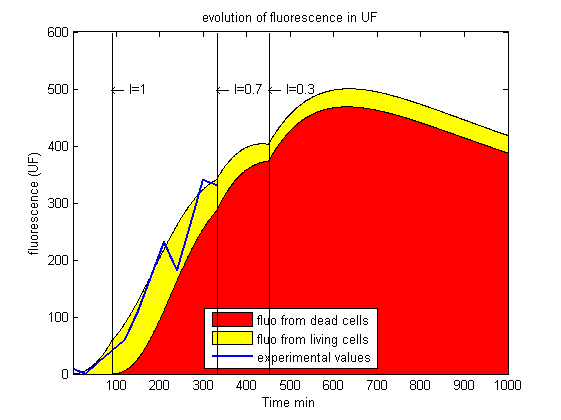
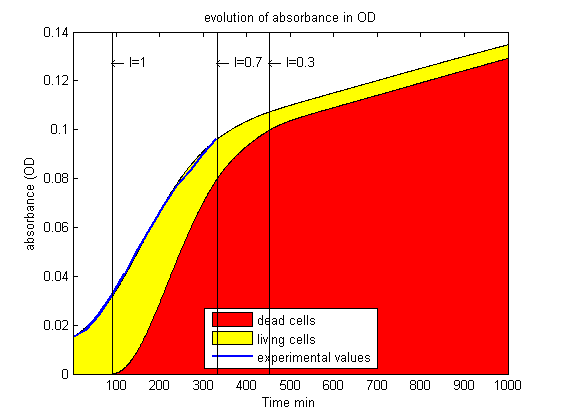
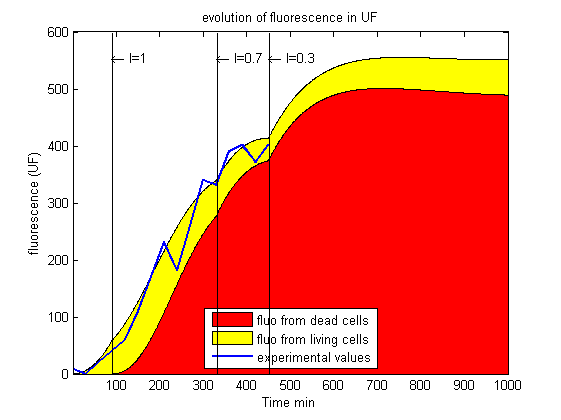
| - | <p> <b>Step 1</b> ($t= | + | <p> <b>Step 1</b> ($t=330min$):</p> |
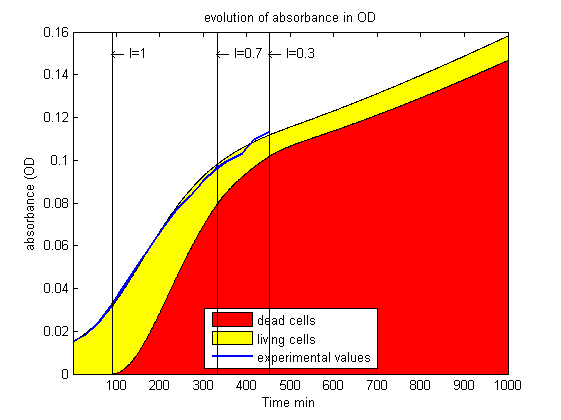
<p> This step is divided in two periods : first 1.5 hours in the dark, then 4 hours at maximal intensity of the lamp ($I = 1$). This procedure has 2 objectives : to obtain a precised model and to reach more rapidly the desired density of living bacteria. A first estimate of the cell culture parameters were determined by fitting the curves obtained so far. We then searched for the light profile that would stabilize the cell population. Light intensity is expressed as a fraction or a percentage of the maximum intensity of the bulb. A constant 30% light level could stabilize the living cell density, but it took to much time. We therefore decided to illuminate first at 70% for 2 hours, then to decrease the intensity to 30%. Below are shown the fit of the 5 first hours and the predicted $OD_{600}$ and fluorescence for the upcoming intensities. The cell density should reach its target level (0.02) after 2 hours.</p> | <p> This step is divided in two periods : first 1.5 hours in the dark, then 4 hours at maximal intensity of the lamp ($I = 1$). This procedure has 2 objectives : to obtain a precised model and to reach more rapidly the desired density of living bacteria. A first estimate of the cell culture parameters were determined by fitting the curves obtained so far. We then searched for the light profile that would stabilize the cell population. Light intensity is expressed as a fraction or a percentage of the maximum intensity of the bulb. A constant 30% light level could stabilize the living cell density, but it took to much time. We therefore decided to illuminate first at 70% for 2 hours, then to decrease the intensity to 30%. Below are shown the fit of the 5 first hours and the predicted $OD_{600}$ and fluorescence for the upcoming intensities. The cell density should reach its target level (0.02) after 2 hours.</p> | ||
<img src="https://static.igem.org/mediawiki/2013/2/22/28_1_fluo.png" style="height:300px;width:400px;"> | <img src="https://static.igem.org/mediawiki/2013/2/22/28_1_fluo.png" style="height:300px;width:400px;"> | ||
| Line 83: | Line 83: | ||
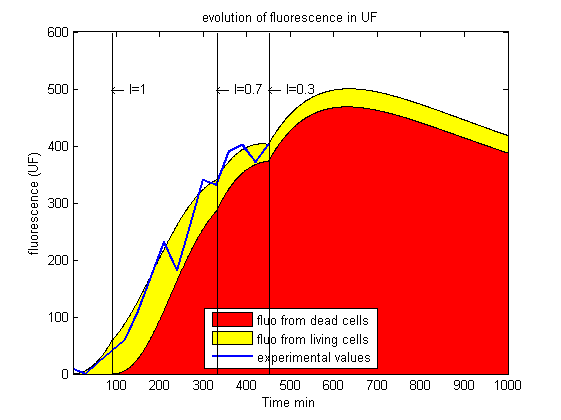
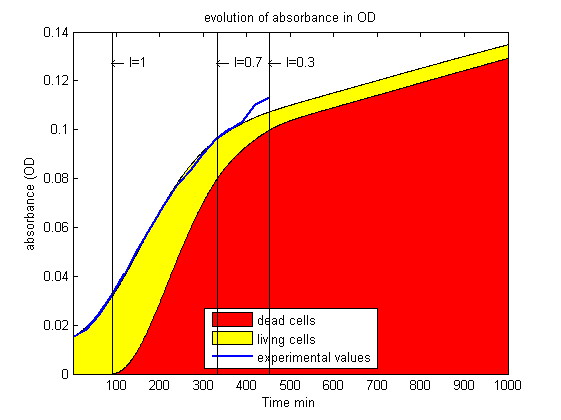
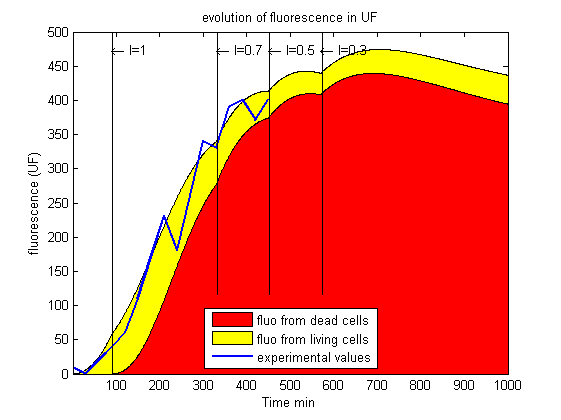
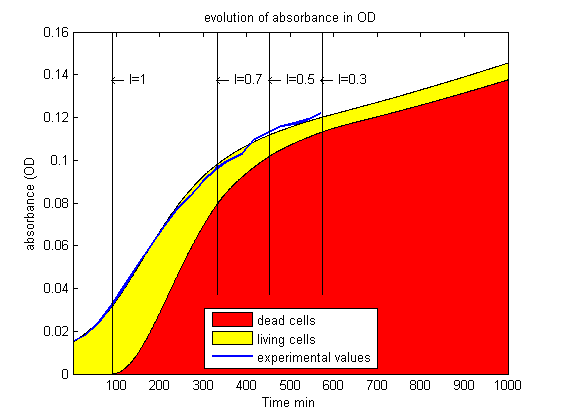
<p> <b>Step 5</b> ($t=570min$):</p> | <p> <b>Step 5</b> ($t=570min$):</p> | ||
| - | <p> This time, the absorbance | + | <p> This time, the absorbance fits perfectly the predicted curve, but the fluorescence does not. It instead decreased faster than expected. Just as in 'step 2', the parameters have to be adjusted to improve the fit.</p> |
<img src="https://static.igem.org/mediawiki/2013/4/46/28_5_fluo.png" style="height:300px;width:400px;"> | <img src="https://static.igem.org/mediawiki/2013/4/46/28_5_fluo.png" style="height:300px;width:400px;"> | ||
<img src="https://static.igem.org/mediawiki/2013/2/27/28_5_OD.png" style="height:300px;width:400px;"> | <img src="https://static.igem.org/mediawiki/2013/2/27/28_5_OD.png" style="height:300px;width:400px;"> | ||
| Line 89: | Line 89: | ||
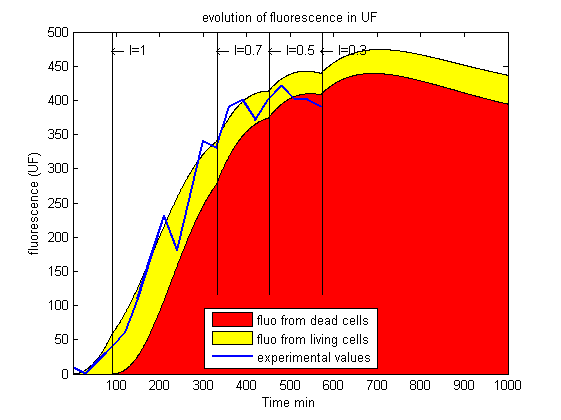
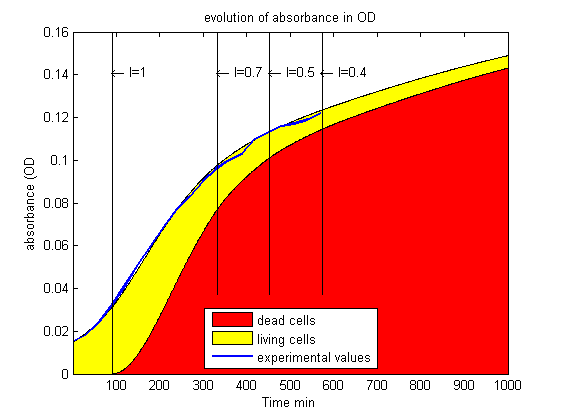
<p> <b>Step 6:<b></p> | <p> <b>Step 6:<b></p> | ||
| - | <p> Here are the | + | <p> Here are the data fitted with the improved set of parameters. Again, the illumination profile needed to be adjusted. 30% illumination was not enough and we increased it to 40%.</p> |
<img src="https://static.igem.org/mediawiki/2013/2/2e/28_6_fluo.png" style="height:300px;width:400px;"> | <img src="https://static.igem.org/mediawiki/2013/2/2e/28_6_fluo.png" style="height:300px;width:400px;"> | ||
<img src="https://static.igem.org/mediawiki/2013/1/13/28_6_OD.png" style="height:300px;width:400px;"> | <img src="https://static.igem.org/mediawiki/2013/1/13/28_6_OD.png" style="height:300px;width:400px;"> | ||
| Line 101: | Line 101: | ||
<br> | <br> | ||
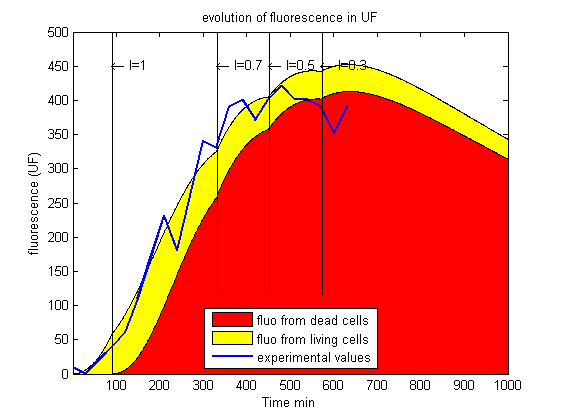
<p> <b>Step 7:<b></p> | <p> <b>Step 7:<b></p> | ||
| - | <p> | + | <p> The OD curve is satisfactory, since a 4-hours long linear increase of absorbance can be observed (from $t=360min$ to $t=630min$). This suggests that our procedure works. We still have to compare our results to the number of bacterial colonies able to grow on Petri dishes.</p> |
<img src="https://static.igem.org/mediawiki/2013/3/35/28_7_fluo.png" style="height:300px;width:400px;"> | <img src="https://static.igem.org/mediawiki/2013/3/35/28_7_fluo.png" style="height:300px;width:400px;"> | ||
<img src="https://static.igem.org/mediawiki/2013/f/f9/28_7_OD.png" style="height:300px;width:400px;"> | <img src="https://static.igem.org/mediawiki/2013/f/f9/28_7_OD.png" style="height:300px;width:400px;"> | ||
| Line 107: | Line 107: | ||
<br> | <br> | ||
<br> | <br> | ||
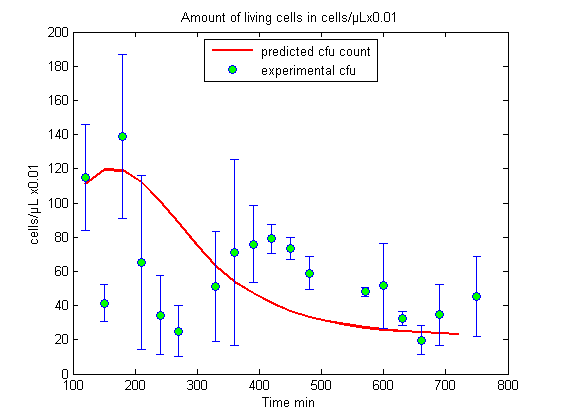
| - | <p> | + | <p>In the final absorbance curve, the optical density of living cell is about 0.02 ($OD_{600}$). Considering that a cell concentration of $3.10^5 cells/μL$ result in an absorbance of $1 OD_{600}$, we thus expect a colony forming unit concentration of $6000 cells/μL$.</p> |
Revision as of 00:55, 5 October 2013