 "
"
Team:Groningen/Modeling/Heatmotility
From 2013.igem.org
| Line 33: | Line 33: | ||
</td></tr><tr><td><font size="1">Figure 2</font></td></tr></table></div> | </td></tr><tr><td><font size="1">Figure 2</font></td></tr></table></div> | ||
| - | <p>Due to high concentrations of ATP in the cell, we assume similar kinetics for the CheA (A) phosphorylation rate. It then follows that the positive increase in AP levels is proportional to bound receptor (Ta) and unbound receptor (T0) levels, and can be described by (3), where ATR is a constant | + | <p>Due to high concentrations of ATP in the cell, we assume similar kinetics for the CheA (A) phosphorylation rate. It then follows that the positive increase in AP levels is proportional to bound receptor (Ta) and unbound receptor (T0) levels, and can be described by (3), where ATR is a constant.</p> |
| Line 47: | Line 47: | ||
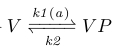
<p>Because AP levels are proportional to attractant levels we neglect the AP in our reactions (chem reaction 2) and take the rate coefficient k1 as a linear function of attractant levels (fig x). Because the negative decrease in AP levels is dependent on VP, this disrupts feedback loop between AP and VP levels, thus making the optimization later easier (see section x). </p> | <p>Because AP levels are proportional to attractant levels we neglect the AP in our reactions (chem reaction 2) and take the rate coefficient k1 as a linear function of attractant levels (fig x). Because the negative decrease in AP levels is dependent on VP, this disrupts feedback loop between AP and VP levels, thus making the optimization later easier (see section x). </p> | ||
| - | < | + | <div align="left"> <!--you can use left/right or center to align the image--> |
| + | <table id="layout" width=10%> <!--change the percentage to determine the size of your image--> | ||
| + | <tr><td> | ||
| + | <img src="https://static.igem.org/mediawiki/2013/4/4a/VP_chem_reaction.JPG" width="100%"> <!--only insert the link, do not change the percentage!--> | ||
| + | </td></tr><tr><td><font size="1">Figure 2</font></td></tr></table></div> | ||
| + | |||
| + | <div align="left"> <!--you can use left/right or center to align the image--> | ||
| + | <table id="layout" width=5%> <!--change the percentage to determine the size of your image--> | ||
| + | <tr><td> | ||
| + | <img src="https://static.igem.org/mediawiki/2013/3/3e/K1_function.jpg"50%"> <!--only insert the link, do not change the percentage!--> | ||
| + | </td></tr><tr><td><font size="1">Figure 2</font></td></tr></table></div> | ||
| + | |||
| + | |||
| + | |||
| + | |||
| + | |||
<p>The negative decrease in AP due to VP is approximately 22% of the positive increase in AP described earlier for all levels of attractant. The negative decrease is described in (3), and the new AP total in (4).</p> | <p>The negative decrease in AP due to VP is approximately 22% of the positive increase in AP described earlier for all levels of attractant. The negative decrease is described in (3), and the new AP total in (4).</p> | ||
Revision as of 10:36, 30 September 2013
Heat Motility
The goal for our heat motility system is to obtain higher concentrations of silk in close proximity to the implant. This is achieved by immobilizing the silk producing bacteria once they are within some distance to the implant, which is enabled by integrating the standard chemotaxis system with the DesK membrane fluidity sensor system. The result is that ''B. Subtilis'' stops moving when it is 37°C, and swims when it is 25°C. In our model we simulate the behaviour of these systems and, if necessary, implement biologically plausible modifications to make it feasible.The chemotaxis system of '' B. subtilis''
We first setup a model for the standard chemotaxis system. This system enables bacteria to seek out areas of higher concentrations of nutrients by modifying the direction of flagella rotations as a response to changes in concentrations of attractants and repellents. An increase in the concentration of attractants results in more clockwise (CW) rotations, and an increase in the concentration of repellents in more counter clockwise (CCW) rotations, which corresponds to an increased chance of swimming straight and tumbeling respectively. This effect is complemented by the systems essential ability to adapt to any concentration of attractant or repellent. Given a homogenous environment, the system will therefore allways maintain the same swimming to tumbling ratios.
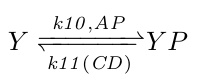
At the molecular level the flagella behaviour is controlled directly by the concentration of phosphorylated CheY (YP): more YP results in more CW rotations (more swimming) and less YP in more CCW rotations (more tumbeling). YP is controlled by phosphorylated CheA concentrations (AP), its natural decay rate, and by CheC_CheD complex concentrations (CD), which act as YP dephosphorylases. Because the actual rate coefficients are unknown, we combined the natural and CD induced dephosphorylation rates by making the k11 rate coefficient a function of CD.
|
| Figure 2 |
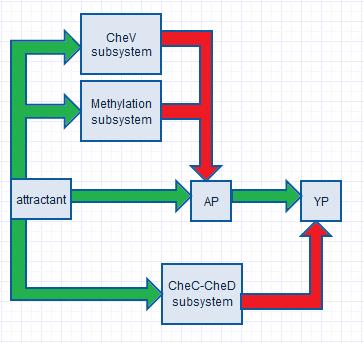
In order to obtain proper swimming behaviour, we require an initial increase and a delayed decrease in YP. The initial YP increase is due to an in increase in AP (which donate their phosphor groups to CheY) as a response to increased attractant concentrations. The decrease in YP is realized by two negative feedback systems, the CheV and the methylation subsystem, which decrease CheA phosphorylation rates, and by one negative feedfoward system, the CheC-CheD subsystem, which increases the YP decay rate.
|
| Figure 2 |
CheA phosphorylation
Inside the cell CheW, CheA and CheV form complexes with the intermembrane receptor protein. When attractants bind to the receptor, CheA undergoes a change in conformation that enables it to be phosphorylated.
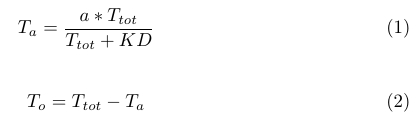
Following the example of David C. and John Ross [x1], we assume the binding and dissociation of attractants with their receptors is fast, and that it can be described with the equillibrium equation (1), where KD is the dissociation constant for the aspartate receptor (which is focus of this model). The concentration of unbound receptors is then given by (2).
|
| Figure 2 |
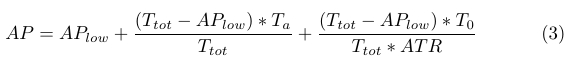
Due to high concentrations of ATP in the cell, we assume similar kinetics for the CheA (A) phosphorylation rate. It then follows that the positive increase in AP levels is proportional to bound receptor (Ta) and unbound receptor (T0) levels, and can be described by (3), where ATR is a constant.
|
| Figure 2 |
The CheV subsystem
The first adaption system of B.Subtilis, the CheV subsystem, contributes to a delayed decrease in YP through a decrease in AP. This is realized by phosphorylated CheV (VP), which obtains its phospfor group from AP, after which it presumably disrupts the bond between the attractant-bound receptor and CheA, thus inhibiting CheA phosphorylation [x2].
Because AP levels are proportional to attractant levels we neglect the AP in our reactions (chem reaction 2) and take the rate coefficient k1 as a linear function of attractant levels (fig x). Because the negative decrease in AP levels is dependent on VP, this disrupts feedback loop between AP and VP levels, thus making the optimization later easier (see section x).
|
| Figure 2 |

|
| Figure 2 |
The negative decrease in AP due to VP is approximately 22% of the positive increase in AP described earlier for all levels of attractant. The negative decrease is described in (3), and the new AP total in (4).
'''insert equations 3 and 4'''
The methylation subsystem
The CheC CheD subsystem
Exact adaption
Motility model
Homogenous and non-homogenous environments
CheC knockout
The effects of temperature
The DesK system
Demonstration