 "
"
Team:HIT-Harbin/Modeling
From 2013.igem.org
| (36 intermediate revisions not shown) | |||
| Line 1: | Line 1: | ||
| - | { | + | {{HIT-Harbin/hidden}} |
| - | + | {{HIT-Harbin/header}} | |
| - | + | ||
| - | + | ||
| - | + | ||
| - | + | ||
| - | + | ||
| - | + | ||
| - | + | ||
| - | + | ||
| - | + | ||
| - | + | ||
| - | + | ||
<html> | <html> | ||
| - | <div id=" | + | <body> |
| - | <div | + | <div id="root"> |
| - | + | <div id="content"> | |
| + | <div id="subheader-bar"> | ||
| + | <div class="site-description"><h4><span class="colored">Modeling</span></h4></div> | ||
| + | </div> | ||
| + | <div class="mainarea"> | ||
| + | <div class="multi-columns"> | ||
| + | |||
| + | <h4 class="hashed"><span>Premises</span></h4> | ||
| + | <p>In the beginning of the project, a mathematical model would be necessary to obtain a clear depict of the system as well as a reasonable expectation of the subsequent experiments. However, to start with, several premises shall be settled in the first step. </p> | ||
| + | <p>(1) The transcription follows the Hill equation, while other reactions follow the mass action principle and the saturation kinetics.<p/> | ||
| + | <p>(2) Part of the parameter values are obtained according to previous publications, while others are assigned in a reasonable way.</p> | ||
| + | <p>(3) The amount of protein binding to promoter is negligible compared to the total amount of protein.</p> | ||
| + | <p>(4) Simulation was done using SBToolbox[4] for matlab and R, a free software environment for statistical computing and graphics<p/> | ||
| + | |||
| + | <h4 class="hashed"><span>The circuit</span></h4> | ||
| + | <p>The following picture is the whole design of our circuit.</p> | ||
| + | <div align="center"> | ||
| + | <img src="https://static.igem.org/mediawiki/2013/7/75/HIT-Harbin_Project_Andgate.png" /> | ||
| + | <p>Figure 1 : A Schematic of the Biological Andgate</p> | ||
</div> | </div> | ||
| - | < | + | <p>As showed in Fig. 1, a protein complex HrpRS is formed following the combination of HrpS and HrpR. HrpRS then binds to the promoter hrpL, triggering transcription of the downstream gene. Two inducible promoters--the isopropylthiogalactoside (IPTG)-inducible Plac and the arabinose-inducible PBAD – are selected as the AND gate inputs. A model based on protein and protein-promoter interactions for the hrp gene regulation is described below:</p> |
| - | + | ||
| + | |||
| + | <h4 class="hashed"><span>1 The Transcription of hrpR and hrpS mRNA </span></h4> | ||
| + | |||
| + | <p>In this case, Hill function [3] is selected as the transcription function to explain quantitatively how IPTG, Arabinose and HrpRS influence the promoters. The Hill function and its curve are shown as</p> | ||
| + | <div align="center"> | ||
| + | <img src="https://static.igem.org/mediawiki/2013/4/42/HIT-Harbin_Project_HillFunction.png" /> | ||
</div> | </div> | ||
| - | <div | + | <div align="center"> |
| - | + | <img src="https://static.igem.org/mediawiki/2013/8/86/HIT-Harbin_Project_HillCurve.png"/> | |
| + | <p>Figure 2 : Example of regulation functions (a)Hill function;(b)Step function;(c)logoid function</p> | ||
</div> | </div> | ||
| + | <p>Where θj appears as the threshold for the regulatory influence of the xj on a target gene and m the steepness parameter. h+, in the function, refers to the positive regulation on the target gene while h- shows the negative one. </p> | ||
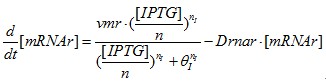
| + | <p> IPTG binds to promoter Plac and trigger the transcription of hrpR_mRNA at the maximum rate constant vmr, </p> | ||
| + | <img src="https://static.igem.org/mediawiki/2013/4/4c/HIT-Harbin_Project_TranscriptionFun1.png"/> | ||
| + | <p>While the amount of hrpR_mRNA degrades at a rate constant Drnar. Hence, the rate of change for hrpR_mRNA are </p> | ||
| + | <img src="https://static.igem.org/mediawiki/2013/f/f8/HIT-Harbin_Project_ODE_Fun1.png"/> | ||
| + | <p>Similarly, we could obtain the reaction for PBAD,</p> | ||
| + | <img src="https://static.igem.org/mediawiki/2013/a/ae/HIT-Harbin_Project_TranscriptionFun2.png"/><p></p> | ||
| + | <img src="https://static.igem.org/mediawiki/2013/5/53/HIT-Harbin_Project_ODE_Fun2.png"/> | ||
| + | |||
| + | <p></p> | ||
| + | <h4 class="hashed"><span>2 Translation of HrpR and HrpS protein</span></h4> | ||
| + | |||
| + | <p>To simplify our model, a few assumptions shall be announced in the beginning.</p> | ||
| + | <p>(1) The amount of translation product is proportional to the mRNA amount;</p> | ||
| + | <p>(2) There is no delay in either synthesis of components or protein transportation.</p> | ||
| + | <p>Then we discuss the translation of HrpR and HrpS protein. HrpR and HrpS are synthesized at the rate constants Kr and Ks respectively, and degrade according to the rate constant Dr and Ds. </p> | ||
| + | <img src="https://static.igem.org/mediawiki/2013/5/5a/HIT-Harbin_Project_Translation1.png"/> | ||
| + | <p>The net forming rates of HrpR and HrpS are shown respectively as </p> | ||
| + | <img src="https://static.igem.org/mediawiki/2013/3/31/HIT-Harbin_Project_ReactionRate1.png"/> | ||
| + | |||
| + | <p></p> | ||
| + | <h4 class="hashed"><span>3 Interaction between protein HrpRS and promoter hrpL</span></h4> | ||
| + | |||
| + | <p>In the beginning, we define the binding rate constant of HrpR and HrpS as Krs, their dissociating rate constant K_rs and the degrading rate constant of HrpRS As we have mentioned,</p> | ||
| + | <img src="https://static.igem.org/mediawiki/2013/0/06/HIT-Harbin_Project_Reaction.png"/> | ||
| + | <p>The net forming rate of HrpRS could be shown as </p> | ||
| + | <img src="https://static.igem.org/mediawiki/2013/9/98/HIT-Harbin_Project_ReactionRate2.png"/> | ||
| + | <p>Activation of the promoter hrpL is similar to that of Plac and PBAD </p> | ||
| + | <img src="https://static.igem.org/mediawiki/2013/2/21/HIT-Harbin_Project_TranscriptionFun3.png"/> | ||
| + | <p>Promoter hrpL triggers the transcription of our target protein. Ko and Do denote the rate constants of synthesis and degradation of output protein.</p> | ||
| + | <p> All equations for the modeling of hrp AND gate are summarize below </p> | ||
| + | <img src="https://static.igem.org/mediawiki/2013/1/13/HIT-Harbin_Project_Whole_Model1.png"/> | ||
| + | |||
| + | <p></p> | ||
| + | <h4 class="hashed"><span>Simulation Result1</span></h4> | ||
| + | |||
| + | <p>Firstly, we test the model when n=1(in one cell). Supposing Kt=Ko=Kr=Ks=30,(Kt, Ko, Kr, Ks is and the parameters connected to RBS strength. In our model we assume that K=3 denotes weak RBS, K=30 denotes middle RBS and K=60 denotes strong RBS. ) By varying the amount of IPTG and Arab, we obtained the output response for the inputs. </p> | ||
| + | <div align="center"> | ||
| + | <img src="https://static.igem.org/mediawiki/2013/7/7f/HIT-Harbin_Project_SimResult1.png"/> | ||
| + | <p>Figure 3 : Simulation Results of hrpLANDgate</p> | ||
</div> | </div> | ||
| - | </ | + | <p>As we can work out from figure 3, the output response stays at a low level when at least one of the two inputs (IPTG and Arabinose) stays low in quantity. The response reaches to a high level only when both inputs appear high in quantity.</p> |
| - | |||
| + | <h4 class="hashed"><span>Model of proportional amplifier</span></h4> | ||
| + | <div align="center"> | ||
| + | <img src="https://static.igem.org/mediawiki/2013/c/c6/HIT-Harbin_Project_Schematic.png" /> | ||
| + | <p></p>Figure 4 : A Schematic of the Biological Proportional Operational MU-circuit | ||
| + | </div> | ||
| + | <p>Based on the hrp AND gate, we substituted the promoter PtetR for Plac (PtetR is constitutively on and could be inhibited by the tetR protein), and add a tetR protein generator to the promoter hrpL’s downstream. The translation of tetR and our future output are triggered by the same promoter, as they are transcripted into the same mRNA single strand. </p> | ||
| + | <img src="https://static.igem.org/mediawiki/2013/0/09/HIT-Harbin_Project_Transcription3.png"/> | ||
| + | <p>The reaction rate is shown as </p> | ||
| + | <img src="https://static.igem.org/mediawiki/2013/6/66/HIT-Harbin_Project_ReactionRate3.png"/> | ||
| + | <p>Protein tetR have a negative effect on the Plac promoter, so the hrpS transcription rate under promoter PtetR could be depict as</p> | ||
| + | <img src="https://static.igem.org/mediawiki/2013/4/40/HIT-Harbin_Project_ReactionRate4.png"/> | ||
| + | <p>All the equations for the modeling of proportional amplifier are summarize below</p> | ||
| + | <img src="https://static.igem.org/mediawiki/2013/7/7c/HIT-Harbin_Project_Whole_Model2.png"/> | ||
| + | <p></p> | ||
| + | <h4 class="hashed"><span>Simulation Result2</span></h4> | ||
| + | <p>We test the output response by varying IPTG, when given different combination of RBS strength. To reduced simulation times, Taguchi Design is used in our model. And if possible, we would put it into wet experiment. The Taguchi Design table for Ko, Kt, Kr, Ks is given in table1</p> | ||
| + | <div align="center"> | ||
| + | <p>Table 1 : Experiment for Taguchi Design</p> | ||
| + | <img src="https://static.igem.org/mediawiki/2013/4/47/HIT-Harbin_Project_table1.png"/> | ||
| + | </div> | ||
| + | <p>Then, we got a series of data of the steady states of input and output and plot them together. Results are shown in figure 5</p> | ||
| + | <div align="center"> | ||
| + | <img src="https://static.igem.org/mediawiki/2013/5/5c/HIT-Harbin_Project_SimResult2.png"/> | ||
| + | <p>Figure 5 : Simulation Results for Output Response VS IPTG input</p> | ||
| + | </div> | ||
| + | <p>Figure 5 demonstrates that (Ko=3, kt=3, Kr=3, Ks=3), (Ko=30, Kt=60, Kr=3, Ks=30) and (Ko=60, Kt=30, Kr=3, Ks=60) present a better linear relationship between input and output than other experiments. Linear regression is used to describe the relationship between input IPTG concentration and output response. </p> | ||
| + | <div align="center"> | ||
| + | <p>Table 2 : Linear Regression of Simulation Result for Experiment 2, 3, 6</p> | ||
| + | <img src="https://static.igem.org/mediawiki/2013/3/37/HIT-Harbin_Project_Table2.png"/> | ||
| + | </div> | ||
| + | <p>Here we invent a coefficient m(m=b/a) where b is the concentration range of linear area between output response and IPTG and a the whole range of IPTG concentration. </p> | ||
| + | <div align="center"> | ||
| + | <img src="https://static.igem.org/mediawiki/2013/4/49/HIT-Harbin_Project_SimResult3.png"/> | ||
| + | <p>Figure 6 : Effect Plot for m</p> | ||
| + | </div> | ||
| + | <p> In figure 6, we found that the width of linear section reaches its maximum when Ko=30, Kt=3 or 30, Kr=3, Ks=30.</p> | ||
| + | <p> Parameters and variables of the modeling are listed below.</p> | ||
| + | <div align="center"> | ||
| + | <p>Table 3 : Parameters used in the Model</p> | ||
| + | <img src="https://static.igem.org/mediawiki/2013/a/a4/HIT-Harbin_Project_parameter.png"/> | ||
| + | <p>Table 4 : Variables used in the Model</p> | ||
| + | <img src="https://static.igem.org/mediawiki/2013/b/bf/HIT-Harbin_Project_variable.png"/> | ||
| + | <p>Table 5 : States used in the Model</p> | ||
| + | <img src="https://static.igem.org/mediawiki/2013/b/b7/HIT-Harbin_Project_state.png"/> | ||
| + | <p>Table 6 : Observation used in the Model</p> | ||
| + | <img src="https://static.igem.org/mediawiki/2013/3/3d/HIT-Harbin_Project_observation.png"/> | ||
| + | </div> | ||
| + | <p>PS : Parameters are constants in our model. Variables are what we controlled in one experiment.States are dependent variable changing in one experiment. Observation is our target output</p> | ||
| - | + | <div class="cta-box"> | |
| + | <a href="https://2013.igem.org/Team:HIT-Harbin/Experiments" class="custom-button">Learn More</a> | ||
| + | <p>Click here and get more details about the experiments.</p> | ||
| + | </div> | ||
| + | |||
| + | |||
| + | |||
| + | <h4 class="hashed"><span>Reference</span></h4> | ||
| + | |||
| + | <p>[1] Baojun Wang. The Design and Construction of a Set of Modular Synthetic BioLogic Devices for Programming Cells. IFMBE 2009</p> | ||
| + | <p>[2] Baojun Wang et al. Engineering modular and orthogonal genetic logic gates for robust digital-like synthetic biology[J]. Nature Communications: 2011, 2</p> | ||
| + | <p>[3] Hidde de Jong. Modeling and Simulation of Genetic Regulatory Systems: A Literature Review[J]. Journal of Computational Biology: 2002, 9(1): 67~103</p> | ||
| + | <p>[4] Schmidt H, Jirstrand M. Systems Biology Toolbox for MATLAB: a computational platform for research in systems biology. Bioinformatics2006,22: 514-515</p> | ||
| + | |||
| + | </div> | ||
| + | </div> | ||
| + | </div> | ||
| + | </div> | ||
| + | <body> | ||
| + | <html> | ||
Latest revision as of 17:15, 27 September 2013
Modeling
Premises
In the beginning of the project, a mathematical model would be necessary to obtain a clear depict of the system as well as a reasonable expectation of the subsequent experiments. However, to start with, several premises shall be settled in the first step.
(1) The transcription follows the Hill equation, while other reactions follow the mass action principle and the saturation kinetics.
(2) Part of the parameter values are obtained according to previous publications, while others are assigned in a reasonable way.
(3) The amount of protein binding to promoter is negligible compared to the total amount of protein.
(4) Simulation was done using SBToolbox[4] for matlab and R, a free software environment for statistical computing and graphics
The circuit
The following picture is the whole design of our circuit.
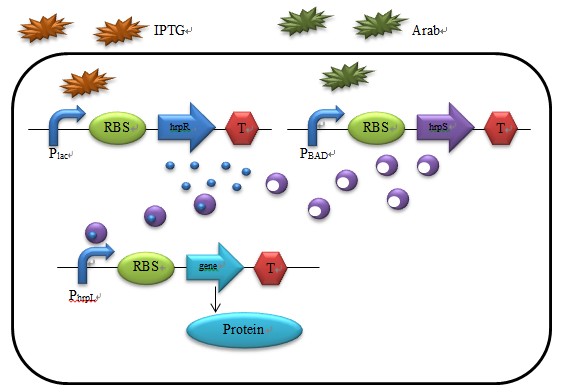
Figure 1 : A Schematic of the Biological Andgate
As showed in Fig. 1, a protein complex HrpRS is formed following the combination of HrpS and HrpR. HrpRS then binds to the promoter hrpL, triggering transcription of the downstream gene. Two inducible promoters--the isopropylthiogalactoside (IPTG)-inducible Plac and the arabinose-inducible PBAD – are selected as the AND gate inputs. A model based on protein and protein-promoter interactions for the hrp gene regulation is described below:
1 The Transcription of hrpR and hrpS mRNA
In this case, Hill function [3] is selected as the transcription function to explain quantitatively how IPTG, Arabinose and HrpRS influence the promoters. The Hill function and its curve are shown as
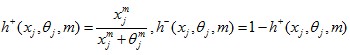
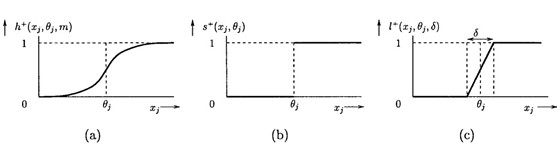
Figure 2 : Example of regulation functions (a)Hill function;(b)Step function;(c)logoid function
Where θj appears as the threshold for the regulatory influence of the xj on a target gene and m the steepness parameter. h+, in the function, refers to the positive regulation on the target gene while h- shows the negative one.
IPTG binds to promoter Plac and trigger the transcription of hrpR_mRNA at the maximum rate constant vmr,
While the amount of hrpR_mRNA degrades at a rate constant Drnar. Hence, the rate of change for hrpR_mRNA are
Similarly, we could obtain the reaction for PBAD,
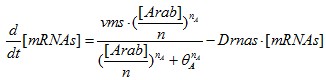
2 Translation of HrpR and HrpS protein
To simplify our model, a few assumptions shall be announced in the beginning.
(1) The amount of translation product is proportional to the mRNA amount;
(2) There is no delay in either synthesis of components or protein transportation.
Then we discuss the translation of HrpR and HrpS protein. HrpR and HrpS are synthesized at the rate constants Kr and Ks respectively, and degrade according to the rate constant Dr and Ds.
The net forming rates of HrpR and HrpS are shown respectively as
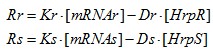
3 Interaction between protein HrpRS and promoter hrpL
In the beginning, we define the binding rate constant of HrpR and HrpS as Krs, their dissociating rate constant K_rs and the degrading rate constant of HrpRS As we have mentioned,
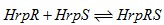
The net forming rate of HrpRS could be shown as

Activation of the promoter hrpL is similar to that of Plac and PBAD
Promoter hrpL triggers the transcription of our target protein. Ko and Do denote the rate constants of synthesis and degradation of output protein.
All equations for the modeling of hrp AND gate are summarize below
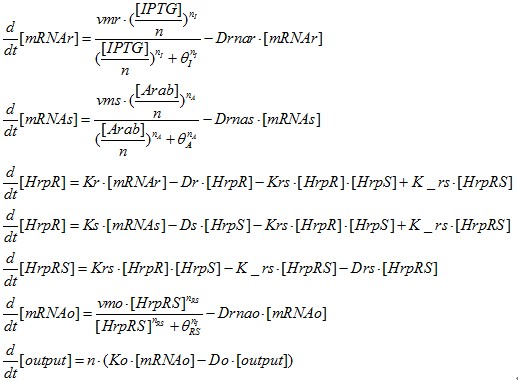
Simulation Result1
Firstly, we test the model when n=1(in one cell). Supposing Kt=Ko=Kr=Ks=30,(Kt, Ko, Kr, Ks is and the parameters connected to RBS strength. In our model we assume that K=3 denotes weak RBS, K=30 denotes middle RBS and K=60 denotes strong RBS. ) By varying the amount of IPTG and Arab, we obtained the output response for the inputs.
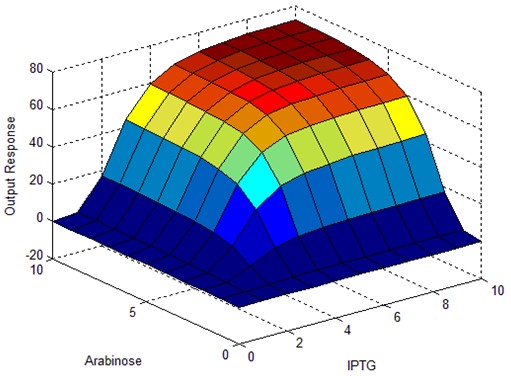
Figure 3 : Simulation Results of hrpLANDgate
As we can work out from figure 3, the output response stays at a low level when at least one of the two inputs (IPTG and Arabinose) stays low in quantity. The response reaches to a high level only when both inputs appear high in quantity.
Model of proportional amplifier
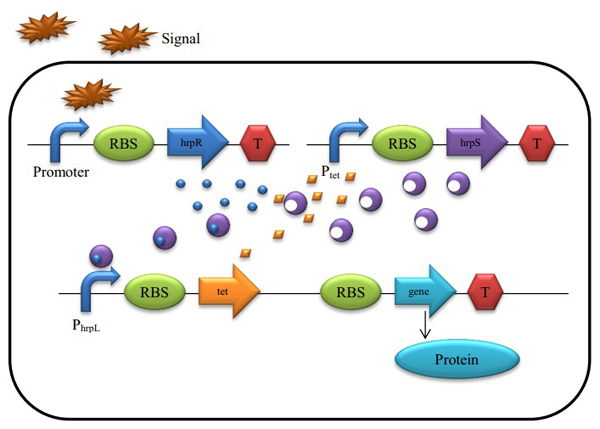 Figure 4 : A Schematic of the Biological Proportional Operational MU-circuit
Based on the hrp AND gate, we substituted the promoter PtetR for Plac (PtetR is constitutively on and could be inhibited by the tetR protein), and add a tetR protein generator to the promoter hrpL’s downstream. The translation of tetR and our future output are triggered by the same promoter, as they are transcripted into the same mRNA single strand.
The reaction rate is shown as
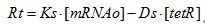
Protein tetR have a negative effect on the Plac promoter, so the hrpS transcription rate under promoter PtetR could be depict as
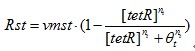
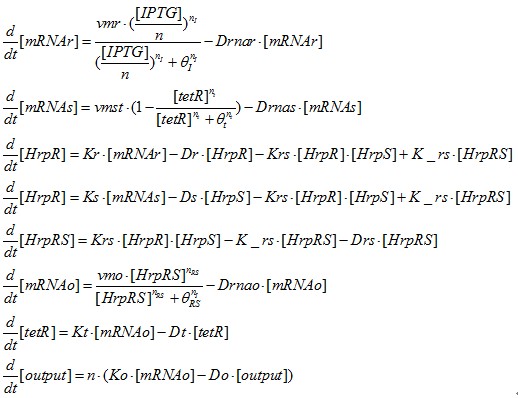
All the equations for the modeling of proportional amplifier are summarize below
Simulation Result2
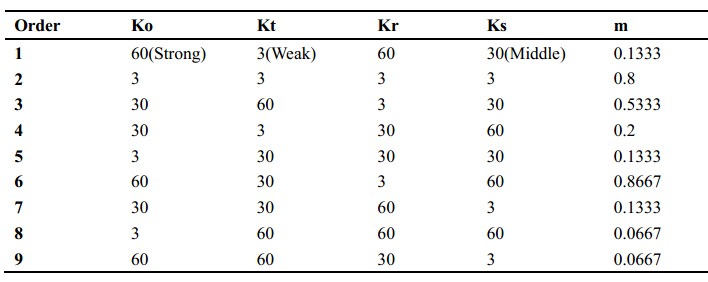
We test the output response by varying IPTG, when given different combination of RBS strength. To reduced simulation times, Taguchi Design is used in our model. And if possible, we would put it into wet experiment. The Taguchi Design table for Ko, Kt, Kr, Ks is given in table1
Table 1 : Experiment for Taguchi Design
Then, we got a series of data of the steady states of input and output and plot them together. Results are shown in figure 5
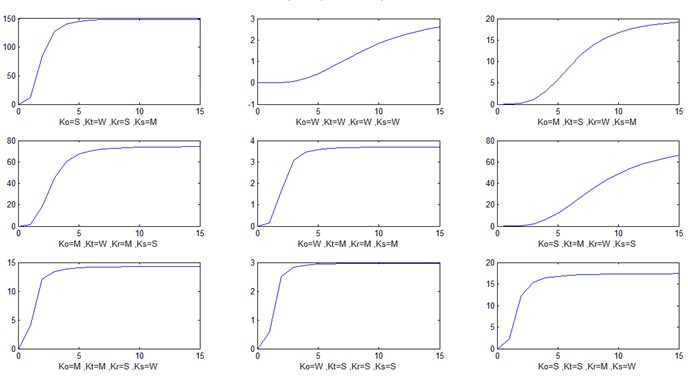
Figure 5 : Simulation Results for Output Response VS IPTG input
Figure 5 demonstrates that (Ko=3, kt=3, Kr=3, Ks=3), (Ko=30, Kt=60, Kr=3, Ks=30) and (Ko=60, Kt=30, Kr=3, Ks=60) present a better linear relationship between input and output than other experiments. Linear regression is used to describe the relationship between input IPTG concentration and output response.
Table 2 : Linear Regression of Simulation Result for Experiment 2, 3, 6
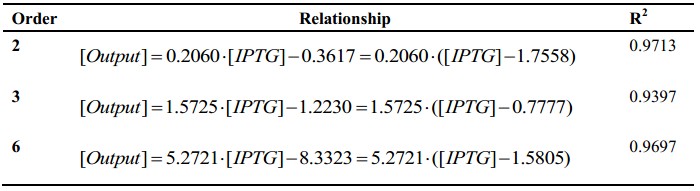
Here we invent a coefficient m(m=b/a) where b is the concentration range of linear area between output response and IPTG and a the whole range of IPTG concentration.
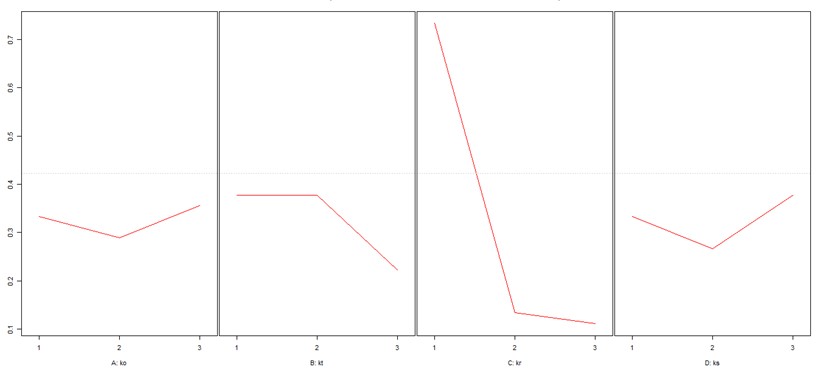
Figure 6 : Effect Plot for m
In figure 6, we found that the width of linear section reaches its maximum when Ko=30, Kt=3 or 30, Kr=3, Ks=30.
Parameters and variables of the modeling are listed below.
Table 3 : Parameters used in the Model
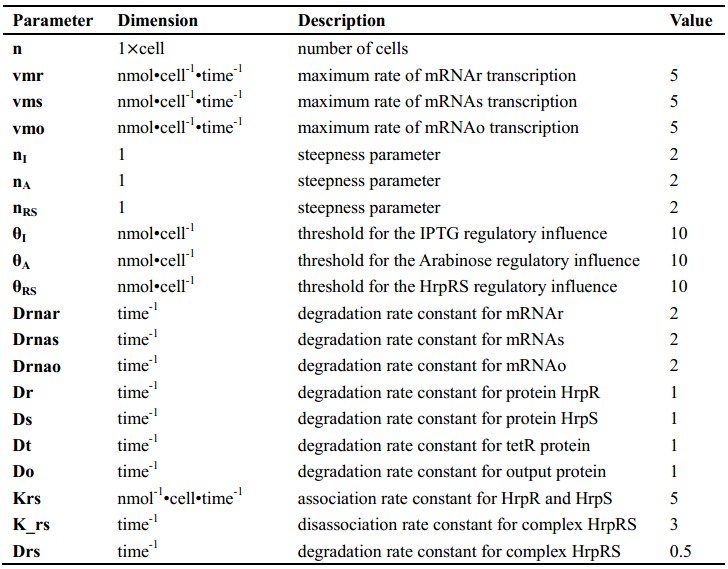
Table 4 : Variables used in the Model
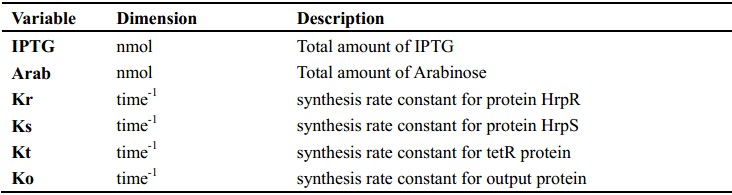
Table 5 : States used in the Model
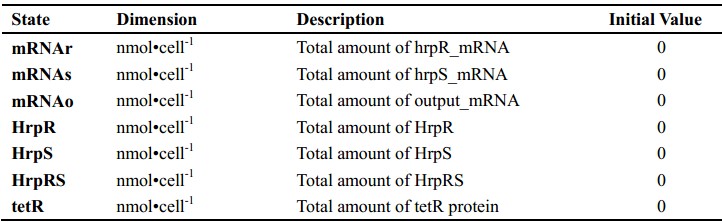
Table 6 : Observation used in the Model

PS : Parameters are constants in our model. Variables are what we controlled in one experiment.States are dependent variable changing in one experiment. Observation is our target output
Click here and get more details about the experiments.
Reference
[1] Baojun Wang. The Design and Construction of a Set of Modular Synthetic BioLogic Devices for Programming Cells. IFMBE 2009
[2] Baojun Wang et al. Engineering modular and orthogonal genetic logic gates for robust digital-like synthetic biology[J]. Nature Communications: 2011, 2
[3] Hidde de Jong. Modeling and Simulation of Genetic Regulatory Systems: A Literature Review[J]. Journal of Computational Biology: 2002, 9(1): 67~103
[4] Schmidt H, Jirstrand M. Systems Biology Toolbox for MATLAB: a computational platform for research in systems biology. Bioinformatics2006,22: 514-515