"
"
Team:Heidelberg/Project/Indigoidine
From 2013.igem.org


Project

Notebook


Human Practice


Indigoidine. Proving Modularity of NRPS by Shuffling Domains.

Highlights
- Endogenous PPTase of E. coli was proven sufficient for activation of the P. lumninescens derived indigoidine synthetase indC
- Production of Indigoidine is improved by co-transformation of host strain with supplementary PPTases
- Synthetic T-Domains generated by consensus and guided random design yield functional indigoidine synthetases
- Domain shuffling works across modules derived from different pathways and host organisms
- Strong influence on the yield of indigoidine production was proven for the interaction of PPTase and T-domains
Abstract
An integral characteristic of synthetic biology yet often undermined is the ability to learn fundamental knowledge by systematically perturbing a biological system. Non-ribosomal peptide synthetases (NRPS) are predestinated for such a trial and error approach. Their hierarchical organization into modules and domains offer a unique opportunity to spin around their inherent logical assembly and observe if their functionality is preserved. Following this idea, we prove the interchangeability of NRPS domains at the example of indC from Photorhabdus luminescens laumondii TT01 (DSM15139). The native NRPS domains have been replaced with domains from other bacterial organisms and fully synthetic domains. To quantify the NRPS efficiency we established an indigoidine assay based on OD measurement of the blue-colored pigment. Interestingly, we find that our data points out the dependence on the T-domain and the 4'-Phosphopanthetheinyl-transferases (PPTases), resulting in different levels of indigoidine synthesis. Furthermore, we introduce HiCT - High throughput protocols for circular polymerase extension Cloning and Transformation - a new standard for the assembly of combinatorial gene libraries (RFC 99).


Introduction
Most modules of non-ribosomal peptide synthetase (NRPS) pathways consist of three domain types: condensation, adenylation and thiolation domain (see Figure 1a), also called peptidyl-carrier-protein domain (PCP)-domain (reviewed in

Besides these fundamental domains (C-domain, A-domain and T-domain), some NRPS modules incorporate additional domains enlarging the amount of potential catalytic reactions, such as cyclization, epimerization or oxidation of the amino acid [Reference].
For example, a single module of P. luminescens laumondii TT01 (DSM15139) contains an internal oxidation domain (Ox-domain) in its A-domain and a special TE-domain (Figure 2a). This enzyme first adenylates L-glutamine (A-domain), which is then attached to the T-domain. The TE-domain cleaves and catalyzes the cyclization of the substrate, which is further oxidized by the Ox-domain. The oxidation of two cyclic glutamines results in the formation of an insoluble small molecule (Figure 2b)[Reference].

Results
Expression of Functional Indigoidine Synthetase indC derived from P. lumninescens in five substrains of E. coli
Endogenous PPTAse of E. coli Is Sufficient for Activation of the P. lumninescens Derived Indigoidine Synthetase IndC
The open reading frame of the native indigoidine synthetase indC was amplified from genomic DNA of P. lumninescens and cloned into a plasmid under the control of an lac-inducible promoter. This indC expression cassette was transformed into different substrains of E. coli, namely DH5alpha, MG1655, BAP1, TOP10 and NEB Turbo. All of these host strains express the endogenous PPTAse entD which is responsible for the transfer of the 4'-phosphopantetheine residue from coenzyme A to the apo-domain of EntF, a T-domain in the enterobactin pathway(<bib id="pmid:9214294"/>). As depicted in Figure 6a, entD does not exhibit strict substrate speceficity in being restricted to activating domains of the enterobactin pathway, but is able to activate the T-domain of indC as determined by the blue phenotype of the transformed cells. Except for NEB Turbo cells, all transformed host strains displayed a decelerated growth and significantly smaller colonies on plate when compared to the negative control. The blue phenotype developed late after transformation ranging from first blue colonies after 24 h and taking up to three days for visible poduction of the blue pigment. NEB Turbo showed regular colony growth and developed a strong blue phenotype upon induction with IPTG. As all host strains were able to express the functional indigoidine sythetase derived from a different species, further experiments were only conducted with one E. coli strain. Due to its simplicity in handling and sufficient expression of the constructs, the substrain TOP10 was chosen.
Improved Production of Indigoidine by Co-transformation of Host Strain with Supplementary PPTases
The expression of indC under activation by endC was sufficient for easy detection of indigoidine production on plates harboring indC-carrying cells. In order to determine, whether the amount of indigoidine production in the E. coliTOP10 cells is dependent on the quality of the interacting of indC with the PPTase, four PPTase dervied from varying origins were selected and amplified from the genome of the hosts of origin. E. coliTOP10 cells were co-transformed with plasmids coding for the different PPTases and the plasmid containing the expression cassette for indC. As reference for the endogenous PPTase activity served cells only transformed with the indC plasmid. Irrespective of the PPTase, growth of colonies was retarded. Remarkably however, colonies co-transformed with the PPTase plasmid remained of smaller size than the ones only carrying the indC construct. On the other side, indigoidine production was more diffuse in the latter cells with secretion of the blue pigment into the agar (Figure 6b, indC) and only slight blue-greenish coloring of the colonies. The four PPTases additionally introduced into the TOP10 cells were all shown to be functional (blue phenotype of the transformants, Figure 6b), but lead to the retention of most of the indigoidine within the cells. Colonies of cells transformed with thess constructs, were of convex shape and of distinct, dark blue color. Overall, cells carrying an additional PPTase showed increased indigoidine production compared to the cells relying on the endogenous entD.
Synthetic T-Domains Generated by Consensus and Guided Random Design Method are Functional
The main structurel characteristic of NRPSs is their modular composition on different levels. The indogoidine synthetase indC is a one-module NRPS comprised of the three domains, namely AoxA, T and TE. Since the functionality of this NRPS is detectable by the bare eye, it offers a perfect and simple experimental set-up for proof of principle experiments regarding the interchangeability of domains from different NRPS. Out of the three domains in indC, the T-domain is suppossed to exhibit the least substrate specificity and was thus chosen for first domain shuffeling approaches. For the initial definition of T-domain boundaries of indC, we used PFAM, a web-tool which allows -amongst other functions- for the prediction of NRPS's module and domain boundaries. Following the boundary prediction, we choose a two-pronged domain shuffling approach: First, we transferred native T-domains derived from either different host species and/or NRPSs of entirely different function into the indC indigoidine synthetase. Second, we deviced three methods for the generation of synthetic T-domains based on different NRPS libraries generated by BLAST search against either specific subranges of host organisms or restricting the query sequence to be BLASTed.(link) As depicted in Figure 6, both approaches lead principally to fully functional indCs. The synthetic T-domains 1, 3 and 4 showed the same diecreased growth and indigoidin production on plates as did the native T-domain derived from P. lumninescens. The colonies obtained after co-transformation with supplementary PPTase plasmid were small in size and of dark blue color. Compared to synthetic T-domain 5, indigoidin production started earlier (approximately after 24-30 hours). In contrast to the synthetic domains 1,3 and 4 which were designed by the consensus method and showed medium to high similarity to the sequence of origin, synthetic domain 5 was generated by the guided random method. Remarkably, even though 39 out of the 62 amino acids of the original T-domain were exchange, the indigoidine synthetase with this T-domain was still functional. Closer analysis of the sequence compared to the original indC T-domain sequence showed, that the characteristics of the amino acid sequence, i. e. for instance polar or charged amino acids, were retained in 72% of the sequence. Also, the GGXS core sequence of the T-domain at which the activation by the PPTas occurs was conserved.
Domain Shuffling Works across Modules Derived from Different Pathways and Host Organisms
Multiple web-tools exist which offer the prediction of NRPS module and domain boundaries. One of the most common used prediction tools is PFAM which we used as a starting point to determine the best method for defining domain boundaries. PFAM predicted large linker structures between the end of the A and the beginning of the T-domain (compare Figure 8, T-boundaries from B to two). Using these domain boundaries for the native T-domains did only yield one functional native T-domain(results not depicted). We tried to improve this yield by defining new T-domain boundaries based on the predictions of PFAM and multiple sequence alingments with the respective homology libraris at the predicted linker regions. Boundaries were set closer to the preceeding A-domain, at regions were less sequence conservation was observed. Figure 8 shows the indigoidine production after insertion of native T-domains with revised boundaries. T-domain boundary combinations A1, A2 and C1 yielded functional T-domains. As the indigoidine production and cell growth was best for the T-domains created with boundary combination A2, this boundary design was used for all subsequent cloning strategies. Figure 9 depicts the success of this boundary desgin as two additional native T-domains derived from delH4 and bpsA (indigoidine synthetase) led to functional indCs and the production of indigoidine. In addition, the native T-domain from plu2642 which was already shown to be functional(compare Figure 7) showed faster and increased indigoidine production (deep blue agar plate, lower right panel on Figure 9). The results obtained from this experiments proofed two concepts. First, domain shuffling is possible across different species as the T-domains of delH4 and bpsA were derived from D. acidovorans and S. lavendulae lavendulae, respectively and were functional in E. coli. Also, shuffling of domains from modules of different substrate specificity has been proofen herein. Second, manually adjusting the boundaries predicted by PFAM based on MSA is a functional method to predict functional T-domain boundaries.
PPTase and T-domain Interaction Strongly Influence the Yield of Indigoidine Production
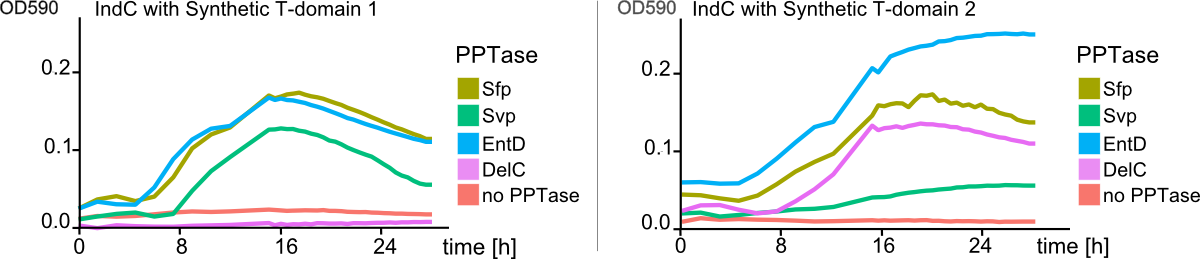
As the previous experiments of shuffled T-domains and different combinations of PPTAses showed, there are substantial differences in cell growth and indigoidine production when observed on plates. However, this observations were always of qualitative nature and did not give any insight into quantitative differences. We approached the quantification of indigoidine production in a time-resolved and highly-combinatorial manner: plasmids coding for indC containing all synthetic (4) and native T-domains (3) proven functional by the previous assays were co-transformed with the four functional PPTases. The indigoidine production over time (30 hours) was measured at its absorption maximum of 590 nm and corrected for the contribution of the cellular components in the medium as described in the methods. As Figure 10 shows, synthetic T-domains in combination with different PPTases lead to distinct differneces in indogoidin production. As a comparisons between the left and right panel of Figure 10 shows, PPTases working best with one T-domain might not lead to any indigoidine production when used with a indigoidine synthetase containing a different T-domain (Figure 10, pink line, delC). In addition, as distinctly visible in Figure 11, indigoidine production over time is not a strictly monoton function (blue line). After an indigoidin production peak at 16 hours, indigoidine production caused by indC containing the synthetic domain 4 decreases again. The indigoidin production in cells transformed with indC/synthetic T-domain 3 is still increasing.


Discussion
In this subproject, we wanted to set the basis for engineering entirely synthetic NRPS modules composed of user-defined domains. As model system, we used the unimodular indigoidine synthetase NRPS from P. luminescens subsp. Laumondii TT01. We predicted the modular composition and domain borders of IndC using our own NRPS-Designer software. We then started by replacing the native IndC T-domain with T-domains derived from different NRPS pathways from different bacterial strains, among those the T-domain from the BpsA indigoidine synthetase from S. lavendulae ATCC11924. Constructs were transformed into E. coli alongside with an PPTase expression cassette in order to screen for functional IndC variants. As hoped, a subset of the natural T-domains were functioning in context of the IndC scaffold module, leading to indigoidine production and thereby blue coloring of colonies and corresponding liquid cultures. We then engineered a variety of synthetic T-domains derived from consensus sequences of different natural T-domains. Again, a subset of these T-domains successfully maintained indigoidine production (Fig. 9). Notably, one of our engineered IndC construcats showed an indigoidine production even higher compared to the wild-type IndC (T-domain Plu2642; Figure 3). This is particularly remarkably as our results contradict to previous studies of NRPS domains that reported the native T-domain of the indigoidine synthetase BpsA to be absolutely essential for protein function (and therefore not replaceable by other T-domains). ([Owen2012]). However, to our surprise, the BpsA T-domain-containing IndC construct did not yield any detectable indigoidine production, although BpsA shares strong sequence homology with IndC. We hypothesized, that the selection of the exact border could be critical for maintaining domain functionality when introduced into a novel NRPS module scaffold. Therefore, we amplified different BpsA T-domain variants differing in their domain border and introduced them into the IndC scaffold. Remarkably, a subset of the resulting IndC variants showed successful indigoidine production. We thus revaluated all native and synthetic T-domains in light of this finding and performed a second screening round in which we were able to rescue even more functional IndC variants, proofing our abovementioned hypothesis. We also co-transformed all engineered IndC construct bearing different natural and synthetic T-domains with four different PPTase expression constructs. To our surprise, the T-domains used not only determined general efficiency of indigoidine production, but also the efficiency of NRPS activation by the different activating PPTases. In conclusion we were able to demonstrate, that it is indeed possible to replace single Domains from NRPS modules, while preserving or even enhancing its functionality. In addition, we established an approach for the design of synthetic T-domains and proved their functionality by introducing them into the indigoidine synthetase indC scaffold. Moreover, we established a high throughput protocol for circular polymerase extension cloning and transformation (Hi-CT) (BBF RFC 99), which we applied for our domain shuffling approach. In summary, we created a library of 58 engineered indC variants. In addition we perforemd measurement of blue pigement production over time, which gave us novel insights in how NRPS domains should be designed, where the domain borders between different domains in a single NRPS module have to be set and which domains from respective NRPS pathways and bacterial strains can be used, when creating novel engineered NRPS pathways. We implemented our findings into the "NRPS-Designer" Software, so that the underlying algorithm for NRPS design takes into consideration the abovementioned findings (e.g. domain border setting) which are certainly crucial for successful in silico prediction of functional NRPSs. Thereby, our project pioneers the research on high-throughput methods for creation of synthetic NRPS modules composed of user-defined domains. We believe that our findings will highly contribute to future development of custom NRPSs.Methods
Table 1: Bacterial strains and genes of interest derived thereof. The indigoidine synthetase bpsA was kindly supplied by the Fussenegger lab at ETH Zurich.| Strain | Gene | Function |
|---|---|---|
| Photorhabdus luminescens laumondii TT01 DSM15139 | indC | Indigoidine synthetase |
| Streptomyces lavendulae lavendulae | bpsA | Indigoidine synthetase |
| Photorhabdus luminescens laumondii TT01 DSM15139 | ngrA | PPTase |
| Escherischia coli BAP1 | sfp | PPTase |
| Streptomyces verticillus ATCC15003 | svp | PPTase |
| Escherischia coli MG1655 | entD | PPTase |
| Delftia acidovorans SPH-1 | delC | PPTase |
Cloning Strategy
We assembled the different indC variants on a chloramphenicol resistance backbone (pSB1C3) with an IPTG-inducable lac-promoter, the ribosome binding site BBa_B0034 and the coding sequence of the respective indC variant. The indC plasmids should be co-transformed with a PPTase construct to get a significant and fast indigoidine production. Therefore, we used a second plasmid backbone carrying a kanamycin resistance (pSB3K3). We assembled five pSB3K3 derived plasmids, each carrying an expression cassette with an IPTG induceable lac-promotor, the BBa_B0029 ribosome binding site and the coding sequence of the respective PPTase (sfp, svp, entD, delC and ngrA; see Table 1). We used E. coli TOP10 for co-transformations of the possible combination of the indC variants (2) and all PPTase plasmids (5).Circular Polymerase Extension Cloning
Circular Polymerase Extension Cloning (CPEC) is a sequence-independent cloning method based on homologous recombination of double-strand DNA overlaps of vector and insert(s) (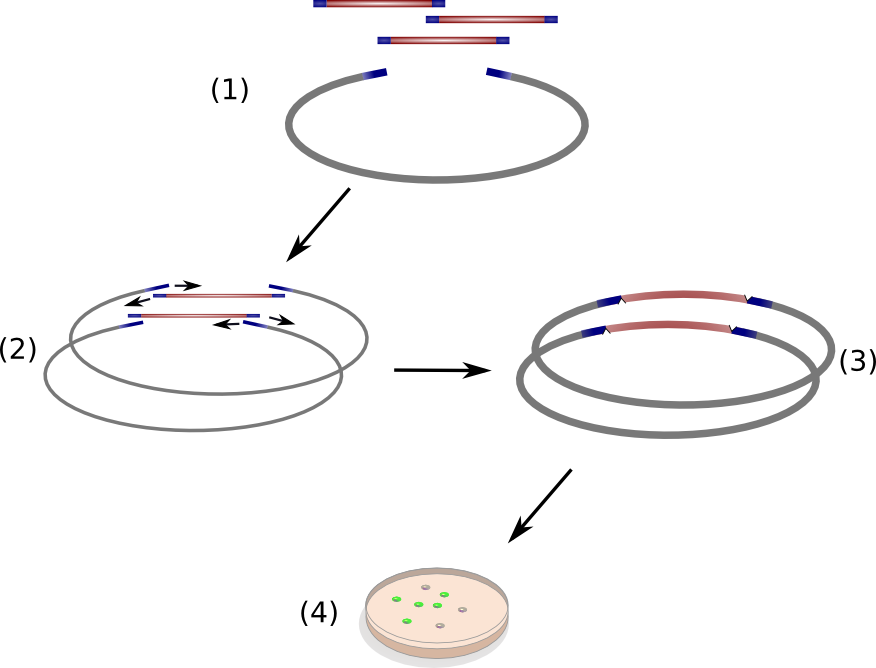
- initial denaturation at 98°C for 30 s
- 5 cycles with:
- denaturation step at 98°C for 5 s.
- annealing step at 53°C for 15 s
- elongation/filling up step at 72°C for 20 s/kbp of longest fragment.
- final extension at 72°C for three times the calculated elongation time.
- (Optional: Hold at 12°C )
After CPEC, 5 µl of of the reaction mixture were used for transformation. The remaining volume was used for quality check on a gel with small pockets (10 to 20 µl in volume). The following primers were used for all CPEC experiments into standard BioBrick backbones: BBa_J04450_stem_loop_fw, Bba_J04450_B0034-RBS_ATG_rv, Bba_J04450_B0029-RBS_ATG_rv. The reverse primers (rv) differ in the ribosomal binding sites they introduce: Bba_J04450_B0034-RBS_ATG_rv contains the ribosomal binding site used in J04450, Bba_J04450_B0029-RBS_ATG_rv introduces the ribosomal binding site B0029 which is of weaker than B0034.
Generation of the ccdB-Ind construct
To minimize the background colonies when exchanging the T-domain of the indigoidine synthetase we generated the ccdB-Ind plasmid where we replaced the indC T-domain with the ccdB gene (Modul structure: AoxA-ccdb-TE) which kills E. coli TOP10 cells but not E. coli OneShot ccdB survival cells. Test-transformation in both E. coli TOP10 and the E. coli OneShot ccdB survival cells showed that background colonies could be eliminated by this strategy (Plattenbild top10 vs survival cells). We used the ccdB-Ind for all further CPEC experiments aiming to swap T-domains. Primers for the backbone CPEC fragments were designed to facilitate the amplification of the entire ccdB-Ind plasmid while omitting the ccdB sequence (compare to Figure??). Assembly of the finale indigoidine synthase products with exchanged T-domain was achieved by CPEC as described or above or HiCT (RFC 99).Examination of T-domain borders
We exchanged the T-domain of indC with the T-domain of bpsA and varied the size of the exchanged DNA sequence, thus examining several domain borders (compare to Figure ??). We used the CPEC assembly method and the indC-ccdB plasmid for this approach.Test of various T-domains from different NRPS modules
For the investigation of additional T-domains from less related NRPS modules, we selected the border combination b31??? which was positive in the test with bpsA. We used the T-domains of the following genes: Table 2: Genes of which T-domains have been extracted and introduced to indC| Gene | Organism | Original function |
|---|---|---|
| entF | Escherichia coli K-12 | NRPS module of enterobactin synthesis pathway |
| tycA1 | Brevibacillus parabrevis | 1st module in tyrocidine synthesis cluster |
| tycC6 | Brevibacillus parabrevis | Last module in tyrocidine synthesis cluster |
| delH4 | Delftia acidovorans SPH-1 | 2nd but last module in delftibactin synthesis cluster |
| delH5 | Delftia acidovorans SPH-1 | Last module in delftibaction synthesis cluster |
| plu2642 | P. luminescens DSM15139 | NRPS of unknown function (one module: A-T-TE) |
| plu2670 | P. luminescens DSM15139 | module of NRPS pathway of unknown function |
All T-domains from the respective genomes were amplified using CPEC primers with a uniform 5’-end and a 3’-end specific for the respective gene. For the assembly of the hybrid-indigoidine synthetases by CPEC, the indC-ccdB construct was used.
Creation of synthetic T-domains
All R scripts used in the following sections are based on R version R-3.0.1. Different assumptions about the evolutionary conservation of T-domains were examined: i) conservation of a specific module across different species, ii) conservation of T-domains across different modules for the same species, iii) conservation of T-domains across different species, iv) conservation of similar modules across different species. According to these three assumptions, different libraries of homologous protein sequences were generated using ncbi protein BLAST (blast.ncbi.nlm.nih.gov) with standard parameters:- query sequence: indC; Search set: non-redundant protein sequences without organism restriction
- query sequence: indC T-domain; Search set: non-redundant protein sequences within P. luminescens
- query sequence: indC T-domain; Search set: non-redundant protein sequences without organism restriction
- query sequences: indC, bpsA, entF, delH5 and tycC6; Search set: non-redundant protein sequences without organism restriction;
The 50 closest related protein sequences contained in each the library were subjected to a multiple sequence alignment (MSA) using clustalO (http://www.ebi.ac.uk/Tools/msa/clustalo/). with standard parameters for protein alignments. For library generation iv), each query sequence was BLASTed separately and the 50 best results of each query were combined i.e. a total of 250 sequences for the MSA. After library generation, the following three methods were employed to design different synthetic T-domains.
Consensus method
Based on the .clustal file obtained from the MSA of the homology libraries, a consensus sequence using the UGENE software (http://ugene.unipro.ru/) with a threshold of 50% was created (i.e. if an amino acid appears in 50% or more of all sequences at a specific position it is considered as a consensus amino acid). For the creation of the synthetic T-domains, this consensus sequence was used to fill the gaps where there was no consensus amino acid with the original amino acid from the indC T-domain. By this approach, T-domains were generated which might deviate from the original sequence at positions with at least average conservation but coreespond to the original one if there is less conservation.
Guided random method
In this approach, the multiple sequence alignments (MSA) generated by the consensus method was used. Implemented in R [Referenz], a position-specific profile was generated which has the same length as the MSA and contains the rate at which amino acids occur at any given position of the sequence alignment. The synthetic T-domain is created by position-wise generation of the sequence where the probability of choosing an amino acid at a given position is determined by the rate in the profile.
Randomized generation method
For generation of synthetic sequences by the randomized generation method, every amino acid was assigned a score of 1 or 0, i.e. occuring at least ones or not at all at a given position in the MSA. In the subsequent generation of the synthetic T-domain sequence of the synthetic domain, any amino acid assigned 1 had the same likelihood of being chosen at this position.
Guided random method
In this approach, the multiple sequence alignments (MSA) generated by the consensus method was used. Implemented in R [Referenz], a position-specific profile was generated which has the same length as the MSA and contains the rate at which amino acids occur at any given position of the sequence alignment. The synthetic T-domain is created by position-wise generation of the sequence where the probability of choosing an amino acid at a given position is determined by the rate in the profile.Randomized generation method
For generation of synthetic sequences by the randomized generation method, every amino acid was assigned a score of 1 or 0, i.e. occuring at least ones or not at all at a given position in the MSA. In the subsequent generation of the synthetic T-domain sequence of the synthetic domain, any amino acid assigned 1 had the same likelihood of being chosen at this position.Seven synthetic T-domains were designed based on differnt combinations of the homology libraries and sequence generation methods.
Table 3: Overview of the homology libraries and sequence generation methods employed for the generation of seven synthetic T-domains| Domain ID | Homology library | Sequence generation method |
|---|---|---|
| synT1 | library i | consensus |
| synT2 | library ii | consensus |
| synT3 | library iii | consensus |
| synT4 | library iv | consensus |
| synT5 | library i | guided random |
| synT6 | library iv | guided random |
| synT7 | library i | randomized generation |
Figure ??shows the multiple sequence alignment of the seven synthetic T-domains and the native indC T-domain. After the generation of the T-domain amino acid sequences, the OPTIMIZER web-tool(http://genomes.urv.es/OPTIMIZER/) was used to obtain the corresponding DNA sequence. E. coli K-12 was set as strain for codon optimization and most frequent was chosen as codon option. The generated DNA sequence was cured from internal RFC10 cutting sites and CPEC cloning overhang required for the T-domain swapping into the ccdb construct were introduced. The synthetic T-domains were ordered at IDT (Integrated DNA Technologies, Coralville, Iowa). In order to obtain sufficient amounts of DNA, the synthetic T-domains were amplified via PCR. IndC-hybrid constructs of the native IndC with exchange of the native T-domain by the synthetic variants were assembled using CPEC and the indC-ccdB construct as backbone. The synthetic T-domains were amplified for CPEC using the same primers as for the native indC T-domain.
Table 4: Overview of primers that MAY be utilized for backbone linearization: The reverse primers (rv) differ in the ribosomal binding sites they introduce: BBa_J04450_B0034-RBS_ATG_rv contains the ribosomal binding site B0034, BBa_J04450_B0029-RBS_ATG_rv introduces the ribosomal binding site B0029 which is weaker than B0034. Note that the 5' overhangs (underlined) of the reverse primers (rv) already include the start codon (depicted in bold) of the coding sequence to be introduced as insert into the corresponding backbone. The resulting expression cassette will be driven by the Plac promoter (R0010).| Primer | Primer sequence(5’ --> 3’) | Cutting site |
|---|---|---|
| BBa_J04450_stem_loop_fw | TAATGA GCTAGC TAATAACGCTGATAGTGCTAGTG | NheI |
| BBa_J04450_B0034-RBS_ATG_rv | CAT GGTACC TTTCTCCTCTTT CTCTAGTATGTGTG | KpnI |
| BBa_J04450_B0029-RBS_ATG_rv | CAT GGATCC GGTTTCCTGTGTGAA CTCTAGTATGTGTGAAATTGTTATCC | NheI |
Quantitative indigoidine production assay
1. OD MEASUREMENT by TECAN plate reader
96-well plates are prepared with 100 μl LB-medium/well containing appropriate antibiotics (chloramphenicol and kanamycin for the indigoidine and PPTase contrcuts, respectively) and each well is inoculated with single colonies (in duplicates) from plates positive for the co-tansformation experiments i.e. from plates with blue colonies. Two sets of negative controls are also inoculated on the plate: First, pure medium serving as the baseline for background correction for the OD measurements. Second, transformation controls accounting for potential differences in cell growth due to expression of proteins contained on the plasmids, i.e. the antibitotic resistance gene and IndC. In this set of controls, the plasmid used in co-transformation with the PPTase plasmid contains IndC-constructs carrying a randomly generated sequence instead of the T-domain. A second 96 well plate was prepared with 180 µl LB-medium/well for the measurement itself. The 96-well plate containing the pre-cultures of the co-transformed colonies was inoculated for 24 hours at 37°C. Subsequently, 20 µl of the pre-culture was transferred to the measurement plate. The absorbance of the bacterial cultures was measured at wavelengths ranging from 400 nm to 800 nm in intervals of 10 nm for each well every 30 min for 30 hours at 30°C in a Tecan infinite M200 plate reader. For the measurement plate, Greiner 96-well flat black plates with a clear lid were used.2. Data analysis
Detecting the amount of the NRP expressed by the bacterial host strain is desirable. By tagging the NRP with indigoidine, the amount of the fusion peptide can be determined by quantifying the amount of blue pigment present in the cells. As the amount of blue pigment is proportional to the amount of the NRP of interest, a method for the quantification of the blue pigment will yield information about the expression of the NRP. Quantification of the pure indigoidine pigment can be easily achieved by optical density (OD) measurements at its maximum wavelength of about 590 nm. In cellular culture, indigoidine quantification by OD measurements is impaired. Cellular density of liquid cultures is standardly measured as the optical density (OD) at a wave length of 600 nm, i. e. the absorption peak of indigoidine interferes with the measurement of cell density at the preferred wave length (compare to Figure 3, grey dashed line). Thus, for measurement of NRP expression without time consuming a priori purification of the tagged-protein, a method to separate the cellular and pigment-derived contributions to the OD is required (compare to Figure 3, brown and blue lines, respectively). The method of choice, as described by Myers et al.[2013], requires the OD measurement of cell culture at two distinct wavelengths: the robust wave length ODR and the sensitive wave length ODS. The concentration of indigoidine will have to be deducted from measurements at ODS = 590 nm: <math> OD_{S,+P} </math> [Indigoidine]= 〖〖OD〗_(S,+P)-OD〗_(S,-P) with 〖OD〗_(S,+P) being the overall OD measurement and 〖OD〗_(S,-P) being the scattering contribution of the cellular components at the sensitive OD. The scattering contribution of the cellular compenents at ODS (ODS,-P ) can be calculated from the scattering contribution measured at the robust wave length according to the following formula: [[File: The correction factor δ is be determined by measuring the OD of pure cellular culture without indigoidine at both the wavelength 〖OD〗_(S,-P) and 〖OD〗_R and calculating their ratio. Finally, the indigoidine production can be determined as [[File:Heidelberg_5.png]] For the calculation of the cellular component when measuring indigoidine producing liquid cell cultures, OD measurement at 800 nm as robust wavelength is recommended. By the approach described above, quantitative observation of the indigoidine production in a liquid culture over time as well as the indigoidine production in relation to the cell growth can be conducted. Background correction i. e. the contribution of the culture medium to the OD measurement is achieved by subtracting the mean of pure culture medium replicates from all OD values measured.


1. Fischbach MA, Walsh CT (2006) Assembly-line enzymology for polyketide and nonribosomal Peptide antibiotics: logic, machinery, and mechanisms. Chem Rev 106: 3468–3496.
2. Takahashi H, Kumagai T, Kitani K, Mori M, Matoba Y, et al. (2007) Cloning and characterization of a Streptomyces single module type non-ribosomal peptide synthetase catalyzing a blue pigment synthesis. In:. Vol. 282. pp. 9073–9081.
3. Brachmann AO, Kirchner F, Kegler C, Kinski SC, Schmitt I, et al. (2012) Triggering the production of the cryptic blue pigment indigoidine from Photorhabdus luminescens. In:. Vol. 157. pp. 96–99.
4. Owen JG, Robins KJ, Parachin NS, Ackerley DF (2012) A functional screen for recovery of 4’-phosphopantetheinyl transferase and associated natural product biosynthesis genes from metagenome libraries. In:. Vol. 14. pp. 1198–1209.
5. Doekel S, Marahiel MA (2000) Dipeptide formation on engineered hybrid peptide synthetases. In:. Vol. 7. pp. 373–384.
6. Thirlway J, Lewis R, Nunns L, Al Nakeeb M, Styles M, et al. (2012) Introduction of a non-natural amino acid into a nonribosomal peptide antibiotic by modification of adenylation domain specificity. In:. Vol. 51. pp. 7181–7184.
7. Pfeifer BA, Admiraal SJ, Gramajo H, Cane DE, Khosla C (2001) Biosynthesis of complex polyketides in a metabolically engineered strain of E. coli. In:. Vol. 291. pp. 1790–1792.