"
"
Team:Heidelberg/Project/Tag-Optimization
From 2013.igem.org
| Line 21: | Line 21: | ||
<!--Project Description--> | <!--Project Description--> | ||
<div style="margin-top:5%"> | <div style="margin-top:5%"> | ||
| - | <h1><span style="font-size:170%;color:#0B2161;">Tag-Optimization.</span><span | + | <h1><span style="font-size:170%;color:#0B2161;">Tag-Optimization.</span><span class="text-muted" style="font-family:Arial, sans-serif; font-size:100%"> Engineering indC by Domain Exchanges.</span></h1> |
| - | + | ||
| - | class="text-muted" style="font-family:Arial, sans-serif; font-size:100%"> Engineering indC by Domain | + | |
| - | + | ||
| - | Exchanges.</span></h1> | + | |
</div> | </div> | ||
| Line 31: | Line 27: | ||
<!--graphical abstract--> | <!--graphical abstract--> | ||
<div class="col-sm-6"> | <div class="col-sm-6"> | ||
| - | <a class="fancybox fancyGraphical" rel="group" | + | <a class="fancybox fancyGraphical" rel="group" href="https://static.igem.org/mediawiki/2013/6/6b/Heidelberg_Tag-Optimization_graphical_abstract_2.png" > |
| - | + | <img style="width:100%; margin-bottom:10px; padding:1%;border-style:solid;border-width:1px;border-radius: 4px; border-color: grey;" src="https://static.igem.org/mediawiki/2013/6/6b/Heidelberg_Tag-Optimization_graphical_abstract_2.png"></img> | |
| - | href="https://static.igem.org/mediawiki/2013/6/6b/Heidelberg_Tag-Optimization_graphical_abstract_2.png" > | + | |
| - | <img style="width:100%; margin-bottom:10px; padding:1%;border-style:solid;border- | + | |
| - | + | ||
| - | width:1px;border-radius: 4px; border-color: grey;" | + | |
| - | + | ||
| - | src="https://static.igem.org/mediawiki/2013/6/6b/Heidelberg_Tag-Optimization_graphical_abstract_2.png"></img> | + | |
</a> | </a> | ||
<div class="jumbotron"> | <div class="jumbotron"> | ||
| Line 48: | Line 38: | ||
<li> Efficieny depends on interaction of PPTase and T-domains | <li> Efficieny depends on interaction of PPTase and T-domains | ||
<li> Engineered indC synthetase is more efficient that native enzyme | <li> Engineered indC synthetase is more efficient that native enzyme | ||
| - | <li> HiCT standard(<a href="https://2013.igem.org/Team:Heidelberg/RFCs#rfc99"><u>RFC 99</u></a>) enables | + | <li> HiCT standard(<a href="https://2013.igem.org/Team:Heidelberg/RFCs#rfc99"><u>RFC 99</u></a>) enables simple creation of gene libraries |
| - | + | ||
| - | simple creation of gene libraries | + | |
<li> New method for quantitative measurement of NRPS efficiency | <li> New method for quantitative measurement of NRPS efficiency | ||
| - | <li> Favorite BioBrick (natural): <a href="https://2013.igem.org/Team:Heidelberg/Favorite_Parts"><u>indC | + | <li> Favorite BioBrick (natural): <a href="https://2013.igem.org/Team:Heidelberg/Favorite_Parts"><u>indC Indigoidine Synthetase Device</u></a> |
| - | + | <li> Favorite Part Collection: <a href="https://2013.igem.org/Team:Heidelberg/Favorite_Parts"><u>indC Device (engineered)</u></a> K1152014-19 | |
| - | Indigoidine Synthetase Device</u></a> | + | |
| - | <li> Favorite Part Collection: <a href="https://2013.igem.org/Team:Heidelberg/Favorite_Parts"><u>indC | + | |
| - | + | ||
| - | Device (engineered)</u></a> K1152014-19 | + | |
</ul> | </ul> | ||
</p> | </p> | ||
| Line 67: | Line 51: | ||
<h2>Abstract</h2> | <h2>Abstract</h2> | ||
<p style="font-size:14px; text-align:justify"> | <p style="font-size:14px; text-align:justify"> | ||
| - | Non-ribosomal peptide synthetases (NRPS) offer a unique opportunity to | + | Non-ribosomal peptide synthetases (NRPS) offer a unique opportunity to spin around their inherent logical assembly and observe if their functionality is preserved or even improved. <br/> Following this idea, we investigate the <b>interchangeability of NRPS domains</b> and the possibility to <b>tune their efficiency</b> at the example of <em>indC</em> from <em>Photorhabdus luminescens</em>, the NRPS module used for the <b>Indigoidine-Tag</b>. The native NRPS domains have been replaced with domains from other bacterial organisms and <b>fully synthetic domains</b>. Moreover, we compare the activity of different <b>PPTases</b>, which are required for the activation of NRPS modules. To determine the NRPS efficiency we established a <b>quantitative indigoidine assay</b> based on OD measurement of the blue-colored pigment. Interestingly, our data points out that some of our engineered indC variants exhibit <b>increased efficiency</b> in producing indigoidine compared to the native enzyme. Furthermore, we introduce <b>HiCT</b> - High throughput protocols for circular polymerase extension Cloning and Transformation - a new standard for the assembly of <b>combinatorial gene libraries</b> (<a href="https://2013.igem.org/Team:Heidelberg/RFCs#rfc99">RFC 99</a>). |
| - | + | ||
| - | spin around their inherent logical assembly and observe if their functionality is preserved or even | + | |
| - | + | ||
| - | improved. <br/> Following this idea, we investigate the <b>interchangeability of NRPS domains</b> and | + | |
| - | + | ||
| - | the possibility to <b>tune their efficiency</b> at the example of <em>indC</em> from <em>Photorhabdus | + | |
| - | + | ||
| - | luminescens</em>, the NRPS module used for the <b>Indigoidine-Tag</b>. The native NRPS domains have | + | |
| - | + | ||
| - | been replaced with domains from other bacterial organisms and <b>fully synthetic domains</b>. Moreover, | + | |
| - | + | ||
| - | we compare the activity of different <b>PPTases</b>, which are required for the activation of NRPS | + | |
| - | + | ||
| - | modules. To determine the NRPS efficiency we established a <b>quantitative indigoidine assay</b> based | + | |
| - | + | ||
| - | on OD measurement of the blue-colored pigment. Interestingly, our data points out that some of our | + | |
| - | + | ||
| - | engineered indC variants exhibit <b>increased efficiency</b> in producing indigoidine compared to the | + | |
| - | + | ||
| - | native enzyme. Furthermore, we introduce <b>HiCT</b> - High throughput protocols for circular | + | |
| - | + | ||
| - | polymerase extension Cloning and Transformation - a new standard for the assembly of <b>combinatorial | + | |
| - | + | ||
| - | gene libraries</b> (<a href="https://2013.igem.org/Team:Heidelberg/RFCs#rfc99">RFC 99</a>). | + | |
</p> | </p> | ||
</div> | </div> | ||
| Line 119: | Line 79: | ||
</div> | </div> | ||
<div class="item"> | <div class="item"> | ||
| - | <img | + | <img src="https://static.igem.org/mediawiki/2013/b/b4/Heidelberg_ind_slider_5.png"> |
| - | + | ||
| - | src="https://static.igem.org/mediawiki/2013/b/b4/Heidelberg_ind_slider_5.png"> | + | |
<div class="container"> | <div class="container"> | ||
<div class="carousel-caption" data-offset="0"> | <div class="carousel-caption" data-offset="0"> | ||
| Line 129: | Line 87: | ||
</div> | </div> | ||
<div class="item"> | <div class="item"> | ||
| - | <img | + | <img src="https://static.igem.org/mediawiki/2013/e/ef/Heidelberg_ind_slider_6.png"> |
| - | + | ||
| - | src="https://static.igem.org/mediawiki/2013/e/ef/Heidelberg_ind_slider_6.png"> | + | |
<div class="container"> | <div class="container"> | ||
<div class="carousel-caption" data-offset="0"> | <div class="carousel-caption" data-offset="0"> | ||
| Line 139: | Line 95: | ||
</div> | </div> | ||
<div class="item"> | <div class="item"> | ||
| - | <img | + | <img src="https://static.igem.org/mediawiki/2013/f/fa/Heidelberg_ind_slider_4.png"> |
| - | + | ||
| - | src="https://static.igem.org/mediawiki/2013/f/fa/Heidelberg_ind_slider_4.png"> | + | |
<div class="container"> | <div class="container"> | ||
<div class="carousel-caption" data-offset="0"> | <div class="carousel-caption" data-offset="0"> | ||
| Line 149: | Line 103: | ||
</div> | </div> | ||
<div class="item"> | <div class="item"> | ||
| - | <img | + | <img src="https://static.igem.org/mediawiki/2013/7/75/Slider_plattentabelle.png"> |
| - | + | ||
| - | src="https://static.igem.org/mediawiki/2013/7/75/Slider_plattentabelle.png"> | + | |
<div class="container"> | <div class="container"> | ||
<div class="carousel-caption" data-offset="0"> | <div class="carousel-caption" data-offset="0"> | ||
| Line 159: | Line 111: | ||
</div> | </div> | ||
<div class="item"> | <div class="item"> | ||
| - | <img | + | <img src="https://static.igem.org/mediawiki/2013/1/16/Heidelberg_ind_slider_7.png"> |
| - | + | ||
| - | src="https://static.igem.org/mediawiki/2013/1/16/Heidelberg_ind_slider_7.png"> | + | |
<div class="container"> | <div class="container"> | ||
<div class="carousel-caption" data-offset="0"> | <div class="carousel-caption" data-offset="0"> | ||
| Line 169: | Line 119: | ||
</div> | </div> | ||
<div class="item"> | <div class="item"> | ||
| - | <img | + | <img src="https://static.igem.org/mediawiki/2013/6/61/Heidelberg_ind_slider_8.png"> |
| - | + | ||
| - | src="https://static.igem.org/mediawiki/2013/6/61/Heidelberg_ind_slider_8.png"> | + | |
<div class="container"> | <div class="container"> | ||
<div class="carousel-caption" data-offset="0"> | <div class="carousel-caption" data-offset="0"> | ||
| Line 187: | Line 135: | ||
</div> | </div> | ||
</div> | </div> | ||
| - | <a class="left carousel-control" href="#myCarousel" data-slide="prev"><span | + | <a class="left carousel-control" href="#myCarousel" data-slide="prev"><span class="glyphicon glyphicon-chevron-left"></span></a> |
| - | + | <a class="right carousel-control" href="#myCarousel" data-slide="next"><span class="glyphicon glyphicon-chevron-right"></span></a> | |
| - | class="glyphicon glyphicon-chevron-left"></span></a> | + | |
| - | <a class="right carousel-control" href="#myCarousel" data-slide="next"><span | + | |
| - | + | ||
| - | class="glyphicon glyphicon-chevron-right"></span></a> | + | |
</div> | </div> | ||
</div> | </div> | ||
| Line 202: | Line 146: | ||
<h2 id="introduction">Introduction</h2> | <h2 id="introduction">Introduction</h2> | ||
<p> | <p> | ||
| - | In Non-Ribosomal Peptide Synthesis, peptides are produced by multienzyme complexes, the NRPS, which | + | In Non-Ribosomal Peptide Synthesis, peptides are produced by multienzyme complexes, the NRPS, which form an assembly line, in which every NRPS module is responsible for the incorporation of one single amino acid into the growing peptide chain (for more detailled information on the NRPS system, please visit our <a href="https://2013.igem.org/Team:Heidelberg/NRPS">Background Page</a> to see our NRPS introduction video)[1]. As previously shown, the natural NRPS assembly lines can be rearranged to create novel assembly lines producing custom peptides (please find our experiments on the <a href="https://2013.igem.org/Team:Heidelberg/Project/Tyrocidine">Peptide Synthesis Page</a>)[2]. Since the detection of those custom peptides remained challenging when produced <i>in vivo</i>, we developped a method which enables the labelling of non-ribosomal peptides (NRPs) with the blue pigment indigoidine (please find our experiments on the <a href="https://2013.igem.org/Team:Heidelberg/Project/Indigoidine-Tag">Indigoidine-Tag Page</a>). The Indigoidine-Tag enables for applying high-throughput methods in the creation of NRPS libraries as well as in detection, purification and validation of synthetic NRPs (please find our <a href="https://2013.igem.org/Team:Heidelberg/RFCs">RFC Page</a> for standardized high-throughput protocols). Custom short peptides might have a great potential for production in industrial scale. Therefore, we try to optimize the efficiency of the indigoidine synthetase indC, which is used for the Indigoidine-Tag. |
| - | + | ||
| - | form an assembly line, in which every NRPS module is responsible for the incorporation of one single | + | |
| - | + | ||
| - | amino acid into the growing peptide chain (for more detailled information on the NRPS system, please | + | |
| - | + | ||
| - | visit our <a href="https://2013.igem.org/Team:Heidelberg/NRPS">Background Page</a> to see our NRPS | + | |
| - | + | ||
| - | introduction video)[1]. As previously shown, the natural NRPS assembly lines can be rearranged to | + | |
| - | + | ||
| - | create novel assembly lines producing custom peptides (please find our experiments on the <a | + | |
| - | + | ||
| - | href="https://2013.igem.org/Team:Heidelberg/Project/Tyrocidine">Peptide Synthesis Page</a>)[2]. Since | + | |
| - | + | ||
| - | the detection of those custom peptides remained challenging when produced <i>in vivo</i>, we developped | + | |
| - | + | ||
| - | a method which enables the labelling of non-ribosomal peptides (NRPs) with the blue pigment indigoidine | + | |
| - | + | ||
| - | (please find our experiments on the <a href="https://2013.igem.org/Team:Heidelberg/Project/Indigoidine- | + | |
| - | + | ||
| - | Tag">Indigoidine-Tag Page</a>). The Indigoidine-Tag enables for applying high-throughput methods in the | + | |
| - | + | ||
| - | creation of NRPS libraries as well as in detection, purification and validation of synthetic NRPs | + | |
| - | + | ||
| - | (please find our <a href="https://2013.igem.org/Team:Heidelberg/RFCs">RFC Page</a> for standardized | + | |
| - | + | ||
| - | high-throughput protocols). Custom short peptides might have a great potential for production in | + | |
| - | + | ||
| - | industrial scale. Therefore, we try to optimize the efficiency of the indigoidine synthetase indC, | + | |
| - | + | ||
| - | which is used for the Indigoidine-Tag. | + | |
<br/><br/> | <br/><br/> | ||
| - | The indigoidine synthetase indC from <i>Photorhabdus luminescens laumondii</i> TT01 (DSM15139) consists | + | The indigoidine synthetase indC from <i>Photorhabdus luminescens laumondii</i> TT01 (DSM15139) consists of an adenylation domain with an internal oxidation domain, a thiolation domain and a thioesterase domain [3]. The A-domain adenylates L-glutamine, which is then attached to the T-domain via a thioester bond. The TE-domain catalyzes the cyclization of the glutamine and cleaves it from the T-domain. Each two cyclic glutamines are oxidized by the Ox-domain, resulting in the blue pigment indigoidine (<a class="fancybox fancyGraphical" href="https://static.igem.org/mediawiki/2013/8/82/Heidelberg_tagopt_fig1.png" caption="<b>Figure 1: The Indigoidine Synthetase IndC Catalyzes the Formation of the Blue Pigment Indigoidine</b> |
| - | + | <b>a)</b> The indigoidine synthetase indC from <i>Photorhabdus luminescens laumondii</i> TT01 consists of an adenylation domain with an internal oxidation domain, a thiolation domain and a thioesterase domain. The A-domain adenylates L-glutamine, which is then attached to the T-domain via a thioester bond. The TE-domain catalyzes the cyclization of the glutamine and cleaves it from the T-domain. Each two cyclic glutamines are oxidized by the Ox-domain, resulting in the blue pigment indigoidine. <i>E. coli</i> cells expressing the indigoidine synthetase appear blue when grown on agar plates. | |
| - | of an adenylation domain with an internal oxidation domain, a thiolation domain and a thioesterase | + | <b>b)</b> The indigoidine synthetase must be activated by an enzyme called 4'-Phosphopantheteinyl-transferase (PPTase), which transfers the 4'-PPT residue from Coenzyme A to a conserved serine residue in the T-domain of the indigoidine synthetase, thus transforming it from its inactive apo- to the active holo-form.">Fig. 1a</a>). The indigoidine synthetase must be activated by an enzyme called 4'Phosphopantheteinyl-transferase (PPTase), which transfers the 4'-PPT residue from Coenzyme A to a conserved serine residue in the T-domain of the indigoidine synthetase, thus transforming it from its inactive apo- to the active holo-form (<a class="fancybox fancyGraphical" href="https://static.igem.org/mediawiki/2013/8/82/Heidelberg_tagopt_fig1.png" caption="<b>Figure 1: The Indigoidine Synthetase IndC Catalyzes the Formation of the Blue Pigment Indigoidine</b> |
| - | + | <b>a)</b> The indigoidine synthetase indC from <i>Photorhabdus luminescens laumondii</i> TT01 consists of an adenylation domain with an internal oxidation domain, a thiolation domain and a thioesterase domain. The A-domain adenylates L-glutamine, which is then attached to the T-domain via a thioester bond. The TE-domain catalyzes the cyclization of the glutamine and cleaves it from the T-domain. Each two cyclic glutamines are oxidized by the Ox-domain, resulting in the blue pigment indigoidine. <i>E. coli</i> cells expressing the indigoidine synthetase appear blue when grown on agar plates. | |
| - | domain [3]. The A-domain adenylates L-glutamine, which is then attached to the T-domain via a thioester | + | <b>b)</b> The indigoidine synthetase must be activated by an enzyme called 4'Phosphopantheteinyl-transferase (PPTase), which transfers the 4'-PPT residue from Coenzyme A to a conserved serine residue in the T-domain of the indigoidine synthetase, thus transforming it from its inactive apo- to the active holo-form.">Fig. 1b</a>)[3]. |
| - | + | ||
| - | bond. The TE-domain catalyzes the cyclization of the glutamine and cleaves it from the T-domain. Each | + | |
| - | + | ||
| - | two cyclic glutamines are oxidized by the Ox-domain, resulting in the blue pigment indigoidine (<a | + | |
| - | + | ||
| - | class="fancybox fancyGraphical" href="https://static.igem.org/mediawiki/2013/8/82/Heidelberg_tagopt_fig1.png" | + | |
| - | + | ||
| - | caption="<b>Figure 1: The Indigoidine Synthetase IndC Catalyzes the Formation of the Blue Pigment | + | |
| - | + | ||
| - | Indigoidine</b> | + | |
| - | <b>a)</b> The indigoidine synthetase indC from <i>Photorhabdus luminescens laumondii</i> TT01 consists | + | |
| - | + | ||
| - | of an adenylation domain with an internal oxidation domain, a thiolation domain and a thioesterase | + | |
| - | + | ||
| - | domain. The A-domain adenylates L-glutamine, which is then attached to the T-domain via a thioester | + | |
| - | + | ||
| - | bond. The TE-domain catalyzes the cyclization of the glutamine and cleaves it from the T-domain. Each | + | |
| - | + | ||
| - | two cyclic glutamines are oxidized by the Ox-domain, resulting in the blue pigment indigoidine. <i>E. | + | |
| - | + | ||
| - | coli</i> cells expressing the indigoidine synthetase appear blue when grown on agar plates. | + | |
| - | <b>b)</b> The indigoidine synthetase must be activated by an enzyme called 4'-Phosphopantheteinyl- | + | |
| - | + | ||
| - | transferase (PPTase), which transfers the 4'-PPT residue from Coenzyme A to a conserved serine residue | + | |
| - | + | ||
| - | in the T-domain of the indigoidine synthetase, thus transforming it from its inactive apo- to the | + | |
| - | + | ||
| - | active holo-form.">Fig. 1a</a>). The indigoidine synthetase must be activated by an enzyme called | + | |
| - | + | ||
| - | 4'Phosphopantheteinyl-transferase (PPTase), which transfers the 4'-PPT residue from Coenzyme A to a | + | |
| - | + | ||
| - | conserved serine residue in the T-domain of the indigoidine synthetase, thus transforming it from its | + | |
| - | + | ||
| - | inactive apo- to the active holo-form (<a class="fancybox fancyGraphical" | + | |
| - | + | ||
| - | href="https://static.igem.org/mediawiki/2013/8/82/Heidelberg_tagopt_fig1.png" caption="<b>Figure 1: The | + | |
| - | + | ||
| - | Indigoidine Synthetase IndC Catalyzes the Formation of the Blue Pigment Indigoidine</b> | + | |
| - | <b>a)</b> The indigoidine synthetase indC from <i>Photorhabdus luminescens laumondii</i> TT01 consists | + | |
| - | + | ||
| - | of an adenylation domain with an internal oxidation domain, a thiolation domain and a thioesterase | + | |
| - | + | ||
| - | domain. The A-domain adenylates L-glutamine, which is then attached to the T-domain via a thioester | + | |
| - | + | ||
| - | bond. The TE-domain catalyzes the cyclization of the glutamine and cleaves it from the T-domain. Each | + | |
| - | + | ||
| - | two cyclic glutamines are oxidized by the Ox-domain, resulting in the blue pigment indigoidine. <i>E. | + | |
| - | + | ||
| - | coli</i> cells expressing the indigoidine synthetase appear blue when grown on agar plates. | + | |
| - | <b>b)</b> The indigoidine synthetase must be activated by an enzyme called 4'Phosphopantheteinyl- | + | |
| - | + | ||
| - | transferase (PPTase), which transfers the 4'-PPT residue from Coenzyme A to a conserved serine residue | + | |
| - | + | ||
| - | in the T-domain of the indigoidine synthetase, thus transforming it from its inactive apo- to the | + | |
| - | + | ||
| - | active holo-form.">Fig. 1b</a>)[3]. | + | |
</p> | </p> | ||
<br/> | <br/> | ||
<center> | <center> | ||
| - | <a class="fancybox fancyGraphical" | + | <a class="fancybox fancyGraphical" href="https://static.igem.org/mediawiki/2013/8/82/Heidelberg_tagopt_fig1.png" caption="<b>Figure 1: The Indigoidine Synthetase IndC Catalyzes the Formation of the Blue Pigment Indigoidine</b> |
| - | + | <b>a)</b> The indigoidine synthetase indC from <i>Photorhabdus luminescens laumondii</i> TT01 consists of an adenylation domain with an internal oxidation domain, a thiolation domain and a thioesterase domain. The A-domain adenylates L-glutamine, which is then attached to the T-domain via a thioester bond. The TE-domain catalyzes the cyclization of the glutamine and cleaves it from the T-domain. Each two cyclic glutamines are oxidized by the Ox-domain, resulting in the blue pigment indigoidine. <i>E. coli</i> cells expressing the indigoidine synthetase appear blue when grown on agar plates. | |
| - | href="https://static.igem.org/mediawiki/2013/8/82/Heidelberg_tagopt_fig1.png" caption="<b>Figure 1: The | + | <b>b)</b> The indigoidine synthetase must be activated by an enzyme called 4'Phosphopantheteinyl-transferase (PPTase), which transfers the 4'-PPT residue from Coenzyme A to a conserved serine residue in the T-domain of the indigoidine synthetase, thus transforming it from its inactive apo- to the active holo-form."> |
| - | + | <img style="width:60%; margin-bottom:10px; padding:1%;border-style:solid;border-width:1px;border-radius: 5px;" src="https://static.igem.org/mediawiki/2013/8/82/Heidelberg_tagopt_fig1.png"></img> | |
| - | Indigoidine Synthetase IndC Catalyzes the Formation of the Blue Pigment Indigoidine</b> | + | <figcaption style="width:80%;"><b>Figure 1: The Indigoidine Synthetase IndC Catalyzes the Formation of the Blue Pigment Indigoidine</b> |
| - | <b>a)</b> The indigoidine synthetase indC from <i>Photorhabdus luminescens laumondii</i> TT01 consists | + | <b>a)</b> The indigoidine synthetase indC from <i>Photorhabdus luminescens laumondii</i> TT01 consists of an adenylation domain with an internal oxidation domain, a thiolation domain and a thioesterase domain. The A-domain adenylates L-glutamine, which is then attached to the T-domain via a thioester bond. The TE-domain catalyzes the cyclization of the glutamine and cleaves it from the T-domain. Each two cyclic glutamines are oxidized by the Ox-domain, resulting in the blue pigment indigoidine. <i>E. coli</i> cells expressing the indigoidine synthetase appear blue when grown on agar plates. |
| - | + | <b>b)</b> The indigoidine synthetase must be activated by an enzyme called 4'Phosphopantheteinyl-transferase (PPTase), which transfers the 4'-PPT residue from Coenzyme A to a conserved serine residue in the T-domain of the indigoidine synthetase, thus transforming it from its inactive apo- to the active holo-form. | |
| - | of an adenylation domain with an internal oxidation domain, a thiolation domain and a thioesterase | + | |
| - | + | ||
| - | domain. The A-domain adenylates L-glutamine, which is then attached to the T-domain via a thioester | + | |
| - | + | ||
| - | bond. The TE-domain catalyzes the cyclization of the glutamine and cleaves it from the T-domain. Each | + | |
| - | + | ||
| - | two cyclic glutamines are oxidized by the Ox-domain, resulting in the blue pigment indigoidine. <i>E. | + | |
| - | + | ||
| - | coli</i> cells expressing the indigoidine synthetase appear blue when grown on agar plates. | + | |
| - | <b>b)</b> The indigoidine synthetase must be activated by an enzyme called 4'Phosphopantheteinyl- | + | |
| - | + | ||
| - | transferase (PPTase), which transfers the 4'-PPT residue from Coenzyme A to a conserved serine residue | + | |
| - | + | ||
| - | in the T-domain of the indigoidine synthetase, thus transforming it from its inactive apo- to the | + | |
| - | + | ||
| - | active holo-form."> | + | |
| - | <img style="width:60%; margin-bottom:10px; padding:1%;border-style:solid;border-width:1px;border- | + | |
| - | + | ||
| - | radius: 5px;" src="https://static.igem.org/mediawiki/2013/8/82/Heidelberg_tagopt_fig1.png"></img> | + | |
| - | <figcaption style="width:80%;"><b>Figure 1: The Indigoidine Synthetase IndC Catalyzes the | + | |
| - | + | ||
| - | Formation of the Blue Pigment Indigoidine</b> | + | |
| - | <b>a)</b> The indigoidine synthetase indC from <i>Photorhabdus luminescens laumondii</i> TT01 consists | + | |
| - | + | ||
| - | of an adenylation domain with an internal oxidation domain, a thiolation domain and a thioesterase | + | |
| - | + | ||
| - | domain. The A-domain adenylates L-glutamine, which is then attached to the T-domain via a thioester | + | |
| - | + | ||
| - | bond. The TE-domain catalyzes the cyclization of the glutamine and cleaves it from the T-domain. Each | + | |
| - | + | ||
| - | two cyclic glutamines are oxidized by the Ox-domain, resulting in the blue pigment indigoidine. <i>E. | + | |
| - | + | ||
| - | coli</i> cells expressing the indigoidine synthetase appear blue when grown on agar plates. | + | |
| - | <b>b)</b> The indigoidine synthetase must be activated by an enzyme called 4'Phosphopantheteinyl- | + | |
| - | + | ||
| - | transferase (PPTase), which transfers the 4'-PPT residue from Coenzyme A to a conserved serine residue | + | |
| - | + | ||
| - | in the T-domain of the indigoidine synthetase, thus transforming it from its inactive apo- to the | + | |
| - | + | ||
| - | active holo-form. | + | |
</figcaption> | </figcaption> | ||
</a> | </a> | ||
| Line 353: | Line 171: | ||
<br/> | <br/> | ||
<p> | <p> | ||
| - | We expressed the indigoidine synthetase indC together with the PPTase in different substrains of <i>E. | + | We expressed the indigoidine synthetase indC together with the PPTase in different substrains of <i>E. coli</i> to observe their growth behaviour and to get an impression, which substrain is most suitable for our experiments. We used the <i>E. coli</i> substrains MG1655 [4], TOP10 (Invitrogen), NEB Turbo (NEB), BAP1 [5] and Rosetta (Novagen). |
| - | + | In order to optimize the yield of indigoidine produced by indC, we investigated the influence of the T-domain on the enzyme efficiency. Previous studies showed, that exchanging the T-domain of the blue pigment synthetase bpsA from <i>S. lavendulae</i> [6] yields an unfunctional indigoidine synthetase [7].We replaced the T-domain of the wild-type indC with T-domains from several other NRPS modules from different host organisms (<i>S. lavendulae</i>, <i>E. coli</i>, <i>B. parabrevis</i>, <i>D. acidovorans</i>, <i>P. luminescens</i>) observing the change in enzyme efficiency (<a class="fancybox fancyGraphical" href="https://static.igem.org/mediawiki/2013/4/46/Heidelberg_tagopt_fig2.png" caption="<b>Figure 2: Optimization of the Indigoidine Production by Domain Exchange and Activation by Different PPTases.</b> | |
| - | coli</i> to observe their growth behaviour and to get an impression, which substrain is most suitable | + | <b>a)</b> In a first approach, the T-domain of the indigoidine synthetase indC is replaced by T-domains from other NRPS modules and fully synthetic T-domains. In NRPS, the growing peptide chain is covalently attached to the T-domain via a thioester bond. In order to optimize the indigoidine synthetase for the use to label non-ribosomal peptides with the indigoidine-tag, we investigated the influence of the interaction between T-domain and PPTase measuring the amount of indigoidine produced by each combination. |
| - | + | <b>b)</b> The indigoidine synthetase must be activated by PPTase, which transfers the 4'-PPT residue from Coenzyme A to a conserved serine residue in the T-domain of the indigoidine synthetase. Since the PPTases differ in their substrate specificity, we tried different PPTases to see, which one is most efficient in activating the respective engineered indigoidine synthetase from a).">Fig. 2a</a>) [2][3][6][8]. Moreover, we created seven fully synthetic T-domains based on multiple sequence alignments of 250 NRPS modules and measured the indigoidine yield after insertion into the indigoidine synthetase scaffold. Since the the NRPS T-domains must be activated by a member of the 4'-Phosphopantheteinyl-transferases (PPTases) [9], which differ in their substrate specificity [10], we coexpressed every engineered indigoidine synthetase with PPTases from different host organisms (Sfp from <i>B. subtilis</i> [11], Svp from <i>S. verticillus</i> [12], EntD from <i>E. coli</i> [7], DelC from <i>D. acidovorans</i> [8], NgrA from <i>P. luminescens</i> [14]) (<a class="fancybox fancyGraphical" href="https://static.igem.org/mediawiki/2013/4/46/Heidelberg_tagopt_fig2.png" caption="<b>Figure 2: Optimization of the Indigoidine Production by Domain Exchange and Activation by Different PPTases.</b> | |
| - | for our experiments. We used the <i>E. coli</i> substrains MG1655 [4], TOP10 (Invitrogen), NEB Turbo | + | <b>a)</b> In a first approach, the T-domain of the indigoidine synthetase indC is replaced by T-domains from other NRPS modules and fully synthetic T-domains. In NRPS, the growing peptide chain is covalently attached to the T-domain via a thioester bond. In order to optimize the indigoidine synthetase for the use to label non-ribosomal peptides with the indigoidine-tag, we investigated the influence of the interaction between T-domain and PPTase measuring the amount of indigoidine produced by each combination. |
| - | + | <b>b)</b> The indigoidine synthetase must be activated by PPTase, which transfers the 4'-PPT residue from Coenzyme A to a conserved serine residue in the T-domain of the indigoidine synthetase. Since the PPTases differ in their substrate specificity, we tried different PPTases to see, which one is most efficient in activating the respective engineered indigoidine synthetase from a).">Fig. 2b</a>) and determined the indigoidine production rate of every engineered indigoidine synthetase in combination with a respective PPTase. | |
| - | (NEB), BAP1 [5] and Rosetta (Novagen). | + | |
| - | In order to optimize the yield of indigoidine produced by indC, we investigated the influence of the | + | |
| - | + | ||
| - | T-domain on the enzyme efficiency. Previous studies showed, that exchanging the T-domain of the blue | + | |
| - | + | ||
| - | pigment synthetase bpsA from <i>S. lavendulae</i> [6] yields an unfunctional indigoidine synthetase | + | |
| - | + | ||
| - | [7].We replaced the T-domain of the wild-type indC with T-domains from several other NRPS modules from | + | |
| - | + | ||
| - | different host organisms (<i>S. lavendulae</i>, <i>E. coli</i>, <i>B. parabrevis</i>, <i>D. | + | |
| - | + | ||
| - | acidovorans</i>, <i>P. luminescens</i>) observing the change in enzyme efficiency (<a class="fancybox | + | |
| - | + | ||
| - | fancyGraphical" href="https://static.igem.org/mediawiki/2013/4/46/Heidelberg_tagopt_fig2.png" | + | |
| - | + | ||
| - | caption="<b>Figure 2: Optimization of the Indigoidine Production by Domain Exchange and Activation by | + | |
| - | + | ||
| - | Different PPTases.</b> | + | |
| - | <b>a)</b> In a first approach, the T-domain of the indigoidine synthetase indC is replaced by T-domains | + | |
| - | + | ||
| - | from other NRPS modules and fully synthetic T-domains. In NRPS, the growing peptide chain is covalently | + | |
| - | + | ||
| - | attached to the T-domain via a thioester bond. In order to optimize the indigoidine synthetase for the | + | |
| - | + | ||
| - | use to label non-ribosomal peptides with the indigoidine-tag, we investigated the influence of the | + | |
| - | + | ||
| - | interaction between T-domain and PPTase measuring the amount of indigoidine produced by each | + | |
| - | + | ||
| - | combination. | + | |
| - | <b>b)</b> The indigoidine synthetase must be activated by PPTase, which transfers the 4'-PPT residue | + | |
| - | + | ||
| - | from Coenzyme A to a conserved serine residue in the T-domain of the indigoidine synthetase. Since the | + | |
| - | + | ||
| - | PPTases differ in their substrate specificity, we tried different PPTases to see, which one is most | + | |
| - | + | ||
| - | efficient in activating the respective engineered indigoidine synthetase from a).">Fig. 2a</a>) [2][3] | + | |
| - | + | ||
| - | [6][8]. Moreover, we created seven fully synthetic T-domains based on multiple sequence alignments of | + | |
| - | + | ||
| - | 250 NRPS modules and measured the indigoidine yield after insertion into the indigoidine synthetase | + | |
| - | + | ||
| - | scaffold. Since the the NRPS T-domains must be activated by a member of the 4'-Phosphopantheteinyl- | + | |
| - | + | ||
| - | transferases (PPTases) [9], which differ in their substrate specificity [10], we coexpressed every | + | |
| - | + | ||
| - | engineered indigoidine synthetase with PPTases from different host organisms (Sfp from <i>B. | + | |
| - | + | ||
| - | subtilis</i> [11], Svp from <i>S. verticillus</i> [12], EntD from <i>E. coli</i> [7], DelC from <i>D. | + | |
| - | + | ||
| - | acidovorans</i> [8], NgrA from <i>P. luminescens</i> [14]) (<a class="fancybox fancyGraphical" | + | |
| - | + | ||
| - | href="https://static.igem.org/mediawiki/2013/4/46/Heidelberg_tagopt_fig2.png" caption="<b>Figure 2: | + | |
| - | + | ||
| - | Optimization of the Indigoidine Production by Domain Exchange and Activation by Different PPTases.</b> | + | |
| - | <b>a)</b> In a first approach, the T-domain of the indigoidine synthetase indC is replaced by T-domains | + | |
| - | + | ||
| - | from other NRPS modules and fully synthetic T-domains. In NRPS, the growing peptide chain is covalently | + | |
| - | + | ||
| - | attached to the T-domain via a thioester bond. In order to optimize the indigoidine synthetase for the | + | |
| - | + | ||
| - | use to label non-ribosomal peptides with the indigoidine-tag, we investigated the influence of the | + | |
| - | + | ||
| - | interaction between T-domain and PPTase measuring the amount of indigoidine produced by each | + | |
| - | + | ||
| - | combination. | + | |
| - | <b>b)</b> The indigoidine synthetase must be activated by PPTase, which transfers the 4'-PPT residue | + | |
| - | + | ||
| - | from Coenzyme A to a conserved serine residue in the T-domain of the indigoidine synthetase. Since the | + | |
| - | + | ||
| - | PPTases differ in their substrate specificity, we tried different PPTases to see, which one is most | + | |
| - | + | ||
| - | efficient in activating the respective engineered indigoidine synthetase from a).">Fig. 2b</a>) and | + | |
| - | + | ||
| - | determined the indigoidine production rate of every engineered indigoidine synthetase in combination | + | |
| - | + | ||
| - | with a respective PPTase. | + | |
</p> | </p> | ||
| Line 440: | Line 182: | ||
<center> | <center> | ||
| - | <a class="fancybox fancyGraphical" | + | <a class="fancybox fancyGraphical" href="https://static.igem.org/mediawiki/2013/4/46/Heidelberg_tagopt_fig2.png" caption="<b>Figure 2: Optimization of the Indigoidine Production by Domain Exchange and Activation by Different PPTases.</b> |
| - | + | <b>a)</b> In a first approach, the T-domain of the indigoidine synthetase indC is replaced by T-domains from other NRPS modules and fully synthetic T-domains. In NRPS, the growing peptide chain is covalently attached to the T-domain via a thioester bond. In order to optimize the indigoidine synthetase for the use to label non-ribosomal peptides with the indigoidine-tag, we investigated the influence of the interaction between T-domain and PPTase measuring the amount of indigoidine produced by each combination. | |
| - | href="https://static.igem.org/mediawiki/2013/4/46/Heidelberg_tagopt_fig2.png" caption="<b>Figure 2: | + | <b>b)</b> The indigoidine synthetase must be activated by PPTase, which transfers the 4'-PPT residue from Coenzyme A to a conserved serine residue in the T-domain of the indigoidine synthetase. Since the PPTases differ in their substrate specificity, we tried different PPTases to see, which one is most efficient in activating the respective engineered indigoidine synthetase from a)."> |
| - | + | <img style="width:60%; margin-bottom:10px; padding:1%;border-style:solid;border-width:1px;border-radius: 5px;" src="https://static.igem.org/mediawiki/2013/4/46/Heidelberg_tagopt_fig2.png"></img> | |
| - | Optimization of the Indigoidine Production by Domain Exchange and Activation by Different PPTases.</b> | + | <figcaption style="width:80%;"><b>Figure 2: Optimization of the Indigoidine Production by Domain Exchange and Activation by Different PPTases.</b> |
| - | <b>a)</b> In a first approach, the T-domain of the indigoidine synthetase indC is replaced by T-domains | + | <b>a)</b> In a first approach, the T-domain of the indigoidine synthetase indC is replaced by T-domains from other NRPS modules and fully synthetic T-domains. In NRPS, the growing peptide chain is covalently attached to the T-domain via a thioester bond. In order to optimize the indigoidine synthetase for the use to label non-ribosomal peptides with the indigoidine-tag, we investigated the influence of the interaction between T-domain and PPTase measuring the amount of indigoidine produced by each combination. |
| - | + | <b>b)</b> The indigoidine synthetase must be activated by PPTase, which transfers the 4'-PPT residue from Coenzyme A to a conserved serine residue in the T-domain of the indigoidine synthetase. Since the PPTases differ in their substrate specificity, we tried different PPTases to see, which one is most efficient in activating the respective engineered indigoidine synthetase from a). | |
| - | from other NRPS modules and fully synthetic T-domains. In NRPS, the growing peptide chain is covalently | + | |
| - | + | ||
| - | attached to the T-domain via a thioester bond. In order to optimize the indigoidine synthetase for the | + | |
| - | + | ||
| - | use to label non-ribosomal peptides with the indigoidine-tag, we investigated the influence of the | + | |
| - | + | ||
| - | interaction between T-domain and PPTase measuring the amount of indigoidine produced by each | + | |
| - | + | ||
| - | combination. | + | |
| - | <b>b)</b> The indigoidine synthetase must be activated by PPTase, which transfers the 4'-PPT residue | + | |
| - | + | ||
| - | from Coenzyme A to a conserved serine residue in the T-domain of the indigoidine synthetase. Since the | + | |
| - | + | ||
| - | PPTases differ in their substrate specificity, we tried different PPTases to see, which one is most | + | |
| - | + | ||
| - | efficient in activating the respective engineered indigoidine synthetase from a)."> | + | |
| - | <img style="width:60%; margin-bottom:10px; padding:1%;border-style:solid;border-width:1px;border- | + | |
| - | + | ||
| - | radius: 5px;" src="https://static.igem.org/mediawiki/2013/4/46/Heidelberg_tagopt_fig2.png"></img> | + | |
| - | <figcaption style="width:80%;"><b>Figure 2: Optimization of the Indigoidine Production by Domain | + | |
| - | + | ||
| - | Exchange and Activation by Different PPTases.</b> | + | |
| - | <b>a)</b> In a first approach, the T-domain of the indigoidine synthetase indC is replaced by T-domains | + | |
| - | + | ||
| - | from other NRPS modules and fully synthetic T-domains. In NRPS, the growing peptide chain is covalently | + | |
| - | + | ||
| - | attached to the T-domain via a thioester bond. In order to optimize the indigoidine synthetase for the | + | |
| - | + | ||
| - | use to label non-ribosomal peptides with the indigoidine-tag, we investigated the influence of the | + | |
| - | + | ||
| - | interaction between T-domain and PPTase measuring the amount of indigoidine produced by each | + | |
| - | + | ||
| - | combination. | + | |
| - | <b>b)</b> The indigoidine synthetase must be activated by PPTase, which transfers the 4'-PPT residue | + | |
| - | + | ||
| - | from Coenzyme A to a conserved serine residue in the T-domain of the indigoidine synthetase. Since the | + | |
| - | + | ||
| - | PPTases differ in their substrate specificity, we tried different PPTases to see, which one is most | + | |
| - | + | ||
| - | efficient in activating the respective engineered indigoidine synthetase from a). | + | |
</figcaption> | </figcaption> | ||
</a> | </a> | ||
| Line 493: | Line 195: | ||
<p> | <p> | ||
| - | With this approach, we learn more about the interaction of T-domains and PPTases and their influence on | + | With this approach, we learn more about the interaction of T-domains and PPTases and their influence on the NRPS efficiency. Since this combinatorial approach requires the cloning of large plasmid libraries and hundreds of cotransformations, we established HiCT: High-throughput protocols for circular polymerase extension Cloning and Transformation (please find more information on HiCT on our <a href="https://2013.igem.org/Team:Heidelberg/RFCs#rfc99">RFC99 Page</a>) based on CPEC assembly [11]. |
| - | + | ||
| - | the NRPS efficiency. Since this combinatorial approach requires the cloning of large plasmid libraries | + | |
| - | + | ||
| - | and hundreds of cotransformations, we established HiCT: High-throughput protocols for circular | + | |
| - | + | ||
| - | polymerase extension Cloning and Transformation (please find more information on HiCT on our <a | + | |
| - | + | ||
| - | href="https://2013.igem.org/Team:Heidelberg/RFCs#rfc99">RFC99 Page</a>) based on CPEC assembly [11]. | + | |
</p> | </p> | ||
| Line 510: | Line 204: | ||
<h3>Expression of Indigoidine Synthetase IndC in Five Substrains of ''E. coli''</h3> | <h3>Expression of Indigoidine Synthetase IndC in Five Substrains of ''E. coli''</h3> | ||
<p> | <p> | ||
| - | The open reading frame of the native indigoidine synthetase indC was amplified from genomic DNA of | + | The open reading frame of the native indigoidine synthetase indC was amplified from genomic DNA of <i>P. lumninescens laumondii</i> TT01 (DSM15139) and cloned into a pSB1C3 derived plasmid under the control of an lac-inducible promoter. This indC expression cassette was transformed into different substrains of <i>E. coli</i>, namely DH5alpha, MG1655, BAP1, TOP10 and NEB Turbo. All of these host strains were previously transformed with a pSB3K3 derived expression plasmid coding for the PPTase Sfp from ''B. subtilis'', which is commonly used in NRPS studies. As depicted in <a class="fancybox fancyGraphical" href="https://static.igem.org/mediawiki/2013/c/cf/Heidelberg_IndPD_Fig6.png" caption="<b>Figure 3: Comparison between different <em>E. coli</em> strains and PPTases:</b> |
| - | + | <b>a)</b> Comparison of different <em>E. coli</em> strains examining growth and indigoidine production | |
| - | <i>P. lumninescens laumondii</i> TT01 (DSM15139) and cloned into a pSB1C3 derived plasmid under the | + | The figure shows five different strains of <em>E. coli</em> that have been co-transformed with an indC expression plasmid and a sfp expression plasmid. The negative control is <em>E. coli</em> TOP10 without a plasmid. All transformants have been grown on LB agar for 48 hours at room temperature, cells were not induced. One can see that even without induction all strains express the indigoidine synthetase and produce the blue pigment indigoidine. However, the strains BAP1 and NEB Turbo grow faster in the first day, exhibiting a white phenotype (data not shown). Colonies on the plate of <em>E. coli</em> TOP10 are very small and dark blue/ black. Assuming that indigoidine production inhibits cell growth due to its toxicity, we concluded that TOP10 produced the most indigoidine among the strains we tested. We used <em>E. coli</em> TOP10 for the following experiments. |
| - | + | ||
| - | control of an lac-inducible promoter. This indC expression cassette was transformed into different | + | |
| - | + | ||
| - | substrains of <i>E. coli</i>, namely DH5alpha, MG1655, BAP1, TOP10 and NEB Turbo. All of these host | + | |
| - | + | ||
| - | strains were previously transformed with a pSB3K3 derived expression plasmid coding for the PPTase Sfp | + | |
| - | + | ||
| - | from ''B. subtilis'', which is commonly used in NRPS studies. As depicted in <a class="fancybox | + | |
| - | + | ||
| - | fancyGraphical" href="https://static.igem.org/mediawiki/2013/c/cf/Heidelberg_IndPD_Fig6.png" | + | |
| - | + | ||
| - | caption="<b>Figure 3: Comparison between different <em>E. coli</em> strains and PPTases:</b> | + | |
| - | <b>a)</b> Comparison of different <em>E. coli</em> strains examining growth and indigoidine | + | |
| - | + | ||
| - | production | + | |
| - | The figure shows five different strains of <em>E. coli</em> that have been co-transformed with an indC | + | |
| - | + | ||
| - | expression plasmid and a sfp expression plasmid. The negative control is <em>E. coli</em> TOP10 without | + | |
| - | + | ||
| - | a plasmid. All transformants have been grown on LB agar for 48 hours at room temperature, cells were | + | |
| - | + | ||
| - | not induced. One can see that even without induction all strains express the indigoidine synthetase and | + | |
| - | + | ||
| - | produce the blue pigment indigoidine. However, the strains BAP1 and NEB Turbo grow faster in the first | + | |
| - | + | ||
| - | day, exhibiting a white phenotype (data not shown). Colonies on the plate of <em>E. coli</em> TOP10 | + | |
| - | + | ||
| - | are very small and dark blue/ black. Assuming that indigoidine production inhibits cell growth due to | + | |
| - | + | ||
| - | its toxicity, we concluded that TOP10 produced the most indigoidine among the strains we tested. We | + | |
| - | + | ||
| - | used <em>E. coli</em> TOP10 for the following experiments. | + | |
<b>b)</b> Comparison between different PPTases concerning overall indigoidine production | <b>b)</b> Comparison between different PPTases concerning overall indigoidine production | ||
| - | The Figure shows <i>E. coli</i> TOP10 cells co-transformed with indC and four different PPTases (sfp, | + | The Figure shows <i>E. coli</i> TOP10 cells co-transformed with indC and four different PPTases (sfp, svp, entD and delC), respectively. The image bottom left shows <i>E. coli</i> TOP10 cells without additional PPTase and the negative control is TOP10 without a plasmid. |
| - | + | ">Fig. 3a</a>, Sfp is able to activate the T-domain of indC as determined by the blue phenotype of the transformed cells. Except for NEB Turbo cells, all transformed host strains displayed a decellerated growth and significantly smaller colonies on plate when compared to the <i>E. coli</i> TOP10 negative control. The blue phenotype developed late after transformation ranging from first blue colonies after 24 h and taking up to three days for visible poduction of the blue pigment. NEB Turbo showed regular colony growth and developed a strong blue phenotype upon induction with IPTG. As all host strains were able to express the functional indigoidine sythetase IndC, further experiments were only conducted with one <i>E. coli</i> strain. Due to its simplicity in handling and sufficient expression of the constructs, the substrain TOP10 was chosen. <br/><br/> | |
| - | svp, entD and delC), respectively. The image bottom left shows <i>E. coli</i> TOP10 cells without | + | |
| - | + | ||
| - | additional PPTase and the negative control is TOP10 without a plasmid. | + | |
| - | ">Fig. 3a</a>, Sfp is able to activate the T-domain of indC as determined by the blue phenotype of the | + | |
| - | + | ||
| - | transformed cells. Except for NEB Turbo cells, all transformed host strains displayed a decellerated | + | |
| - | + | ||
| - | growth and significantly smaller colonies on plate when compared to the <i>E. coli</i> TOP10 negative | + | |
| - | + | ||
| - | control. The blue phenotype developed late after transformation ranging from first blue colonies after | + | |
| - | + | ||
| - | 24 h and taking up to three days for visible poduction of the blue pigment. NEB Turbo showed regular | + | |
| - | + | ||
| - | colony growth and developed a strong blue phenotype upon induction with IPTG. As all host strains were | + | |
| - | + | ||
| - | able to express the functional indigoidine sythetase IndC, further experiments were only conducted with | + | |
| - | + | ||
| - | one <i>E. coli</i> strain. Due to its simplicity in handling and sufficient expression of the | + | |
| - | + | ||
| - | constructs, the substrain TOP10 was chosen. <br/><br/> | + | |
</p> | </p> | ||
<center> | <center> | ||
| - | <a class="fancybox fancyGraphical" | + | <a class="fancybox fancyGraphical" href="https://static.igem.org/mediawiki/2013/c/cf/Heidelberg_IndPD_Fig6.png" caption="<b>Figure 3: Comparison between different <em>E. coli</em> strains and PPTases:</b> |
| - | + | <b>a)</b> Comparison of different <em>E. coli</em> strains examining growth and indigoidine production | |
| - | href="https://static.igem.org/mediawiki/2013/c/cf/Heidelberg_IndPD_Fig6.png" caption="<b>Figure 3: Comparison | + | The figure shows five different strains of <em>E. coli</em> that have been co-transformed with an indC expression plasmid and a sfp expression plasmid. The negative control is <em>E. coli</em> TOP10 without a plasmid. All transformants have been grown on LB agar for 48 hours at room temperature, cells were not induced. One can see that even without induction all strains express the indigoidine synthetase and produce the blue pigment indigoidine. However, the strains BAP1 and NEB Turbo grow faster in the first day, exhibiting a white phenotype (data not shown). Colonies on the plate of <em>E. coli</em> TOP10 are very small and dark blue/ black. Assuming that indigoidine production inhibits cell growth due to its toxicity, we concluded that TOP10 produced the most indigoidine among the strains we tested. We used <em>E. coli</em> TOP10 for the following experiments. |
| - | + | ||
| - | between different <em>E. coli</em> strains and PPTases:</b> | + | |
| - | <b>a)</b> Comparison of different <em>E. coli</em> strains examining growth and indigoidine | + | |
| - | + | ||
| - | production | + | |
| - | The figure shows five different strains of <em>E. coli</em> that have been co-transformed with an indC | + | |
| - | + | ||
| - | expression plasmid and a sfp expression plasmid. The negative control is <em>E. coli</em> TOP10 without | + | |
| - | + | ||
| - | a plasmid. All transformants have been grown on LB agar for 48 hours at room temperature, cells were | + | |
| - | + | ||
| - | not induced. One can see that even without induction all strains express the indigoidine synthetase and | + | |
| - | + | ||
| - | produce the blue pigment indigoidine. However, the strains BAP1 and NEB Turbo grow faster in the first | + | |
| - | + | ||
| - | day, exhibiting a white phenotype (data not shown). Colonies on the plate of <em>E. coli</em> TOP10 | + | |
| - | + | ||
| - | are very small and dark blue/ black. Assuming that indigoidine production inhibits cell growth due to | + | |
| - | + | ||
| - | its toxicity, we concluded that TOP10 produced the most indigoidine among the strains we tested. We | + | |
| - | + | ||
| - | used <em>E. coli</em> TOP10 for the following experiments. | + | |
<b>b)</b> Comparison between different PPTases concerning overall indigoidine production | <b>b)</b> Comparison between different PPTases concerning overall indigoidine production | ||
| - | The Figure shows ''E. coli'' TOP10 cells co-transformed with indC and four different PPTases (sfp, svp, | + | The Figure shows ''E. coli'' TOP10 cells co-transformed with indC and four different PPTases (sfp, svp, entD and delC), respectively. The image bottom left shows ''E. coli'' TOP10 cells without additional PPTase and the negative control is TOP10 without a plasmid. |
| - | + | ||
| - | entD and delC), respectively. The image bottom left shows ''E. coli'' TOP10 cells without additional | + | |
| - | + | ||
| - | PPTase and the negative control is TOP10 without a plasmid. | + | |
"> | "> | ||
| - | <img style="width:40%; margin-bottom:10px; padding:1%;border-style:solid;border-width:1px;border- | + | <img style="width:40%; margin-bottom:10px; padding:1%;border-style:solid;border-width:1px;border-radius: 5px;" src="https://static.igem.org/mediawiki/2013/c/cf/Heidelberg_IndPD_Fig6.png"></img> |
| - | + | <figcaption style="width:80%;"><b>Figure 3: Comparison between different <em>E. coli</em> strains and PPTases:</b> | |
| - | radius: 5px;" src="https://static.igem.org/mediawiki/2013/c/cf/Heidelberg_IndPD_Fig6.png"></img> | + | <b>a)</b> Comparison of different <em>E. coli</em> strains examining growth and indigoidine production |
| - | <figcaption style="width:80%;"><b>Figure 3: Comparison between different <em>E. coli</em> strains | + | The figure shows five different strains of <em>E. coli</em> that have been co-transformed with an indC expression plasmid and a sfp expression plasmid. The negative control is <em>E. coli</em> TOP10 without a plasmid. All transformants have been grown on LB agar for 48 hours at room temperature, cells were not induced. One can see that even without induction all strains express the indigoidine synthetase and produce the blue pigment indigoidine. However, the strains BAP1 and NEB Turbo grow faster in the first day, exhibiting a white phenotype (data not shown). Colonies on the plate of <em>E. coli</em> TOP10 are very small and dark blue/ black. Assuming that indigoidine production inhibits cell growth due to its toxicity, we concluded that TOP10 produced the most indigoidine among the strains we tested. We used <em>E. coli</em> TOP10 for the following experiments. |
| - | + | ||
| - | and PPTases:</b> | + | |
| - | <b>a)</b> Comparison of different <em>E. coli</em> strains examining growth and indigoidine | + | |
| - | + | ||
| - | production | + | |
| - | The figure shows five different strains of <em>E. coli</em> that have been co-transformed with an indC | + | |
| - | + | ||
| - | expression plasmid and a sfp expression plasmid. The negative control is <em>E. coli</em> TOP10 without | + | |
| - | + | ||
| - | a plasmid. All transformants have been grown on LB agar for 48 hours at room temperature, cells were | + | |
| - | + | ||
| - | not induced. One can see that even without induction all strains express the indigoidine synthetase and | + | |
| - | + | ||
| - | produce the blue pigment indigoidine. However, the strains BAP1 and NEB Turbo grow faster in the first | + | |
| - | + | ||
| - | day, exhibiting a white phenotype (data not shown). Colonies on the plate of <em>E. coli</em> TOP10 | + | |
| - | + | ||
| - | are very small and dark blue/ black. Assuming that indigoidine production inhibits cell growth due to | + | |
| - | + | ||
| - | its toxicity, we concluded that TOP10 produced the most indigoidine among the strains we tested. We | + | |
| - | + | ||
| - | used <em>E. coli</em> TOP10 for the following experiments. | + | |
<b>b)</b> Comparison between different PPTases concerning overall indigoidine production | <b>b)</b> Comparison between different PPTases concerning overall indigoidine production | ||
| - | The Figure shows ''E. coli'' TOP10 cells co-transformed with indC and four different PPTases (sfp, svp, | + | The Figure shows ''E. coli'' TOP10 cells co-transformed with indC and four different PPTases (sfp, svp, entD and delC), respectively. The image bottom left shows ''E. coli'' TOP10 cells without additional PPTase and the negative control is TOP10 without a plasmid. |
| - | + | ||
| - | entD and delC), respectively. The image bottom left shows ''E. coli'' TOP10 cells without additional | + | |
| - | + | ||
| - | PPTase and the negative control is TOP10 without a plasmid. | + | |
</figcaption> | </figcaption> | ||
| Line 644: | Line 234: | ||
<h3>Indigoidine Production Varies when Co-expressed with Different PPTases</h3> | <h3>Indigoidine Production Varies when Co-expressed with Different PPTases</h3> | ||
<p> | <p> | ||
| - | The expression of indC under activation by the endogenous PPTase entD in ''E. coli'' was sufficient for | + | The expression of indC under activation by the endogenous PPTase entD in ''E. coli'' was sufficient for easy detection of indigoidine production on plates <a class="fancybox fancyGraphical" href="https://static.igem.org/mediawiki/2013/c/cf/Heidelberg_IndPD_Fig6.png" caption="<b>Figure 3: Comparison between different <em>E. coli</em> strains and PPTases:</b> |
| - | + | <b>a)</b> Comparison of different <em>E. coli</em> strains examining growth and indigoidine production | |
| - | easy detection of indigoidine production on plates <a class="fancybox fancyGraphical" | + | The figure shows five different strains of <em>E. coli</em> that have been co-transformed with an indC expression plasmid and a sfp expression plasmid. The negative control is <em>E. coli</em> TOP10 without a plasmid. All transformants have been grown on LB agar for 48 hours at room temperature, cells were not induced. One can see that even without induction all strains express the indigoidine synthetase and produce the blue pigment indigoidine. However, the strains BAP1 and NEB Turbo grow faster in the first day, exhibiting a white phenotype (data not shown). Colonies on the plate of <em>E. coli</em> TOP10 are very small and dark blue/ black. Assuming that indigoidine production inhibits cell growth due to its toxicity, we concluded that TOP10 produced the most indigoidine among the strains we tested. We used <em>E. coli</em> TOP10 for the following experiments. |
| - | + | ||
| - | href="https://static.igem.org/mediawiki/2013/c/cf/Heidelberg_IndPD_Fig6.png" caption="<b>Figure 3: Comparison | + | |
| - | + | ||
| - | between different <em>E. coli</em> strains and PPTases:</b> | + | |
| - | <b>a)</b> Comparison of different <em>E. coli</em> strains examining growth and indigoidine | + | |
| - | + | ||
| - | production | + | |
| - | The figure shows five different strains of <em>E. coli</em> that have been co-transformed with an indC | + | |
| - | + | ||
| - | expression plasmid and a sfp expression plasmid. The negative control is <em>E. coli</em> TOP10 without | + | |
| - | + | ||
| - | a plasmid. All transformants have been grown on LB agar for 48 hours at room temperature, cells were | + | |
| - | + | ||
| - | not induced. One can see that even without induction all strains express the indigoidine synthetase and | + | |
| - | + | ||
| - | produce the blue pigment indigoidine. However, the strains BAP1 and NEB Turbo grow faster in the first | + | |
| - | + | ||
| - | day, exhibiting a white phenotype (data not shown). Colonies on the plate of <em>E. coli</em> TOP10 | + | |
| - | + | ||
| - | are very small and dark blue/ black. Assuming that indigoidine production inhibits cell growth due to | + | |
| - | + | ||
| - | its toxicity, we concluded that TOP10 produced the most indigoidine among the strains we tested. We | + | |
| - | + | ||
| - | used <em>E. coli</em> TOP10 for the following experiments. | + | |
<b>b)</b> Comparison between different PPTases concerning overall indigoidine production | <b>b)</b> Comparison between different PPTases concerning overall indigoidine production | ||
| - | The Figure shows <i>E. coli</i> TOP10 cells co-transformed with indC and four different PPTases (sfp, | + | The Figure shows <i>E. coli</i> TOP10 cells co-transformed with indC and four different PPTases (sfp, svp, entD and delC), respectively. The image bottom left shows <i>E. coli</i> TOP10 cells without additional PPTase and the negative control is TOP10 without a plasmid. |
| - | + | ">Fig. 3b</a>, indC). In order to determine, whether the amount of indigoidine in the <i>E. coli</i> TOP10 cells is dependent on the quality of the interacting of indC with the PPTase, four PPTase dervied from varying origins were selected and amplified from the genome of the hosts of origin. ''E. coli''TOP10 cells were co-transformed with plasmids coding for the different PPTases and the plasmid containing the expression cassette for indC. As reference for the endogenous PPTase activity served cells only transformed with the indC plasmid. Irrespective of the PPTase, growth of colonies was retarded. Remarkably however, colonies co-transformed with the PPTase plasmid remained of smaller size than the ones only carrying the indC construct. On the other side, indigoidine production was more diffuse in the latter cells with secretion of the blue pigment into the agar (<a class="fancybox fancyGraphical" href="https://static.igem.org/mediawiki/2013/c/cf/Heidelberg_IndPD_Fig6.png" caption="<b>Figure 3: Comparison between different <em>E. coli</em> strains and PPTases:</b> | |
| - | svp, entD and delC), respectively. The image bottom left shows <i>E. coli</i> TOP10 cells without | + | <b>a)</b> Comparison of different <em>E. coli</em> strains examining growth and indigoidine production |
| - | + | The figure shows five different strains of <em>E. coli</em> that have been co-transformed with an indC expression plasmid and a sfp expression plasmid. The negative control is <em>E. coli</em> TOP10 without a plasmid. All transformants have been grown on LB agar for 48 hours at room temperature, cells were not induced. One can see that even without induction all strains express the indigoidine synthetase and produce the blue pigment indigoidine. However, the strains BAP1 and NEB Turbo grow faster in the first day, exhibiting a white phenotype (data not shown). Colonies on the plate of <em>E. coli</em> TOP10 are very small and dark blue/ black. Assuming that indigoidine production inhibits cell growth due to its toxicity, we concluded that TOP10 produced the most indigoidine among the strains we tested. We used <em>E. coli</em> TOP10 for the following experiments. | |
| - | additional PPTase and the negative control is TOP10 without a plasmid. | + | |
| - | ">Fig. 3b</a>, indC). In order to determine, whether the amount of indigoidine in the <i>E. coli</i> | + | |
| - | + | ||
| - | TOP10 cells is dependent on the quality of the interacting of indC with the PPTase, four PPTase dervied | + | |
| - | + | ||
| - | from varying origins were selected and amplified from the genome of the hosts of origin. ''E. | + | |
| - | + | ||
| - | coli''TOP10 cells were co-transformed with plasmids coding for the different PPTases and the plasmid | + | |
| - | + | ||
| - | containing the expression cassette for indC. As reference for the endogenous PPTase activity served | + | |
| - | + | ||
| - | cells only transformed with the indC plasmid. Irrespective of the PPTase, growth of colonies was | + | |
| - | + | ||
| - | retarded. Remarkably however, colonies co-transformed with the PPTase plasmid remained of smaller size | + | |
| - | + | ||
| - | than the ones only carrying the indC construct. On the other side, indigoidine production was more | + | |
| - | + | ||
| - | diffuse in the latter cells with secretion of the blue pigment into the agar (<a class="fancybox | + | |
| - | + | ||
| - | fancyGraphical" href="https://static.igem.org/mediawiki/2013/c/cf/Heidelberg_IndPD_Fig6.png" | + | |
| - | + | ||
| - | caption="<b>Figure 3: Comparison between different <em>E. coli</em> strains and PPTases:</b> | + | |
| - | <b>a)</b> Comparison of different <em>E. coli</em> strains examining growth and indigoidine | + | |
| - | + | ||
| - | production | + | |
| - | The figure shows five different strains of <em>E. coli</em> that have been co-transformed with an indC | + | |
| - | + | ||
| - | expression plasmid and a sfp expression plasmid. The negative control is <em>E. coli</em> TOP10 without | + | |
| - | + | ||
| - | a plasmid. All transformants have been grown on LB agar for 48 hours at room temperature, cells were | + | |
| - | + | ||
| - | not induced. One can see that even without induction all strains express the indigoidine synthetase and | + | |
| - | + | ||
| - | produce the blue pigment indigoidine. However, the strains BAP1 and NEB Turbo grow faster in the first | + | |
| - | + | ||
| - | day, exhibiting a white phenotype (data not shown). Colonies on the plate of <em>E. coli</em> TOP10 | + | |
| - | + | ||
| - | are very small and dark blue/ black. Assuming that indigoidine production inhibits cell growth due to | + | |
| - | + | ||
| - | its toxicity, we concluded that TOP10 produced the most indigoidine among the strains we tested. We | + | |
| - | + | ||
| - | used <em>E. coli</em> TOP10 for the following experiments. | + | |
<b>b)</b> Comparison between different PPTases concerning overall indigoidine production | <b>b)</b> Comparison between different PPTases concerning overall indigoidine production | ||
| - | The Figure shows ''E. coli'' TOP10 cells co-transformed with indC and four different PPTases (sfp, svp, | + | The Figure shows ''E. coli'' TOP10 cells co-transformed with indC and four different PPTases (sfp, svp, entD and delC), respectively. The image bottom left shows ''E. coli'' TOP10 cells without additional PPTase and the negative control is TOP10 without a plasmid. |
| - | + | ">Fig. 3b</a>, indC) and only slight blue-greenish coloring of the colonies. The four PPTases additionally introduced into the TOP10 cells were all shown to be functional (blue phenotype of the transformants, <a class="fancybox fancyGraphical" href="https://static.igem.org/mediawiki/2013/c/cf/Heidelberg_IndPD_Fig6.png" caption="<b>Figure 3: Comparison between different <em>E. coli</em> strains and PPTases:</b> | |
| - | entD and delC), respectively. The image bottom left shows ''E. coli'' TOP10 cells without additional | + | <b>a)</b> Comparison of different <em>E. coli</em> strains examining growth and indigoidine production |
| - | + | The figure shows five different strains of <em>E. coli</em> that have been co-transformed with an indC expression plasmid and a sfp expression plasmid. The negative control is <em>E. coli</em> TOP10 without a plasmid. All transformants have been grown on LB agar for 48 hours at room temperature, cells were not induced. One can see that even without induction all strains express the indigoidine synthetase and produce the blue pigment indigoidine. However, the strains BAP1 and NEB Turbo grow faster in the first day, exhibiting a white phenotype (data not shown). Colonies on the plate of <em>E. coli</em> TOP10 are very small and dark blue/ black. Assuming that indigoidine production inhibits cell growth due to its toxicity, we concluded that TOP10 produced the most indigoidine among the strains we tested. We used <em>E. coli</em> TOP10 for the following experiments. | |
| - | PPTase and the negative control is TOP10 without a plasmid. | + | |
| - | ">Fig. 3b</a>, indC) and only slight blue-greenish coloring of the colonies. The four PPTases | + | |
| - | + | ||
| - | additionally introduced into the TOP10 cells were all shown to be functional (blue phenotype of the | + | |
| - | + | ||
| - | transformants, <a class="fancybox fancyGraphical" | + | |
| - | + | ||
| - | href="https://static.igem.org/mediawiki/2013/c/cf/Heidelberg_IndPD_Fig6.png" caption="<b>Figure 3: Comparison | + | |
| - | + | ||
| - | between different <em>E. coli</em> strains and PPTases:</b> | + | |
| - | <b>a)</b> Comparison of different <em>E. coli</em> strains examining growth and indigoidine | + | |
| - | + | ||
| - | production | + | |
| - | The figure shows five different strains of <em>E. coli</em> that have been co-transformed with an indC | + | |
| - | + | ||
| - | expression plasmid and a sfp expression plasmid. The negative control is <em>E. coli</em> TOP10 without | + | |
| - | + | ||
| - | a plasmid. All transformants have been grown on LB agar for 48 hours at room temperature, cells were | + | |
| - | + | ||
| - | not induced. One can see that even without induction all strains express the indigoidine synthetase and | + | |
| - | + | ||
| - | produce the blue pigment indigoidine. However, the strains BAP1 and NEB Turbo grow faster in the first | + | |
| - | + | ||
| - | day, exhibiting a white phenotype (data not shown). Colonies on the plate of <em>E. coli</em> TOP10 | + | |
| - | + | ||
| - | are very small and dark blue/ black. Assuming that indigoidine production inhibits cell growth due to | + | |
| - | + | ||
| - | its toxicity, we concluded that TOP10 produced the most indigoidine among the strains we tested. We | + | |
| - | + | ||
| - | used <em>E. coli</em> TOP10 for the following experiments. | + | |
<b>b)</b> Comparison between different PPTases concerning overall indigoidine production | <b>b)</b> Comparison between different PPTases concerning overall indigoidine production | ||
| - | The Figure shows ''E. coli'' TOP10 cells co-transformed with indC and four different PPTases (sfp, svp, | + | The Figure shows ''E. coli'' TOP10 cells co-transformed with indC and four different PPTases (sfp, svp, entD and delC), respectively. The image bottom left shows ''E. coli'' TOP10 cells without additional PPTase and the negative control is TOP10 without a plasmid. |
| - | + | ||
| - | entD and delC), respectively. The image bottom left shows ''E. coli'' TOP10 cells without additional | + | |
| - | + | ||
| - | PPTase and the negative control is TOP10 without a plasmid. | + | |
">Fig. 3b</a> | ">Fig. 3b</a> | ||
| - | ), but lead to the retention of most of the indigoidine within the cells. Colonies of cells transformed | + | ), but lead to the retention of most of the indigoidine within the cells. Colonies of cells transformed with thess constructs, were of convex shape and of distinct, dark blue color. Overall, cells carrying an additional PPTase showed increased indigoidine production compared to the cells relying on the endogenous entD. |
| - | + | ||
| - | with thess constructs, were of convex shape and of distinct, dark blue color. Overall, cells carrying | + | |
| - | + | ||
| - | an additional PPTase showed increased indigoidine production compared to the cells relying on the | + | |
| - | + | ||
| - | endogenous entD. | + | |
</p> | </p> | ||
| Line 772: | Line 256: | ||
<h3>T-Domain Exchanges in IndC Yield Functional Indigoidine Synthetases</h3> | <h3>T-Domain Exchanges in IndC Yield Functional Indigoidine Synthetases</h3> | ||
<p> | <p> | ||
| - | The main structural characteristic of NRPSs is their modular composition on different hierarchical | + | The main structural characteristic of NRPSs is their modular composition on different hierarchical levels. The indogoidine synthetase indC is a single module NRPS comprised of the three domains, namely AOxA, T and TE. Since the functionality of this NRPS is detectable by the bare eye, it offers a perfect and simple experimental set-up for proof of principle experiments regarding the interchangeability of domains from different NRPS. Out of the three domains in indC, the T-domain is supposed to exhibit the least substrate specificity and was thus chosen for first domain shuffling approaches. For the initial definition of T-domain boundaries of indC, we used Pfam, a web-tool which allows -amongst other functions- for the prediction of NRPS module and domain boundaries (<a href="Pfam.sanger.ac.uk">Pfam.sanger.ac.uk</a>. Following the boundary prediction, we choose a two-pronged domain shuffling approach: First, we transferred native T-domains derived from either different host species and/or NRPS of entirely different function into the indC indigoidine synthetase (<em>Streptomyces lavendulae lavendulae</em> ATCC11924 (blue pigment synthetase bpsA) [6], <em>Brevibacillus parabrevis</em> (Tyrocidine synthesis cluster) [2], <em>Delftia acidovorans</em> SPH-1 (Delftibactin synthesis cluster) [8], <em>Photorhabdus luminescens laumondii</em> TT01 (plu2670 and plu2642, unknown function) [14] and <em>Escherichia coli</em> MG1655 (entF from enterobactin synthesis cluster) [4]). Second, we deviced three methods for the generation of synthetic T-domains based on different NRPS libraries generated by BLAST search against either specific subranges of host organisms or restricting the query sequence to be BLASTed (<a href="BLAST.ncbi.nlm.nih.gov">BLAST.ncbi.nlm.nih.gov</a>). The engineered indigoidine synthetases were coexpressed with supplementary PPTases (sfp, svp, entD and delC) in <i>E. coli</i> TOP10 cells (<a class="fancybox fancyGraphical" "href="https://static.igem.org/mediawiki/2013/1/11/Heidelberg_tagopt_Fig4.png" caption="<b>Figure 4: Coexpression of Engineered Indigoidine Synthetases and Supplementary PPTases in <i>E. coli</i></b> |
| - | + | In this first experiment, we replaced the indC T-domain with the T-domains of other native NRPS modules (1: wild-type indC, 2: bpsA,3: entF, 4: delH4, 5: delH5, 6: tycA, 7: tycC6, 8: plu2642 and 9: plu2670) and synthetic T-domains (10-16: synT1-7). We also exchanged both the T- and TE-domain by the T- and TE-domain of other natural NRPS modules (17: bpsA, 18: tycC6, 19: delH5). The cells have been co-transformed with a plasmid containing the respective engineered variant of indC and a second plasmid coding for the PPTase Sfp, Svp, EntD or DelC. The first row shows plates with cells only expressing the engineered indigoidine synthetases without a supplementary PPTase. Note that some combinations result in blue colonies, whereas others don't.">Fig. 4a</a>). | |
| - | levels. The indogoidine synthetase indC is a single module NRPS comprised of the three domains, namely | + | |
| - | + | ||
| - | AOxA, T and TE. Since the functionality of this NRPS is detectable by the bare eye, it offers a perfect | + | |
| - | + | ||
| - | and simple experimental set-up for proof of principle experiments regarding the interchangeability of | + | |
| - | + | ||
| - | domains from different NRPS. Out of the three domains in indC, the T-domain is supposed to exhibit the | + | |
| - | + | ||
| - | least substrate specificity and was thus chosen for first domain shuffling approaches. For the initial | + | |
| - | + | ||
| - | definition of T-domain boundaries of indC, we used Pfam, a web-tool which allows -amongst other | + | |
| - | + | ||
| - | functions- for the prediction of NRPS module and domain boundaries (<a | + | |
| - | + | ||
| - | href="Pfam.sanger.ac.uk">Pfam.sanger.ac.uk</a>. Following the boundary prediction, we choose a two- | + | |
| - | + | ||
| - | pronged domain shuffling approach: First, we transferred native T-domains derived from either different | + | |
| - | + | ||
| - | host species and/or NRPS of entirely different function into the indC indigoidine synthetase | + | |
| - | + | ||
| - | (<em>Streptomyces lavendulae lavendulae</em> ATCC11924 (blue pigment synthetase bpsA) [6], | + | |
| - | + | ||
| - | <em>Brevibacillus parabrevis</em> (Tyrocidine synthesis cluster) [2], <em>Delftia acidovorans</em> | + | |
| - | + | ||
| - | SPH-1 (Delftibactin synthesis cluster) [8], <em>Photorhabdus luminescens laumondii</em> TT01 (plu2670 | + | |
| - | + | ||
| - | and plu2642, unknown function) [14] and <em>Escherichia coli</em> MG1655 (entF from enterobactin | + | |
| - | + | ||
| - | synthesis cluster) [4]). Second, we deviced three methods for the generation of synthetic T-domains | + | |
| - | + | ||
| - | based on different NRPS libraries generated by BLAST search against either specific subranges of host | + | |
| - | + | ||
| - | organisms or restricting the query sequence to be BLASTed (<a | + | |
| - | + | ||
| - | href="BLAST.ncbi.nlm.nih.gov">BLAST.ncbi.nlm.nih.gov</a>). The engineered indigoidine synthetases were | + | |
| - | + | ||
| - | coexpressed with supplementary PPTases (sfp, svp, entD and delC) in <i>E. coli</i> TOP10 cells (<a | + | |
| - | + | ||
| - | class="fancybox fancyGraphical" | + | |
| - | + | ||
| - | "href="https://static.igem.org/mediawiki/2013/1/11/Heidelberg_tagopt_Fig4.png" caption="<b>Figure 4: | + | |
| - | + | ||
| - | Coexpression of Engineered Indigoidine Synthetases and Supplementary PPTases in <i>E. coli</i></b> | + | |
| - | In this first experiment, we replaced the indC T-domain with the T-domains of other native NRPS | + | |
| - | + | ||
| - | modules (1: wild-type indC, 2: bpsA,3: entF, 4: delH4, 5: delH5, 6: tycA, 7: tycC6, 8: plu2642 and 9: | + | |
| - | + | ||
| - | plu2670) and synthetic T-domains (10-16: synT1-7). We also exchanged both the T- and TE-domain by the | + | |
| - | + | ||
| - | T- and TE-domain of other natural NRPS modules (17: bpsA, 18: tycC6, 19: delH5). The cells have been | + | |
| - | + | ||
| - | co-transformed with a plasmid containing the respective engineered variant of indC and a second plasmid | + | |
| - | + | ||
| - | coding for the PPTase Sfp, Svp, EntD or DelC. The first row shows plates with cells only expressing the | + | |
| - | + | ||
| - | engineered indigoidine synthetases without a supplementary PPTase. Note that some combinations result | + | |
| - | + | ||
| - | in blue colonies, whereas others don't.">Fig. 4a</a>). | + | |
</p> | </p> | ||
<br/> | <br/> | ||
| Line 838: | Line 264: | ||
<a class="fancybox fancyGraphical" | <a class="fancybox fancyGraphical" | ||
| - | href="https://static.igem.org/mediawiki/2013/1/11/Heidelberg_tagopt_Fig4.png" caption="<b>Figure 4: | + | href="https://static.igem.org/mediawiki/2013/1/11/Heidelberg_tagopt_Fig4.png" caption="<b>Figure 4: Coexpression of Engineered Indigoidine Synthetases and Supplementary PPTases in <i>E. coli</i></b> |
| - | + | In this first experiment, we replaced the indC T-domain with the T-domains of other native NRPS modules (1: wild-type indC, 2: bpsA,3: entF, 4: delH4, 5: delH5, 6: tycA, 7: tycC6, 8: plu2642 and 9: plu2670) and synthetic T-domains (10-16: synT1-7). We also exchanged both the T- and TE-domain by the T- and TE-domain of other natural NRPS modules (17: bpsA, 18: tycC6, 19: delH5). The cells have been co-transformed with a plasmid containing the respective engineered variant of indC and a second plasmid coding for the PPTase Sfp, Svp, EntD or DelC. The first row shows plates with cells only expressing the engineered indigoidine synthetases without a supplementary PPTase. Note that some combinations result in blue colonies, whereas others don't."> | |
| - | Coexpression of Engineered Indigoidine Synthetases and Supplementary PPTases in <i>E. coli</i></b> | + | |
| - | In this first experiment, we replaced the indC T-domain with the T-domains of other native NRPS | + | |
| - | + | ||
| - | modules (1: wild-type indC, 2: bpsA,3: entF, 4: delH4, 5: delH5, 6: tycA, 7: tycC6, 8: plu2642 and 9: | + | |
| - | + | ||
| - | plu2670) and synthetic T-domains (10-16: synT1-7). We also exchanged both the T- and TE-domain by the | + | |
| - | + | ||
| - | T- and TE-domain of other natural NRPS modules (17: bpsA, 18: tycC6, 19: delH5). The cells have been | + | |
| - | + | ||
| - | co-transformed with a plasmid containing the respective engineered variant of indC and a second plasmid | + | |
| - | + | ||
| - | coding for the PPTase Sfp, Svp, EntD or DelC. The first row shows plates with cells only expressing the | + | |
| - | + | ||
| - | engineered indigoidine synthetases without a supplementary PPTase. Note that some combinations result | + | |
| - | + | ||
| - | in blue colonies, whereas others don't."> | + | |
<img style="width:60%; align:center; margin-bottom:10px; padding:1%;border- | <img style="width:60%; align:center; margin-bottom:10px; padding:1%;border- | ||
| Line 861: | Line 271: | ||
src="https://static.igem.org/mediawiki/2013/1/11/Heidelberg_tagopt_Fig4.png"></img> | src="https://static.igem.org/mediawiki/2013/1/11/Heidelberg_tagopt_Fig4.png"></img> | ||
| - | <figcaption style="width:80%;"><b>Figure 4: Coexpression of Engineered Indigoidine Synthetases and | + | <figcaption style="width:80%;"><b>Figure 4: Coexpression of Engineered Indigoidine Synthetases and Supplementary PPTases in <i>E. coli</i></b> |
| - | + | In this first experiment, we replaced the indC T-domain with the T-domains of other native NRPS modules (1: wild-type indC, 2: bpsA,3: entF, 4: delH4, 5: delH5, 6: tycA, 7: tycC6, 8: plu2642 and 9: plu2670) and synthetic T-domains (10-16: synT1-7). We also exchanged both the T- and TE-domain by the T- and TE-domain of other natural NRPS modules (17: bpsA, 18: tycC6, 19: delH5). The cells have been co-transformed with a plasmid containing the respective engineered variant of indC and a second plasmid coding for the PPTase Sfp, Svp, EntD or DelC. The first row shows plates with cells only expressing the engineered indigoidine synthetases without a supplementary PPTase. Note that some combinations result in blue colonies, whereas others don't. | |
| - | Supplementary PPTases in <i>E. coli</i></b> | + | |
| - | In this first experiment, we replaced the indC T-domain with the T-domains of other native NRPS | + | |
| - | + | ||
| - | modules (1: wild-type indC, 2: bpsA,3: entF, 4: delH4, 5: delH5, 6: tycA, 7: tycC6, 8: plu2642 and 9: | + | |
| - | + | ||
| - | plu2670) and synthetic T-domains (10-16: synT1-7). We also exchanged both the T- and TE-domain by the | + | |
| - | + | ||
| - | T- and TE-domain of other natural NRPS modules (17: bpsA, 18: tycC6, 19: delH5). The cells have been | + | |
| - | + | ||
| - | co-transformed with a plasmid containing the respective engineered variant of indC and a second plasmid | + | |
| - | + | ||
| - | coding for the PPTase Sfp, Svp, EntD or DelC. The first row shows plates with cells only expressing the | + | |
| - | + | ||
| - | engineered indigoidine synthetases without a supplementary PPTase. Note that some combinations result | + | |
| - | + | ||
| - | in blue colonies, whereas others don't. | + | |
</figcaption> | </figcaption> | ||
</a> | </a> | ||
| Line 884: | Line 278: | ||
<br/> | <br/> | ||
<p> | <p> | ||
| - | As depicted in <a class="fancybox fancyGraphical" | + | As depicted in <a class="fancybox fancyGraphical" href="https://static.igem.org/mediawiki/2013/f/f1/Heidelberg_IndPD_Fig7.png" caption="<b>Figure 5: Indigoidine Production by Modified Variants of IndC</b> |
| - | + | We replaced the indC T-domain with both the T-domains of other native NRPS modules (entF, delH, tycC, tycA, bpsA, plu2642 and plu2670) and synthetic T-domains. The figure shows the five modified versions of indC that remain the enzyme function, thus resulting in a blue phenotype of transformed ''E. coli'' TOP10. The cells have been co-transformed with a plasmid containing the respective engineered variant of indC and a second plasmid coding for the PPTase sfp, svp, entD and delC. The figure shows representative results; all transformants of this first experiment can be seen in Fig. 4. | |
| - | href="https://static.igem.org/mediawiki/2013/f/f1/Heidelberg_IndPD_Fig7.png" caption="<b>Figure 5: | + | ">Fig. 5</a>, both approaches lead principally to fully functional indCs. The synthetic T-domains 1, 3 and 4 showed the same decreased growth and indigoidine production on plates as did the native T-domain derived from ''P. lumninescens''. The colonies obtained after co-transformation with supplementary PPTase plasmid were small in size and of dark blue color. Compared to synthetic T-domain 5, indigoidine production started earlier (approximately after 24-30 hours). |
| - | + | ||
| - | Indigoidine Production by Modified Variants of IndC</b> | + | |
| - | We replaced the indC T-domain with both the T-domains of other native NRPS modules (entF, delH, | + | |
| - | + | ||
| - | tycC, tycA, bpsA, plu2642 and plu2670) and synthetic T-domains. The figure shows the five modified | + | |
| - | + | ||
| - | versions of indC that remain the enzyme function, thus resulting in a blue phenotype of transformed | + | |
| - | + | ||
| - | ''E. coli'' TOP10. The cells have been co-transformed with a plasmid containing the respective | + | |
| - | + | ||
| - | engineered variant of indC and a second plasmid coding for the PPTase sfp, svp, entD and delC. The | + | |
| - | + | ||
| - | figure shows representative results; all transformants of this first experiment can be seen in Fig. 4. | + | |
| - | ">Fig. 5</a>, both approaches lead principally to fully functional indCs. The synthetic T-domains 1, 3 | + | |
| - | + | ||
| - | and 4 showed the same decreased growth and indigoidine production on plates as did the native T-domain | + | |
| - | + | ||
| - | derived from ''P. lumninescens''. The colonies obtained after co-transformation with supplementary | + | |
| - | + | ||
| - | PPTase plasmid were small in size and of dark blue color. Compared to synthetic T-domain 5, indigoidine | + | |
| - | + | ||
| - | production started earlier (approximately after 24-30 hours). | + | |
</p> | </p> | ||
<br/> | <br/> | ||
<center> | <center> | ||
| - | <a class="fancybox fancyGraphical" | + | <a class="fancybox fancyGraphical" href="https://static.igem.org/mediawiki/2013/f/f1/Heidelberg_IndPD_Fig7.png" caption="<b>Figure 5: Indigoidine Production by Modified Variants of IndC</b> |
| - | + | We replaced the indC T-domain with both the T-domains of other native NRPS modules (entF, delH, tycC, tycA, bpsA, plu2642 and plu2670) and synthetic T-domains. The figure shows the five modified versions of indC that remain the enzyme function, thus resulting in a blue phenotype of transformed ''E. coli'' TOP10. The cells have been co-transformed with a plasmid containing the respective engineered variant of indC and a second plasmid coding for the PPTase sfp, svp, entD and delC. The figure shows representative results; all transformants of this first experiment can be seen in Fig. 4. | |
| - | href="https://static.igem.org/mediawiki/2013/f/f1/Heidelberg_IndPD_Fig7.png" caption="<b>Figure 5: | + | |
| - | + | ||
| - | Indigoidine Production by Modified Variants of IndC</b> | + | |
| - | We replaced the indC T-domain with both the T-domains of other native NRPS modules (entF, delH, | + | |
| - | + | ||
| - | tycC, tycA, bpsA, plu2642 and plu2670) and synthetic T-domains. The figure shows the five modified | + | |
| - | + | ||
| - | versions of indC that remain the enzyme function, thus resulting in a blue phenotype of transformed | + | |
| - | + | ||
| - | ''E. coli'' TOP10. The cells have been co-transformed with a plasmid containing the respective | + | |
| - | + | ||
| - | engineered variant of indC and a second plasmid coding for the PPTase sfp, svp, entD and delC. The | + | |
| - | + | ||
| - | figure shows representative results; all transformants of this first experiment can be seen in Fig. 4. | + | |
"> | "> | ||
| - | <img style="width:40%; align:center; margin-bottom:10px; padding:1%;border-style:solid;border- | + | <img style="width:40%; align:center; margin-bottom:10px; padding:1%;border-style:solid;border-width:1px;border-radius: 5px;" src="https://static.igem.org/mediawiki/2013/f/f1/Heidelberg_IndPD_Fig7.png"></img> |
| - | + | <figcaption style="width:80%;"><b>Figure 5: Indigoidine Production by Modified Variants of IndC</b> | |
| - | width:1px;border-radius: 5px;" | + | We replaced the indC T-domain with both the T-domains of other native NRPS modules (entF, delH, tycC, tycA, bpsA, plu2642 and plu2670) and synthetic T-domains. The figure shows the five modified versions of indC that remain the enzyme function, thus resulting in a blue phenotype of transformed ''E. coli'' TOP10. The cells have been co-transformed with a plasmid containing the respective engineered variant of indC and a second plasmid coding for the PPTase sfp, svp, entD and delC. The figure shows representative results; all transformants of this first experiment can be seen in Fig. 4. |
| - | + | ||
| - | src="https://static.igem.org/mediawiki/2013/f/f1/Heidelberg_IndPD_Fig7.png"></img> | + | |
| - | <figcaption style="width:80%;"><b>Figure 5: Indigoidine Production by Modified Variants of | + | |
| - | + | ||
| - | IndC</b> | + | |
| - | We replaced the indC T-domain with both the T-domains of other native NRPS modules (entF, delH, | + | |
| - | + | ||
| - | tycC, tycA, bpsA, plu2642 and plu2670) and synthetic T-domains. The figure shows the five modified | + | |
| - | + | ||
| - | versions of indC that remain the enzyme function, thus resulting in a blue phenotype of transformed | + | |
| - | + | ||
| - | ''E. coli'' TOP10. The cells have been co-transformed with a plasmid containing the respective | + | |
| - | + | ||
| - | engineered variant of indC and a second plasmid coding for the PPTase sfp, svp, entD and delC. The | + | |
| - | + | ||
| - | figure shows representative results; all transformants of this first experiment can be seen in Fig. 4. | + | |
</figcaption> | </figcaption> | ||
</a> | </a> | ||
| Line 954: | Line 296: | ||
<br/> | <br/> | ||
<p> | <p> | ||
| - | In contrast to the synthetic domains 1,3 and 4 which were designed by the consensus method and showed | + | In contrast to the synthetic domains 1,3 and 4 which were designed by the consensus method and showed medium to high similarity to the sequence of origin, synthetic domain 5 was generated by the guided random method. |
| - | + | Remarkably, even though 39 out of the 62 amino acids of the original T-domain were exchanged, the indigoidine synthetase with this T-domain was still functional. Closer analysis of the sequence compared to the original indC T-domain sequence showed, that the characteristics of the amino acid sequence, i. e. for instance polar or charged amino acids, were retained in 72 % of the sequence. Also, the GGxS core sequence of the T-domain at which the activation by the PPTas occurs was conserved. | |
| - | medium to high similarity to the sequence of origin, synthetic domain 5 was generated by the guided | + | |
| - | + | ||
| - | random method. | + | |
| - | Remarkably, even though 39 out of the 62 amino acids of the original T-domain were exchanged, the | + | |
| - | + | ||
| - | indigoidine synthetase with this T-domain was still functional. Closer analysis of the sequence | + | |
| - | + | ||
| - | compared to the original indC T-domain sequence showed, that the characteristics of the amino acid | + | |
| - | + | ||
| - | sequence, i. e. for instance polar or charged amino acids, were retained in 72 % of the sequence. Also, | + | |
| - | + | ||
| - | the GGxS core sequence of the T-domain at which the activation by the PPTas occurs was conserved. | + | |
</p> | </p> | ||
| Line 973: | Line 303: | ||
<h3>The Efficiency of Engineered NRPS is Improved When Optimal Domain Borders Are Applied</h3> | <h3>The Efficiency of Engineered NRPS is Improved When Optimal Domain Borders Are Applied</h3> | ||
<p> | <p> | ||
| - | Multiple web-tools exist which offer the prediction of NRPS module and domain boundaries. One of the | + | Multiple web-tools exist which offer the prediction of NRPS module and domain boundaries. One of the most common used prediction tools is Pfam which we used as a starting point to determine the best method for defining domain boundaries. Pfam predicted large linker structures between the end of the A- and the beginning of the T-domain (compare <a class="fancybox fancyGraphical" href="https://static.igem.org/mediawiki/2013/f/f1/Heidelberg_IndPD_Fig7.png" caption="<b>Figure 5: Indigoidine Production by Modified Variants of IndC</b> |
| - | + | We replaced the indC T-domain with both the T-domains of other native NRPS modules (entF, delH, tycC, tycA, bpsA, plu2642 and plu2670) and synthetic T-domains. The figure shows the five modified versions of indC that remain the enzyme function, thus resulting in a blue phenotype of transformed ''E. coli'' TOP10. The cells have been co-transformed with a plasmid containing the respective engineered variant of indC and a second plasmid coding for the PPTase sfp, svp, entD and delC. The figure shows representative results; all transformants of this first experiment can be seen in Fig. 4. | |
| - | most common used prediction tools is Pfam which we used as a starting point to determine the best | + | ">Fig. 5</a>, T-boundaries from "B" to "2"). Using these domain boundaries for the native T-domains did only yield one functional native T-domain (<a class="fancybox fancyGraphical" href="https://static.igem.org/mediawiki/2013/f/f1/Heidelberg_IndPD_Fig7.png" caption="<b>Figure 5: Indigoidine Production by Modified Variants of IndC</b> |
| - | + | We replaced the indC T-domain with both the T-domains of other native NRPS modules (entF, delH, tycC, tycA, bpsA, plu2642 and plu2670) and synthetic T-domains. The figure shows the five modified versions of indC that remain the enzyme function, thus resulting in a blue phenotype of transformed ''E. coli'' TOP10. The cells have been co-transformed with a plasmid containing the respective engineered variant of indC and a second plasmid coding for the PPTase sfp, svp, entD and delC. The figure shows representative results; all transformants of this first experiment can be seen in Fig. 4. | |
| - | method for defining domain boundaries. Pfam predicted large linker structures between the end of the A- | + | |
| - | + | ||
| - | and the beginning of the T-domain (compare <a class="fancybox fancyGraphical" | + | |
| - | + | ||
| - | href="https://static.igem.org/mediawiki/2013/f/f1/Heidelberg_IndPD_Fig7.png" caption="<b>Figure 5: | + | |
| - | + | ||
| - | Indigoidine Production by Modified Variants of IndC</b> | + | |
| - | We replaced the indC T-domain with both the T-domains of other native NRPS modules (entF, delH, | + | |
| - | + | ||
| - | tycC, tycA, bpsA, plu2642 and plu2670) and synthetic T-domains. The figure shows the five modified | + | |
| - | + | ||
| - | versions of indC that remain the enzyme function, thus resulting in a blue phenotype of transformed | + | |
| - | + | ||
| - | ''E. coli'' TOP10. The cells have been co-transformed with a plasmid containing the respective | + | |
| - | + | ||
| - | engineered variant of indC and a second plasmid coding for the PPTase sfp, svp, entD and delC. The | + | |
| - | + | ||
| - | figure shows representative results; all transformants of this first experiment can be seen in Fig. 4. | + | |
| - | ">Fig. 5</a>, T-boundaries from "B" to "2"). Using these domain boundaries for the native T-domains did | + | |
| - | + | ||
| - | only yield one functional native T-domain (<a class="fancybox fancyGraphical" | + | |
| - | + | ||
| - | href="https://static.igem.org/mediawiki/2013/f/f1/Heidelberg_IndPD_Fig7.png" caption="<b>Figure 5: | + | |
| - | + | ||
| - | Indigoidine Production by Modified Variants of IndC</b> | + | |
| - | We replaced the indC T-domain with both the T-domains of other native NRPS modules (entF, delH, | + | |
| - | + | ||
| - | tycC, tycA, bpsA, plu2642 and plu2670) and synthetic T-domains. The figure shows the five modified | + | |
| - | + | ||
| - | versions of indC that remain the enzyme function, thus resulting in a blue phenotype of transformed | + | |
| - | + | ||
| - | ''E. coli'' TOP10. The cells have been co-transformed with a plasmid containing the respective | + | |
| - | + | ||
| - | engineered variant of indC and a second plasmid coding for the PPTase sfp, svp, entD and delC. The | + | |
| - | + | ||
| - | figure shows representative results; all transformants of this first experiment can be seen in Fig. 4. | + | |
">Fig. 5</a>, plu2642). | ">Fig. 5</a>, plu2642). | ||
| - | We tried to improve this yield by defining new T-domain boundaries based on the predictions of Pfam and | + | We tried to improve this yield by defining new T-domain boundaries based on the predictions of Pfam and multiple sequence alignments (MSA) with the respective homology libraries at the predicted linker regions. Boundaries were set closer to the preceeding A-domain, at regions were less sequence conservation was observed. <a class="fancybox fancyGraphical" href="https://static.igem.org/mediawiki/2013/e/eb/Heidelberg_IndPD_Fig8.png" caption="<b>Figure 6: Determination of required domain borders for T-domain exchange</b> |
| - | + | ||
| - | multiple sequence alignments (MSA) with the respective homology libraries at the predicted linker | + | |
| - | + | ||
| - | regions. Boundaries were set closer to the preceeding A-domain, at regions were less sequence | + | |
| - | + | ||
| - | conservation was observed. <a class="fancybox fancyGraphical" | + | |
| - | + | ||
| - | href="https://static.igem.org/mediawiki/2013/e/eb/Heidelberg_IndPD_Fig8.png" caption="<b>Figure 6: | + | |
| - | + | ||
| - | Determination of required domain borders for T-domain exchange</b> | + | |
<b>a)</b> Definition of different domain border combinations for T-domain exchanges | <b>a)</b> Definition of different domain border combinations for T-domain exchanges | ||
The figure shows a sequence alignment of the indC and bpsA amino acid sequences. | The figure shows a sequence alignment of the indC and bpsA amino acid sequences. | ||
| Line 1,037: | Line 321: | ||
plasmid coding for the PPTase Sfp shows that only three domain border combinations can be | plasmid coding for the PPTase Sfp shows that only three domain border combinations can be | ||
used for exchanging the indC T-domain with the T-domain of bpsA. These are the | used for exchanging the indC T-domain with the T-domain of bpsA. These are the | ||
| - | combinations A1, A2 and C1. We applied combination A2 for further T-domain exchanges. ">Fig. 6</a> | + | combinations A1, A2 and C1. We applied combination A2 for further T-domain exchanges. ">Fig. 6</a> shows the indigoidine production after insertion of native T-domains with revised boundaries. T-domain boundary combinations A1, A2 and C1 yielded functional T-domains. As the indigoidine production and cell growth was best for the T-domains created with boundary combination A2, this boundary design was used for all subsequent cloning strategies. |
| - | + | ||
| - | shows the indigoidine production after insertion of native T-domains with revised boundaries. T-domain | + | |
| - | + | ||
| - | boundary combinations A1, A2 and C1 yielded functional T-domains. As the indigoidine production and | + | |
| - | + | ||
| - | cell growth was best for the T-domains created with boundary combination A2, this boundary design was | + | |
| - | + | ||
| - | used for all subsequent cloning strategies. | + | |
</p> | </p> | ||
<br/> | <br/> | ||
<center> | <center> | ||
| - | <a class="fancybox fancyGraphical" | + | <a class="fancybox fancyGraphical" href="https://static.igem.org/mediawiki/2013/e/eb/Heidelberg_IndPD_Fig8.png" caption="<b>Figure 6: Determination of required domain borders for T-domain exchange</b> |
| - | + | ||
| - | href="https://static.igem.org/mediawiki/2013/e/eb/Heidelberg_IndPD_Fig8.png" caption="<b>Figure 6: | + | |
| - | + | ||
| - | Determination of required domain borders for T-domain exchange</b> | + | |
<b>a)</b> Definition of different domain border combinations for T-domain exchanges | <b>a)</b> Definition of different domain border combinations for T-domain exchanges | ||
The figure shows a sequence alignment of the indC and bpsA amino acid sequences. | The figure shows a sequence alignment of the indC and bpsA amino acid sequences. | ||
| Line 1,067: | Line 339: | ||
used for exchanging the indC T-domain with the T-domain of bpsA. These are the | used for exchanging the indC T-domain with the T-domain of bpsA. These are the | ||
combinations A1, A2 and C1. We applied combination A2 for further T-domain exchanges. "> | combinations A1, A2 and C1. We applied combination A2 for further T-domain exchanges. "> | ||
| - | <img style="width:40%; align:center; margin-bottom:10px; padding:1%;border-style:solid;border- | + | <img style="width:40%; align:center; margin-bottom:10px; padding:1%;border-style:solid;border-width:1px;border-radius: 5px;" src="https://static.igem.org/mediawiki/2013/e/eb/Heidelberg_IndPD_Fig8.png"></img> |
| - | + | <figcaption style="width:80%;"><b>Figure 6: Determination of required domain borders for T-domain exchange</b> | |
| - | width:1px;border-radius: 5px;" | + | |
| - | + | ||
| - | src="https://static.igem.org/mediawiki/2013/e/eb/Heidelberg_IndPD_Fig8.png"></img> | + | |
| - | <figcaption style="width:80%;"><b>Figure 6: Determination of required domain borders for T-domain | + | |
| - | + | ||
| - | exchange</b> | + | |
<b>a)</b> Definition of different domain border combinations for T-domain exchanges | <b>a)</b> Definition of different domain border combinations for T-domain exchanges | ||
The figure shows a sequence alignment of the indC and bpsA amino acid sequences. | The figure shows a sequence alignment of the indC and bpsA amino acid sequences. | ||
| Line 1,094: | Line 360: | ||
<p> | <p> | ||
| - | <a class="fancybox fancyGraphical" | + | <a class="fancybox fancyGraphical" href="https://static.igem.org/mediawiki/2013/6/6e/Heidelberg_IndPD_Fig9.png" caption="<b>Figure 7: Applying optimized domain border combinations by T-domain exchange of native NRPS T-domains</b> |
| - | + | As described above, we determined an optimized domain border combination for the exchange of the native indC T-domain with the T-domain of the indigoidine synthetase bpsA. We applied this border combination (previously referred to as ''A2'') to the T-domains of the NRPS modules entF, delH4, delH5, tycA1, tycC6, plu2642 and plu2670, replacing the indC T-domain with the respective fragments of those modules. This figure shows three transformants with a blue phenotype in which the indC T-domain was exchanged by the T-domain of the respective NRPS module. The pictures were taken after 60 hours of incubation at room temperature. Once more one can see the differences in growth kinetics due to the production of indigoidine: Cells expressing the indC variant with the T-domain of bpsA grow very slow and form small and dark blue colonies, whereas cells expressing other variants grow faster. Comparing the images on the very right, we suggest that cells expressing indC with the T-domain of plu2642 produce the most indigoidine in the given timeframe, compared to both the delH4- and the bpsA-variant. The combination of the plu2642 T-domain and the indC indigoidine synthetase seems to be ideal, concerning both indigoidine production and overall growth.">Fig. 7</a> | |
| - | href="https://static.igem.org/mediawiki/2013/6/6e/Heidelberg_IndPD_Fig9.png" caption="<b>Figure 7: Applying | + | depicts the success of this boundary desgin as two additional native T-domains derived from delH4 and bpsA (indigoidine synthetase) led to functional indCs and the production of indigoidine. In addition, the native T-domain from plu2642 which was already shown to be functional (compare <a class="fancybox fancyGraphical" href="https://static.igem.org/mediawiki/2013/c/cf/Heidelberg_IndPD_Fig6.png" caption="<b>Figure 3: Comparison between different <em>E. coli</em> strains and PPTases:</b> |
| - | + | <b>a)</b> Comparison of different <em>E. coli</em> strains examining growth and indigoidine production | |
| - | optimized domain border combinations by T-domain exchange of native NRPS T-domains</b> | + | The figure shows five different strains of <em>E. coli</em> that have been co-transformed with an indC expression plasmid and a sfp expression plasmid. The negative control is <em>E. coli</em> TOP10 without a plasmid. All transformants have been grown on LB agar for 48 hours at room temperature, cells were not induced. One can see that even without induction all strains express the indigoidine synthetase and produce the blue pigment indigoidine. However, the strains BAP1 and NEB Turbo grow faster in the first day, exhibiting a white phenotype (data not shown). Colonies on the plate of <em>E. coli</em> TOP10 are very small and dark blue/ black. Assuming that indigoidine production inhibits cell growth due to its toxicity, we concluded that TOP10 produced the most indigoidine among the strains we tested. We used <em>E. coli</em> TOP10 for the following experiments. |
| - | As described above, we determined an optimized domain border combination for the exchange of the | + | |
| - | + | ||
| - | native indC T-domain with the T-domain of the indigoidine synthetase bpsA. We applied this border | + | |
| - | + | ||
| - | combination (previously referred to as ''A2'') to the T-domains of the NRPS modules entF, delH4, delH5, | + | |
| - | + | ||
| - | tycA1, tycC6, plu2642 and plu2670, replacing the indC T-domain with the respective fragments of those | + | |
| - | + | ||
| - | modules. This figure shows three transformants with a blue phenotype in which the indC T-domain was | + | |
| - | + | ||
| - | exchanged by the T-domain of the respective NRPS module. The pictures were taken after 60 hours of | + | |
| - | + | ||
| - | incubation at room temperature. Once more one can see the differences in growth kinetics due to the | + | |
| - | + | ||
| - | production of indigoidine: Cells expressing the indC variant with the T-domain of bpsA grow very slow | + | |
| - | + | ||
| - | and form small and dark blue colonies, whereas cells expressing other variants grow faster. Comparing | + | |
| - | + | ||
| - | the images on the very right, we suggest that cells expressing indC with the T-domain of plu2642 | + | |
| - | + | ||
| - | produce the most indigoidine in the given timeframe, compared to both the delH4- and the bpsA-variant. | + | |
| - | + | ||
| - | The combination of the plu2642 T-domain and the indC indigoidine synthetase seems to be ideal, | + | |
| - | + | ||
| - | concerning both indigoidine production and overall growth.">Fig. 7</a> | + | |
| - | depicts the success of this boundary desgin as two additional native T-domains derived from delH4 and | + | |
| - | + | ||
| - | bpsA (indigoidine synthetase) led to functional indCs and the production of indigoidine. In addition, | + | |
| - | + | ||
| - | the native T-domain from plu2642 which was already shown to be functional (compare <a class="fancybox | + | |
| - | + | ||
| - | fancyGraphical" href="https://static.igem.org/mediawiki/2013/c/cf/Heidelberg_IndPD_Fig6.png" | + | |
| - | + | ||
| - | caption="<b>Figure 3: Comparison between different <em>E. coli</em> strains and PPTases:</b> | + | |
| - | <b>a)</b> Comparison of different <em>E. coli</em> strains examining growth and indigoidine | + | |
| - | + | ||
| - | production | + | |
| - | The figure shows five different strains of <em>E. coli</em> that have been co-transformed with an indC | + | |
| - | + | ||
| - | expression plasmid and a sfp expression plasmid. The negative control is <em>E. coli</em> TOP10 without | + | |
| - | + | ||
| - | a plasmid. All transformants have been grown on LB agar for 48 hours at room temperature, cells were | + | |
| - | + | ||
| - | not induced. One can see that even without induction all strains express the indigoidine synthetase and | + | |
| - | + | ||
| - | produce the blue pigment indigoidine. However, the strains BAP1 and NEB Turbo grow faster in the first | + | |
| - | + | ||
| - | day, exhibiting a white phenotype (data not shown). Colonies on the plate of <em>E. coli</em> TOP10 | + | |
| - | + | ||
| - | are very small and dark blue/ black. Assuming that indigoidine production inhibits cell growth due to | + | |
| - | + | ||
| - | its toxicity, we concluded that TOP10 produced the most indigoidine among the strains we tested. We | + | |
| - | + | ||
| - | used <em>E. coli</em> TOP10 for the following experiments. | + | |
<b>b)</b> Comparison between different PPTases concerning overall indigoidine production | <b>b)</b> Comparison between different PPTases concerning overall indigoidine production | ||
| - | The Figure shows ''E. coli'' TOP10 cells co-transformed with indC and four different PPTases (sfp, svp, | + | The Figure shows ''E. coli'' TOP10 cells co-transformed with indC and four different PPTases (sfp, svp, entD and delC), respectively. The image bottom left shows ''E. coli'' TOP10 cells without additional PPTase and the negative control is TOP10 without a plasmid. |
| - | + | ||
| - | entD and delC), respectively. The image bottom left shows ''E. coli'' TOP10 cells without additional | + | |
| - | + | ||
| - | PPTase and the negative control is TOP10 without a plasmid. | + | |
">Fig. 3b</a> | ">Fig. 3b</a> | ||
| - | ) showed faster and increased indigoidine production (deep blue agar plate, lower right panel on <a | + | ) showed faster and increased indigoidine production (deep blue agar plate, lower right panel on <a class="fancybox fancyGraphical" href="https://static.igem.org/mediawiki/2013/6/6e/Heidelberg_IndPD_Fig9.png" caption="<b>Figure 7: Applying optimized domain border combinations by T-domain exchange of native NRPS T-domains</b> |
| - | + | As described above, we determined an optimized domain border combination for the exchange of the native indC T-domain with the T-domain of the indigoidine synthetase bpsA. We applied this border combination (previously referred to as ''A2'') to the T-domains of the NRPS modules entF, delH4, delH5, tycA1, tycC6, plu2642 and plu2670, replacing the indC T-domain with the respective fragments of those modules. This figure shows three transformants with a blue phenotype in which the indC T-domain was exchanged by the T-domain of the respective NRPS module. The pictures were taken after 60 hours of incubation at room temperature. Once more one can see the differences in growth kinetics due to the production of indigoidine: Cells expressing the indC variant with the T-domain of bpsA grow very slow and form small and dark blue colonies, whereas cells expressing other variants grow faster. Comparing the images on the very right, we suggest that cells expressing indC with the T-domain of plu2642 produce the most indigoidine in the given timeframe, compared to both the delH4- and the bpsA-variant. The combination of the plu2642 T-domain and the indC indigoidine synthetase seems to be ideal, concerning both indigoidine production and overall growth.">Fig. 7</a> | |
| - | class="fancybox fancyGraphical" href="https://static.igem.org/mediawiki/2013/6/6e/Heidelberg_IndPD_Fig9.png" | + | ). The results obtained from this experiments proofed two concepts: First, domain shuffling is possible across different species as the T-domains of delH4 and bpsA were derived from <i>D. acidovorans</i> and <i>S. lavendulae lavendulae</i>, respectively and were functional in <i>E. coli</i>. Also, shuffling of domains from modules of different substrate specificity has been proofen herein. Second, manually adjusting the boundaries predicted by Pfam based on MSA is a functional method to predict functional T-domain boundaries. |
| - | + | ||
| - | caption="<b>Figure 7: Applying optimized domain border combinations by T-domain exchange of native NRPS | + | |
| - | + | ||
| - | T-domains</b> | + | |
| - | As described above, we determined an optimized domain border combination for the exchange of the | + | |
| - | + | ||
| - | native indC T-domain with the T-domain of the indigoidine synthetase bpsA. We applied this border | + | |
| - | + | ||
| - | combination (previously referred to as ''A2'') to the T-domains of the NRPS modules entF, delH4, delH5, | + | |
| - | + | ||
| - | tycA1, tycC6, plu2642 and plu2670, replacing the indC T-domain with the respective fragments of those | + | |
| - | + | ||
| - | modules. This figure shows three transformants with a blue phenotype in which the indC T-domain was | + | |
| - | + | ||
| - | exchanged by the T-domain of the respective NRPS module. The pictures were taken after 60 hours of | + | |
| - | + | ||
| - | incubation at room temperature. Once more one can see the differences in growth kinetics due to the | + | |
| - | + | ||
| - | production of indigoidine: Cells expressing the indC variant with the T-domain of bpsA grow very slow | + | |
| - | + | ||
| - | and form small and dark blue colonies, whereas cells expressing other variants grow faster. Comparing | + | |
| - | + | ||
| - | the images on the very right, we suggest that cells expressing indC with the T-domain of plu2642 | + | |
| - | + | ||
| - | produce the most indigoidine in the given timeframe, compared to both the delH4- and the bpsA-variant. | + | |
| - | + | ||
| - | The combination of the plu2642 T-domain and the indC indigoidine synthetase seems to be ideal, | + | |
| - | + | ||
| - | concerning both indigoidine production and overall growth.">Fig. 7</a> | + | |
| - | ). The results obtained from this experiments proofed two concepts: First, domain shuffling is possible | + | |
| - | + | ||
| - | across different species as the T-domains of delH4 and bpsA were derived from <i>D. acidovorans</i> and | + | |
| - | + | ||
| - | <i>S. lavendulae lavendulae</i>, respectively and were functional in <i>E. coli</i>. Also, shuffling of | + | |
| - | + | ||
| - | domains from modules of different substrate specificity has been proofen herein. Second, manually | + | |
| - | + | ||
| - | adjusting the boundaries predicted by Pfam based on MSA is a functional method to predict functional | + | |
| - | + | ||
| - | T-domain boundaries. | + | |
</p> | </p> | ||
<br/> | <br/> | ||
<center> | <center> | ||
| - | <a class="fancybox fancyGraphical" | + | <a class="fancybox fancyGraphical" href="https://static.igem.org/mediawiki/2013/6/6e/Heidelberg_IndPD_Fig9.png" caption="<b>Figure 7: Applying optimized domain border combinations by T-domain exchange of native NRPS T-domains</b> |
| - | + | As described above, we determined an optimized domain border combination for the exchange of the native indC T-domain with the T-domain of the indigoidine synthetase bpsA. We applied this border combination (previously referred to as ''A2'') to the T-domains of the NRPS modules entF, delH4, delH5, tycA1, tycC6, plu2642 and plu2670, replacing the indC T-domain with the respective fragments of those modules. This figure shows three transformants with a blue phenotype in which the indC T-domain was exchanged by the T-domain of the respective NRPS module. The pictures were taken after 60 hours of incubation at room temperature. Once more one can see the differences in growth kinetics due to the production of indigoidine: Cells expressing the indC variant with the T-domain of bpsA grow very slow and form small and dark blue colonies, whereas cells expressing other variants grow faster. Comparing the images on the very right, we suggest that cells expressing indC with the T-domain of plu2642 produce the most indigoidine in the given timeframe, compared to both the delH4- and the bpsA-variant. The combination of the plu2642 T-domain and the indC indigoidine synthetase seems to be ideal, concerning both indigoidine production and overall growth."> | |
| - | href="https://static.igem.org/mediawiki/2013/6/6e/Heidelberg_IndPD_Fig9.png" caption="<b>Figure 7: Applying | + | <img style="width:50%; margin-bottom:10px; padding:1%;border-style:solid;border-width:1px;border-radius: 5px;" src="https://static.igem.org/mediawiki/2013/6/6e/Heidelberg_IndPD_Fig9.png"></img> |
| - | + | <figcaption style="width:80%;"><b>Figure 7: Applying optimized domain border combinations by T-domain exchange of native NRPS T-domains</b> | |
| - | optimized domain border combinations by T-domain exchange of native NRPS T-domains</b> | + | As described above, we determined an optimized domain border combination for the exchange of the native indC T-domain with the T-domain of the indigoidine synthetase bpsA. We applied this border combination (previously referred to as ''A2'') to the T-domains of the NRPS modules entF, delH4, delH5, tycA1, tycC6, plu2642 and plu2670, replacing the indC T-domain with the respective fragments of those modules. This figure shows three transformants with a blue phenotype in which the indC T-domain was exchanged by the T-domain of the respective NRPS module. The pictures were taken after 60 hours of incubation at room temperature. Once more one can see the differences in growth kinetics due to the production of indigoidine: Cells expressing the indC variant with the T-domain of bpsA grow very slow and form small and dark blue colonies, whereas cells expressing other variants grow faster. Comparing the images on the very right, we suggest that cells expressing indC with the T-domain of plu2642 produce the most indigoidine in the given timeframe, compared to both the delH4- and the bpsA-variant. The combination of the plu2642 T-domain and the indC indigoidine synthetase seems to be ideal, concerning both indigoidine production and overall growth. |
| - | As described above, we determined an optimized domain border combination for the exchange of the | + | |
| - | + | ||
| - | native indC T-domain with the T-domain of the indigoidine synthetase bpsA. We applied this border | + | |
| - | + | ||
| - | combination (previously referred to as ''A2'') to the T-domains of the NRPS modules entF, delH4, delH5, | + | |
| - | + | ||
| - | tycA1, tycC6, plu2642 and plu2670, replacing the indC T-domain with the respective fragments of those | + | |
| - | + | ||
| - | modules. This figure shows three transformants with a blue phenotype in which the indC T-domain was | + | |
| - | + | ||
| - | exchanged by the T-domain of the respective NRPS module. The pictures were taken after 60 hours of | + | |
| - | + | ||
| - | incubation at room temperature. Once more one can see the differences in growth kinetics due to the | + | |
| - | + | ||
| - | production of indigoidine: Cells expressing the indC variant with the T-domain of bpsA grow very slow | + | |
| - | + | ||
| - | and form small and dark blue colonies, whereas cells expressing other variants grow faster. Comparing | + | |
| - | + | ||
| - | the images on the very right, we suggest that cells expressing indC with the T-domain of plu2642 | + | |
| - | + | ||
| - | produce the most indigoidine in the given timeframe, compared to both the delH4- and the bpsA-variant. | + | |
| - | + | ||
| - | The combination of the plu2642 T-domain and the indC indigoidine synthetase seems to be ideal, | + | |
| - | + | ||
| - | concerning both indigoidine production and overall growth."> | + | |
| - | <img style="width:50%; margin-bottom:10px; padding:1%;border-style:solid;border-width:1px;border- | + | |
| - | + | ||
| - | radius: 5px;" src="https://static.igem.org/mediawiki/2013/6/6e/Heidelberg_IndPD_Fig9.png"></img> | + | |
| - | <figcaption style="width:80%;"><b>Figure 7: Applying optimized domain border combinations by T- | + | |
| - | + | ||
| - | domain exchange of native NRPS T-domains</b> | + | |
| - | As described above, we determined an optimized domain border combination for the exchange of the | + | |
| - | + | ||
| - | native indC T-domain with the T-domain of the indigoidine synthetase bpsA. We applied this border | + | |
| - | + | ||
| - | combination (previously referred to as ''A2'') to the T-domains of the NRPS modules entF, delH4, delH5, | + | |
| - | + | ||
| - | tycA1, tycC6, plu2642 and plu2670, replacing the indC T-domain with the respective fragments of those | + | |
| - | + | ||
| - | modules. This figure shows three transformants with a blue phenotype in which the indC T-domain was | + | |
| - | + | ||
| - | exchanged by the T-domain of the respective NRPS module. The pictures were taken after 60 hours of | + | |
| - | + | ||
| - | incubation at room temperature. Once more one can see the differences in growth kinetics due to the | + | |
| - | + | ||
| - | production of indigoidine: Cells expressing the indC variant with the T-domain of bpsA grow very slow | + | |
| - | + | ||
| - | and form small and dark blue colonies, whereas cells expressing other variants grow faster. Comparing | + | |
| - | + | ||
| - | the images on the very right, we suggest that cells expressing indC with the T-domain of plu2642 | + | |
| - | + | ||
| - | produce the most indigoidine in the given timeframe, compared to both the delH4- and the bpsA-variant. | + | |
| - | + | ||
| - | The combination of the plu2642 T-domain and the indC indigoidine synthetase seems to be ideal, | + | |
| - | + | ||
| - | concerning both indigoidine production and overall growth. | + | |
</figcaption> | </figcaption> | ||
</a> | </a> | ||
| Line 1,275: | Line 387: | ||
<h3>PPTase and T-domain Interaction Strongly Influence the Yield of Indigoidine Production</h3> | <h3>PPTase and T-domain Interaction Strongly Influence the Yield of Indigoidine Production</h3> | ||
<p> | <p> | ||
| - | As the previous experiments of shuffled T-domains and different combinations of PPTases showed, there | + | As the previous experiments of shuffled T-domains and different combinations of PPTases showed, there are substantial differences in cell growth and indigoidine production when observed on plates. However, this observations were always of qualitative nature and did not give any insight into quantitative differences. We approached the quantification of indigoidine production in a time-resolved and highly-combinatorial manner: plasmids coding for indC containing all synthetic (4) and native T-domains (3) proven functional by the previous assays were co-transformed with the four functional PPTases. |
| - | |||
| - | + | The indigoidine production over time (30 hours) was measured at its absorption maximum of 590 nm and corrected for the contribution of the cellular components in the medium as described in the methods. As <a class="fancybox fancyGraphical" href="https://static.igem.org/mediawiki/2013/4/4d/Heidelberg_IndPD_Fig10.png" caption="<b>Figure 8: Indigoidine Production Depend on Combination of T-domain and PPTase</b> | |
| - | + | The absorption spectrum of liquid cultures expressing engineered variants of the indC indigoidine synthetase were measured for 30 hours. The graphs show the OD590 of indigoidine in <i>E. coli</i> liquid cultures over time. The absorption of the cell suspension has been subtracted (see OD Measurement in the Methods section). The left diagram shows the indigoidine production over time of a liquid culture expressing an engineered indigoidine synthetase with the synthetic T-domain #1 (synT1) and a PPTase, whereas each graph refers to a specific PPTase coexpressed. The diagram on the right shows the corresponding data for the indigoidine synthetase with the synthetic T-domain #3 (synT3). | |
| - | + | The indigoidine production correlates to the combination of a T-domain with a respective PPTase and the PPTases vary in their ability to activate T-domains. For example, DelC is unable to activate synT 1 but activates synT3, whereas svp activates synT1 but is unable to activate synT3. Note also, that activation of synT3 by EntD results in the highest amount of indigoidine production among all the combinations shown.">Fig. 8</a> | |
| - | + | shows, synthetic T-domains in combination with different PPTases lead to distinct differneces in indogoidin production. | |
| - | + | ||
| - | + | ||
| - | + | ||
| - | + | ||
| - | + | ||
| - | The indigoidine production over time (30 hours) was measured at its absorption maximum of 590 nm and | + | |
| - | + | ||
| - | corrected for the contribution of the cellular components in the medium as described in the methods. As | + | |
| - | + | ||
| - | <a class="fancybox fancyGraphical" | + | |
| - | + | ||
| - | href="https://static.igem.org/mediawiki/2013/4/4d/Heidelberg_IndPD_Fig10.png" caption="<b>Figure 8: | + | |
| - | + | ||
| - | Indigoidine Production Depend on Combination of T-domain and PPTase</b> | + | |
| - | The absorption spectrum of liquid cultures expressing engineered variants of the indC indigoidine | + | |
| - | + | ||
| - | synthetase were measured for 30 hours. The graphs show the OD590 of indigoidine in <i>E. coli</i> | + | |
| - | + | ||
| - | liquid cultures over time. The absorption of the cell suspension has been subtracted (see OD | + | |
| - | + | ||
| - | Measurement in the Methods section). The left diagram shows the indigoidine production over time of a | + | |
| - | + | ||
| - | liquid culture expressing an engineered indigoidine synthetase with the synthetic T-domain #1 (synT1) | + | |
| - | + | ||
| - | and a PPTase, whereas each graph refers to a specific PPTase coexpressed. The diagram on the right | + | |
| - | + | ||
| - | shows the corresponding data for the indigoidine synthetase with the synthetic T-domain #3 (synT3). | + | |
| - | The indigoidine production correlates to the combination of a T-domain with a respective PPTase and the | + | |
| - | + | ||
| - | PPTases vary in their ability to activate T-domains. For example, DelC is unable to activate synT 1 but | + | |
| - | + | ||
| - | activates synT3, whereas svp activates synT1 but is unable to activate synT3. Note also, that | + | |
| - | + | ||
| - | activation of synT3 by EntD results in the highest amount of indigoidine production among all the | + | |
| - | + | ||
| - | combinations shown.">Fig. 8</a> | + | |
| - | shows, synthetic T-domains in combination with different PPTases lead to distinct differneces in | + | |
| - | + | ||
| - | indogoidin production. | + | |
</p> | </p> | ||
<br/> | <br/> | ||
<center> | <center> | ||
| - | <a class="fancybox fancyGraphical" | + | <a class="fancybox fancyGraphical" href="https://static.igem.org/mediawiki/2013/4/4d/Heidelberg_IndPD_Fig10.png" caption="<b>Figure 8: Indigoidine Production Depend on Combination of T-domain and PPTase</b> |
| - | + | The absorption spectrum of liquid cultures expressing engineered variants of the indC indigoidine synthetase were measured for 30 hours. The graphs show the OD590 of indigoidine in <i>E. coli</i> liquid cultures over time. The absorption of the cell suspension has been subtracted (see OD Measurement in the Methods section). The left diagram shows the indigoidine production over time of a liquid culture expressing an engineered indigoidine synthetase with the synthetic T-domain #1 (synT1) and a PPTase, whereas each graph refers to a specific PPTase coexpressed. The diagram on the right shows the corresponding data for the indigoidine synthetase with the synthetic T-domain #3 (synT3). | |
| - | href="https://static.igem.org/mediawiki/2013/4/4d/Heidelberg_IndPD_Fig10.png" caption="<b>Figure 8: | + | The indigoidine production correlates to the combination of a T-domain with a respective PPTase and the PPTases vary in their ability to activate T-domains. For example, DelC is unable to activate synT 1 but activates synT3, whereas svp activates synT1 but is unable to activate synT3. Note also, that activation of synT3 by EntD results in the highest amount of indigoidine production among all the combinations shown."> |
| - | + | <img style="width:90%; margin-bottom:10px; padding:1%;border-style:solid;border-width:1px;border-radius: 5px;" src="https://static.igem.org/mediawiki/2013/4/4d/Heidelberg_IndPD_Fig10.png"></img> | |
| - | Indigoidine Production Depend on Combination of T-domain and PPTase</b> | + | <figcaption style="width:90%;"><b>Figure 8: Indigoidine Production Depend on Combination of T-domain and PPTase</b> |
| - | The absorption spectrum of liquid cultures expressing engineered variants of the indC indigoidine | + | The absorption spectrum of liquid cultures expressing engineered variants of the indC indigoidine synthetase were measured for 30 hours. The graphs show the OD590 of indigoidine in <i>E. coli</i> liquid cultures over time. The absorption of the cell suspension has been subtracted (see OD Measurement in the Methods section). The left diagram shows the indigoidine production over time of a liquid culture expressing an engineered indigoidine synthetase with the synthetic T-domain #1 (synT1) and a PPTase, whereas each graph refers to a specific PPTase coexpressed. The diagram on the right shows the corresponding data for the indigoidine synthetase with the synthetic T-domain #3 (synT3). |
| - | + | The indigoidine production correlates to the combination of a T-domain with a respective PPTase and the PPTases vary in their ability to activate T-domains. For example, DelC is unable to activate synT 1 but activates synT3, whereas svp activates synT1 but is unable to activate synT3. Note also, that activation of synT3 by EntD results in the highest amount of indigoidine production among all the combinations shown. | |
| - | synthetase were measured for 30 hours. The graphs show the OD590 of indigoidine in <i>E. coli</i> | + | |
| - | + | ||
| - | liquid cultures over time. The absorption of the cell suspension has been subtracted (see OD | + | |
| - | + | ||
| - | Measurement in the Methods section). The left diagram shows the indigoidine production over time of a | + | |
| - | + | ||
| - | liquid culture expressing an engineered indigoidine synthetase with the synthetic T-domain #1 (synT1) | + | |
| - | + | ||
| - | and a PPTase, whereas each graph refers to a specific PPTase coexpressed. The diagram on the right | + | |
| - | + | ||
| - | shows the corresponding data for the indigoidine synthetase with the synthetic T-domain #3 (synT3). | + | |
| - | The indigoidine production correlates to the combination of a T-domain with a respective PPTase and the | + | |
| - | + | ||
| - | PPTases vary in their ability to activate T-domains. For example, DelC is unable to activate synT 1 but | + | |
| - | + | ||
| - | activates synT3, whereas svp activates synT1 but is unable to activate synT3. Note also, that | + | |
| - | + | ||
| - | activation of synT3 by EntD results in the highest amount of indigoidine production among all the | + | |
| - | + | ||
| - | combinations shown."> | + | |
| - | <img style="width:90%; margin-bottom:10px; padding:1%;border-style:solid;border-width:1px;border- | + | |
| - | + | ||
| - | radius: 5px;" src="https://static.igem.org/mediawiki/2013/4/4d/Heidelberg_IndPD_Fig10.png"></img> | + | |
| - | <figcaption style="width:90%;"><b>Figure 8: Indigoidine Production Depend on Combination of T- | + | |
| - | + | ||
| - | domain and PPTase</b> | + | |
| - | The absorption spectrum of liquid cultures expressing engineered variants of the indC indigoidine | + | |
| - | + | ||
| - | synthetase were measured for 30 hours. The graphs show the OD590 of indigoidine in <i>E. coli</i> | + | |
| - | + | ||
| - | liquid cultures over time. The absorption of the cell suspension has been subtracted (see OD | + | |
| - | + | ||
| - | Measurement in the Methods section). The left diagram shows the indigoidine production over time of a | + | |
| - | + | ||
| - | liquid culture expressing an engineered indigoidine synthetase with the synthetic T-domain #1 (synT1) | + | |
| - | + | ||
| - | and a PPTase, whereas each graph refers to a specific PPTase coexpressed. The diagram on the right | + | |
| - | + | ||
| - | shows the corresponding data for the indigoidine synthetase with the synthetic T-domain #3 (synT3). | + | |
| - | The indigoidine production correlates to the combination of a T-domain with a respective PPTase and the | + | |
| - | + | ||
| - | PPTases vary in their ability to activate T-domains. For example, DelC is unable to activate synT 1 but | + | |
| - | + | ||
| - | activates synT3, whereas svp activates synT1 but is unable to activate synT3. Note also, that | + | |
| - | + | ||
| - | activation of synT3 by EntD results in the highest amount of indigoidine production among all the | + | |
| - | + | ||
| - | combinations shown. | + | |
</figcaption> | </figcaption> | ||
| Line 1,388: | Line 412: | ||
<br/><br/> | <br/><br/> | ||
<p> | <p> | ||
| - | As a comparison between the left and right panel of <a class="fancybox fancyGraphical" | + | As a comparison between the left and right panel of <a class="fancybox fancyGraphical" href="https://static.igem.org/mediawiki/2013/4/4d/Heidelberg_IndPD_Fig10.png" caption="<b>Figure 8: Indigoidine Production Depend on Combination of T-domain and PPTase</b> |
| - | + | The absorption spectrum of liquid cultures expressing engineered variants of the indC indigoidine synthetase were measured for 30 hours. The graphs show the OD590 of indigoidine in <i>E. coli</i> liquid cultures over time. The absorption of the cell suspension has been subtracted (see OD Measurement in the Methods section). The left diagram shows the indigoidine production over time of a liquid culture expressing an engineered indigoidine synthetase with the synthetic T-domain #1 (synT1) and a PPTase, whereas each graph refers to a specific PPTase coexpressed. The diagram on the right shows the corresponding data for the indigoidine synthetase with the synthetic T-domain #3 (synT3). | |
| - | href="https://static.igem.org/mediawiki/2013/4/4d/Heidelberg_IndPD_Fig10.png" caption="<b>Figure 8: | + | The indigoidine production correlates to the combination of a T-domain with a respective PPTase and the PPTases vary in their ability to activate T-domains. For example, DelC is unable to activate synT 1 but activates synT3, whereas svp activates synT1 but is unable to activate synT3. Note also, that activation of synT3 by EntD results in the highest amount of indigoidine production among all the combinations shown.">Fig. 8</a> |
| - | + | shows, PPTases working best with one T-domain might not lead to any indigoidine production when used with a indigoidine synthetase containing a different T-domain (<a class="fancybox fancyGraphical" href="https://static.igem.org/mediawiki/2013/4/4d/Heidelberg_IndPD_Fig10.png" caption="<b>Figure 8: Indigoidine Production Depend on Combination of T-domain and PPTase</b> | |
| - | Indigoidine Production Depend on Combination of T-domain and PPTase</b> | + | The absorption spectrum of liquid cultures expressing engineered variants of the indC indigoidine synthetase were measured for 30 hours. The graphs show the OD590 of indigoidine in <i>E. coli</i> liquid cultures over time. The absorption of the cell suspension has been subtracted (see OD Measurement in the Methods section). The left diagram shows the indigoidine production over time of a liquid culture expressing an engineered indigoidine synthetase with the synthetic T-domain #1 (synT1) and a PPTase, whereas each graph refers to a specific PPTase coexpressed. The diagram on the right shows the corresponding data for the indigoidine synthetase with the synthetic T-domain #3 (synT3). |
| - | The absorption spectrum of liquid cultures expressing engineered variants of the indC indigoidine | + | The indigoidine production correlates to the combination of a T-domain with a respective PPTase and the PPTases vary in their ability to activate T-domains. For example, DelC is unable to activate synT 1 but activates synT3, whereas svp activates synT1 but is unable to activate synT3. Note also, that activation of synT3 by EntD results in the highest amount of indigoidine production among all the combinations shown.">Fig. 8</a> |
| - | + | , pink line, delC). In addition, as distinctly visible in <a class="fancybox fancyGraphical" href="https://static.igem.org/mediawiki/2013/3/38/Heidelberg_IndPD_Fig11.png" caption="<b>Figure 9: Indigoidine Production Varies Among Engineered Indigoidine Synthetases.</b> | |
| - | synthetase were measured for 30 hours. The graphs show the OD590 of indigoidine in <i>E. coli</i> | + | The absorption spectrum of liquid cultures expressing engineered variants of the indC indigoidine synthetase were measured for 30 hours. The graphs show the OD590 of indigoidine in <i>E. coli</i> liquid cultures over time. The absorption of the cell suspension has been subtracted (see OD Measurement in the Methods section). The red graph relates to an <i>E. coli</i> TOP10 negative control, the green graph depicts the indigoidine production of an indC variant, in which the T-domain has been exchanged with our synthetic T-domain #3, whereas the blue graphs refers to synthetic T-domain #4. |
| - | + | The amount of indigoidine reaches a maximum before it drops again. This is due the instability of indigoidine, which is reduced to its fluorescent leuco-form under the influence of reducing agents, light and high temperature (Takahashi 2007). The local absorption maximum at 590 nm (keto-indigoidine) decreases after 15-25 hours, whereas the absorption maximum at 430 nm (leuco-indigoidine) increases (data not shown). Note that the maximum level of indigoidine differs among the engineered indigoidine synthetases.">Fig. 9</a> | |
| - | liquid cultures over time. The absorption of the cell suspension has been subtracted (see OD | + | , indigoidine production over time is not a strictly monoton function (blue line). After an indigoidin production peak at 16 hours, indigoidine production caused by indC containing the synthetic domain 4 decreases again. The indigoidin production in cells transformed with indC/synthetic T-domain 3 is still increasing. |
| - | + | ||
| - | Measurement in the Methods section). The left diagram shows the indigoidine production over time of a | + | |
| - | + | ||
| - | liquid culture expressing an engineered indigoidine synthetase with the synthetic T-domain #1 (synT1) | + | |
| - | + | ||
| - | and a PPTase, whereas each graph refers to a specific PPTase coexpressed. The diagram on the right | + | |
| - | + | ||
| - | shows the corresponding data for the indigoidine synthetase with the synthetic T-domain #3 (synT3). | + | |
| - | The indigoidine production correlates to the combination of a T-domain with a respective PPTase and the | + | |
| - | + | ||
| - | PPTases vary in their ability to activate T-domains. For example, DelC is unable to activate synT 1 but | + | |
| - | + | ||
| - | activates synT3, whereas svp activates synT1 but is unable to activate synT3. Note also, that | + | |
| - | + | ||
| - | activation of synT3 by EntD results in the highest amount of indigoidine production among all the | + | |
| - | + | ||
| - | combinations shown.">Fig. 8</a> | + | |
| - | shows, PPTases working best with one T-domain might not lead to any indigoidine production when used | + | |
| - | + | ||
| - | with a indigoidine synthetase containing a different T-domain (<a class="fancybox fancyGraphical" | + | |
| - | + | ||
| - | href="https://static.igem.org/mediawiki/2013/4/4d/Heidelberg_IndPD_Fig10.png" caption="<b>Figure 8: | + | |
| - | + | ||
| - | Indigoidine Production Depend on Combination of T-domain and PPTase</b> | + | |
| - | The absorption spectrum of liquid cultures expressing engineered variants of the indC indigoidine | + | |
| - | + | ||
| - | synthetase were measured for 30 hours. The graphs show the OD590 of indigoidine in <i>E. coli</i> | + | |
| - | + | ||
| - | liquid cultures over time. The absorption of the cell suspension has been subtracted (see OD | + | |
| - | + | ||
| - | Measurement in the Methods section). The left diagram shows the indigoidine production over time of a | + | |
| - | + | ||
| - | liquid culture expressing an engineered indigoidine synthetase with the synthetic T-domain #1 (synT1) | + | |
| - | + | ||
| - | and a PPTase, whereas each graph refers to a specific PPTase coexpressed. The diagram on the right | + | |
| - | + | ||
| - | shows the corresponding data for the indigoidine synthetase with the synthetic T-domain #3 (synT3). | + | |
| - | The indigoidine production correlates to the combination of a T-domain with a respective PPTase and the | + | |
| - | + | ||
| - | PPTases vary in their ability to activate T-domains. For example, DelC is unable to activate synT 1 but | + | |
| - | + | ||
| - | activates synT3, whereas svp activates synT1 but is unable to activate synT3. Note also, that | + | |
| - | + | ||
| - | activation of synT3 by EntD results in the highest amount of indigoidine production among all the | + | |
| - | + | ||
| - | combinations shown.">Fig. 8</a> | + | |
| - | , pink line, delC). In addition, as distinctly visible in <a class="fancybox fancyGraphical" | + | |
| - | + | ||
| - | href="https://static.igem.org/mediawiki/2013/3/38/Heidelberg_IndPD_Fig11.png" caption="<b>Figure 9: | + | |
| - | + | ||
| - | Indigoidine Production Varies Among Engineered Indigoidine Synthetases.</b> | + | |
| - | The absorption spectrum of liquid cultures expressing engineered variants of the indC indigoidine | + | |
| - | + | ||
| - | synthetase were measured for 30 hours. The graphs show the OD590 of indigoidine in <i>E. coli</i> | + | |
| - | + | ||
| - | liquid cultures over time. The absorption of the cell suspension has been subtracted (see OD | + | |
| - | + | ||
| - | Measurement in the Methods section). The red graph relates to an <i>E. coli</i> TOP10 negative control, | + | |
| - | + | ||
| - | the green graph depicts the indigoidine production of an indC variant, in which the T-domain has been | + | |
| - | + | ||
| - | exchanged with our synthetic T-domain #3, whereas the blue graphs refers to synthetic T-domain #4. | + | |
| - | The amount of indigoidine reaches a maximum before it drops again. This is due the instability of | + | |
| - | + | ||
| - | indigoidine, which is reduced to its fluorescent leuco-form under the influence of reducing agents, | + | |
| - | + | ||
| - | light and high temperature (Takahashi 2007). The local absorption maximum at 590 nm (keto-indigoidine) | + | |
| - | + | ||
| - | decreases after 15-25 hours, whereas the absorption maximum at 430 nm (leuco-indigoidine) increases | + | |
| - | + | ||
| - | (data not shown). Note that the maximum level of indigoidine differs among the engineered indigoidine | + | |
| - | + | ||
| - | synthetases.">Fig. 9</a> | + | |
| - | , indigoidine production over time is not a strictly monoton function (blue line). After an indigoidin | + | |
| - | + | ||
| - | production peak at 16 hours, indigoidine production caused by indC containing the synthetic domain 4 | + | |
| - | + | ||
| - | decreases again. The indigoidin production in cells transformed with indC/synthetic T-domain 3 is still | + | |
| - | + | ||
| - | increasing. | + | |
</p> | </p> | ||
<br/> | <br/> | ||
<center> | <center> | ||
| - | <a class="fancybox fancyGraphical" | + | <a class="fancybox fancyGraphical" href="https://static.igem.org/mediawiki/2013/3/38/Heidelberg_IndPD_Fig11.png" caption="<b>Figure 9: Indigoidine Production Varies Among Engineered Indigoidine Synthetases.</b> |
| - | + | The absorption spectrum of liquid cultures expressing engineered variants of the indC indigoidine synthetase were measured for 30 hours. The graphs show the OD590 of indigoidine in <i>E. coli</i> liquid cultures over time. The absorption of the cell suspension has been subtracted (see OD Measurement in the Methods section). The red graph relates to an <i>E. coli</i> TOP10 negative control, the green graph depicts the indigoidine production of an indC variant, in which the T-domain has been exchanged with our synthetic T-domain #3, whereas the blue graphs refers to synthetic T-domain #4. | |
| - | href="https://static.igem.org/mediawiki/2013/3/38/Heidelberg_IndPD_Fig11.png" caption="<b>Figure 9: | + | The amount of indigoidine reaches a maximum before it drops again. This is due the instability of indigoidine, which is reduced to its fluorescent leuco-form under the influence of reducing agents, light and high temperature (Takahashi 2007). The local absorption maximum at 590 nm (keto-indigoidine) decreases after 15-25 hours, whereas the absorption maximum at 430 nm (leuco-indigoidine) increases (data not shown). Note that the maximum level of indigoidine differs among the engineered indigoidine synthetases."> |
| - | + | <img style="width:50%; margin-bottom:10px; padding:1%;border-style:solid;border-width:1px;border-radius: 5px;" src="https://static.igem.org/mediawiki/2013/3/38/Heidelberg_IndPD_Fig11.png"></img> | |
| - | Indigoidine Production Varies Among Engineered Indigoidine Synthetases.</b> | + | <figcaption style="width:80%;"><b>Figure 9: Indigoidine Production Varies Among Engineered Indigoidine Synthetases.</b> |
| - | The absorption spectrum of liquid cultures expressing engineered variants of the indC indigoidine | + | The absorption spectrum of liquid cultures expressing engineered variants of the indC indigoidine synthetase were measured for 30 hours. The graphs show the OD590 of indigoidine in <i>E. coli</i> liquid cultures over time. The absorption of the cell suspension has been subtracted (see OD Measurement in the Methods section). The red graph relates to an <i>E. coli</i> TOP10 negative control, the green graph depicts the indigoidine production of an indC variant, in which the T-domain has been exchanged with our synthetic T-domain #3, whereas the blue graphs refers to synthetic T-domain #4. |
| - | + | The amount of indigoidine reaches a maximum before it drops again. This is due the instability of indigoidine, which is reduced to its fluorescent leuco-form under the influence of reducing agents, light and high temperature (Takahashi 2007). The local absorption maximum at 590 nm (keto-indigoidine) decreases after 15-25 hours, whereas the absorption maximum at 430 nm (leuco-indigoidine) increases (data not shown). Note that the maximum level of indigoidine differs among the engineered indigoidine synthetases. | |
| - | synthetase were measured for 30 hours. The graphs show the OD590 of indigoidine in <i>E. coli</i> | + | |
| - | + | ||
| - | liquid cultures over time. The absorption of the cell suspension has been subtracted (see OD | + | |
| - | + | ||
| - | Measurement in the Methods section). The red graph relates to an <i>E. coli</i> TOP10 negative control, | + | |
| - | + | ||
| - | the green graph depicts the indigoidine production of an indC variant, in which the T-domain has been | + | |
| - | + | ||
| - | exchanged with our synthetic T-domain #3, whereas the blue graphs refers to synthetic T-domain #4. | + | |
| - | The amount of indigoidine reaches a maximum before it drops again. This is due the instability of | + | |
| - | + | ||
| - | indigoidine, which is reduced to its fluorescent leuco-form under the influence of reducing agents, | + | |
| - | + | ||
| - | light and high temperature (Takahashi 2007). The local absorption maximum at 590 nm (keto-indigoidine) | + | |
| - | + | ||
| - | decreases after 15-25 hours, whereas the absorption maximum at 430 nm (leuco-indigoidine) increases | + | |
| - | + | ||
| - | (data not shown). Note that the maximum level of indigoidine differs among the engineered indigoidine | + | |
| - | + | ||
| - | synthetases."> | + | |
| - | <img style="width:50%; margin-bottom:10px; padding:1%;border-style:solid;border-width:1px;border- | + | |
| - | + | ||
| - | radius: 5px;" src="https://static.igem.org/mediawiki/2013/3/38/Heidelberg_IndPD_Fig11.png"></img> | + | |
| - | <figcaption style="width:80%;"><b>Figure 9: Indigoidine Production Varies Among Engineered | + | |
| - | + | ||
| - | Indigoidine Synthetases.</b> | + | |
| - | The absorption spectrum of liquid cultures expressing engineered variants of the indC indigoidine | + | |
| - | + | ||
| - | synthetase were measured for 30 hours. The graphs show the OD590 of indigoidine in <i>E. coli</i> | + | |
| - | + | ||
| - | liquid cultures over time. The absorption of the cell suspension has been subtracted (see OD | + | |
| - | + | ||
| - | Measurement in the Methods section). The red graph relates to an <i>E. coli</i> TOP10 negative control, | + | |
| - | + | ||
| - | the green graph depicts the indigoidine production of an indC variant, in which the T-domain has been | + | |
| - | + | ||
| - | exchanged with our synthetic T-domain #3, whereas the blue graphs refers to synthetic T-domain #4. | + | |
| - | The amount of indigoidine reaches a maximum before it drops again. This is due the instability of | + | |
| - | + | ||
| - | indigoidine, which is reduced to its fluorescent leuco-form under the influence of reducing agents, | + | |
| - | + | ||
| - | light and high temperature (Takahashi 2007). The local absorption maximum at 590 nm (keto-indigoidine) | + | |
| - | + | ||
| - | decreases after 15-25 hours, whereas the absorption maximum at 430 nm (leuco-indigoidine) increases | + | |
| - | + | ||
| - | (data not shown). Note that the maximum level of indigoidine differs among the engineered indigoidine | + | |
| - | + | ||
| - | synthetases. | + | |
</figcaption> | </figcaption> | ||
</a> | </a> | ||
| Line 1,544: | Line 440: | ||
<h3>Engineered Indigoidine Synthetase is More Efficient than Native Enzyme</h3> | <h3>Engineered Indigoidine Synthetase is More Efficient than Native Enzyme</h3> | ||
<p> | <p> | ||
| - | After applying the domain border combination A2 (see <a class="fancybox fancyGraphical" | + | After applying the domain border combination A2 (see <a class="fancybox fancyGraphical" href="https://static.igem.org/mediawiki/2013/e/eb/Heidelberg_IndPD_Fig8.png" caption="<b>Figure 6: Determination of required domain borders for T-domain exchange</b> |
| - | + | ||
| - | href="https://static.igem.org/mediawiki/2013/e/eb/Heidelberg_IndPD_Fig8.png" caption="<b>Figure 6: | + | |
| - | + | ||
| - | Determination of required domain borders for T-domain exchange</b> | + | |
<b>a)</b> Definition of different domain border combinations for T-domain exchanges | <b>a)</b> Definition of different domain border combinations for T-domain exchanges | ||
The figure shows a sequence alignment of the indC and bpsA amino acid sequences. | The figure shows a sequence alignment of the indC and bpsA amino acid sequences. | ||
| Line 1,562: | Line 454: | ||
used for exchanging the indC T-domain with the T-domain of bpsA. These are the | used for exchanging the indC T-domain with the T-domain of bpsA. These are the | ||
combinations A1, A2 and C1. We applied combination A2 for further T-domain exchanges. ">Fig. 6</a> | combinations A1, A2 and C1. We applied combination A2 for further T-domain exchanges. ">Fig. 6</a> | ||
| - | ) to all T-domains we inserted to the indC gene, we quantified the amount of indigoidine produced per | + | ) to all T-domains we inserted to the indC gene, we quantified the amount of indigoidine produced per cell density of <em>E. coli</em> cells expressing both the engineered indC variant and a PPTase (Sfp, Svp, EntD or DelC). We used a Tecan infinite M200 plate reader and applied the quantitative indigoidine assay described in the methods section. <a class="fancybox fancyGraphical" href="https://static.igem.org/mediawiki/2013/0/05/Heidelberg_heatmap.png" caption="<b>Figure 10: Combinations of Engineered Indigoidine Synthetases and PPTases differ in Efficiency.</b> |
| - | + | E. coli TOP10 cells were co-transformed with engineered variants of the indigoidine synthetase indC and different PPTases. The x-axis depicts four variants of indC, in which the T-domain has been replaced (1: native indC; 2: indC with T-domain from delH4 (<i>D. acidovorans</i>; 3: T-domain from plu2642 (<i>P. luminescens</i>); 4: synthetic T-domain #4 (see Methods section)). The y-axis indicates four different PPTases we used (1: sfp from <i>B. subtilis</i>; 2: svp from <i>S. verticillus</i>; 3: entD from <i>E. coli</i>; 4: delC from <i>D. acidovorans</i>). The color of each field depicts the maximal amount of indigoidine production per cell density by cells expressing the respective indigoidine synthetase and PPTase. | |
| - | cell density of <em>E. coli</em> cells expressing both the engineered indC variant and a PPTase (Sfp, | + | Remarkably, when coexpressed with sfp, the engineered indigoidine synthetase with the T-domain of plu2642 results in higher indigoidine yield compared to the native indC. Note, that the combination of the engineered indigoidine synthetase with the T-domain of plu2642 and entD is most efficient among the combinations shown." |
| - | + | ||
| - | Svp, EntD or DelC). We used a Tecan infinite M200 plate reader and applied the quantitative indigoidine | + | |
| - | + | ||
| - | assay described in the methods section. <a class="fancybox fancyGraphical" | + | |
| - | + | ||
| - | href="https://static.igem.org/mediawiki/2013/0/05/Heidelberg_heatmap.png" caption="<b>Figure 10: Combinations | + | |
| - | + | ||
| - | of Engineered Indigoidine Synthetases and PPTases differ in Efficiency.</b> | + | |
| - | E. coli TOP10 cells were co-transformed with engineered variants of the indigoidine synthetase indC and | + | |
| - | + | ||
| - | different PPTases. The x-axis depicts four variants of indC, in which the T-domain has been replaced | + | |
| - | + | ||
| - | (1: native indC; 2: indC with T-domain from delH4 (<i>D. acidovorans</i>; 3: T-domain from plu2642 | + | |
| - | + | ||
| - | (<i>P. luminescens</i>); 4: synthetic T-domain #4 (see Methods section)). The y-axis indicates four | + | |
| - | + | ||
| - | different PPTases we used (1: sfp from <i>B. subtilis</i>; 2: svp from <i>S. verticillus</i>; 3: entD | + | |
| - | + | ||
| - | from <i>E. coli</i>; 4: delC from <i>D. acidovorans</i>). The color of each field depicts the maximal | + | |
| - | + | ||
| - | amount of indigoidine production per cell density by cells expressing the respective indigoidine | + | |
| - | + | ||
| - | synthetase and PPTase. | + | |
| - | Remarkably, when coexpressed with sfp, the engineered indigoidine synthetase with the T-domain of | + | |
| - | + | ||
| - | plu2642 results in higher indigoidine yield compared to the native indC. Note, that the combination of | + | |
| - | + | ||
| - | the engineered indigoidine synthetase with the T-domain of plu2642 and entD is most efficient among the | + | |
| - | + | ||
| - | combinations shown." | + | |
>Fig. 10</a> | >Fig. 10</a> | ||
| - | shows the relative indigoidine production of representative samples in this measurement, illustrated | + | shows the relative indigoidine production of representative samples in this measurement, illustrated as a heat map. The indigidine production strongly varies among different combinations of T-domains and PPTases. Notably, one of the engineered indigoidine synthetases is more efficient than the native enzyme itself. This most efficient indigoidine synthetase carries the synthetic T-domain #3. With this remarkable finding we wanted to have a closer view at structural aspects of this enzyme. Currently, the crystal structures of both the native IndC and our optimized variant are investigated by the group of Dr. Bange (Philipps-Universität Marburg). |
| - | + | ||
| - | as a heat map. The indigidine production strongly varies among different combinations of T-domains and | + | |
| - | + | ||
| - | PPTases. Notably, one of the engineered indigoidine synthetases is more efficient than the native | + | |
| - | + | ||
| - | enzyme itself. This most efficient indigoidine synthetase carries the synthetic T-domain #3. With this | + | |
| - | + | ||
| - | remarkable finding we wanted to have a closer view at structural aspects of this enzyme. Currently, the | + | |
| - | + | ||
| - | crystal structures of both the native IndC and our optimized variant are investigated by the group of | + | |
| - | + | ||
| - | Dr. Bange (Philipps-Universität Marburg). | + | |
<br/><br/> | <br/><br/> | ||
<center> | <center> | ||
| - | <a class="fancybox fancyGraphical" href="https://static.igem.org/mediawiki/2013/0/05/Heidelberg_heatmap.png" | + | <a class="fancybox fancyGraphical" href="https://static.igem.org/mediawiki/2013/0/05/Heidelberg_heatmap.png" caption="<b>Figure 10: Combinations of Engineered Indigoidine Synthetases and PPTases differ in Efficiency.</b> |
| - | + | E. coli TOP10 cells were co-transformed with engineered variants of the indigoidine synthetase indC and different PPTases. The x-axis depicts four variants of indC, in which the T-domain has been replaced (1: native indC; 2: indC with T-domain from delH4 (<i>D. acidovorans</i>; 3: T-domain from plu2642 (<i>P. luminescens</i>); 4: synthetic T-domain #4 (see Methods section)). The y-axis indicates four different PPTases we used (1: sfp from <i>B. subtilis</i>; 2: svp from <i>S. verticillus</i>; 3: entD from <i>E. coli</i>; 4: delC from <i>D. acidovorans</i>). The color of each field depicts the maximal amount of indigoidine production per cell density by cells expressing the respective indigoidine synthetase and PPTase. | |
| - | caption="<b>Figure 10: Combinations of Engineered Indigoidine Synthetases and PPTases differ in | + | Remarkably, when coexpressed with sfp, the engineered indigoidine synthetase with the T-domain of plu2642 results in higher indigoidine yield compared to the native indC. Note, that the combination of the engineered indigoidine synthetase with the T-domain of plu2642 and entD is most efficient among the combinations shown." |
| - | + | ||
| - | Efficiency.</b> | + | |
| - | E. coli TOP10 cells were co-transformed with engineered variants of the indigoidine synthetase indC and | + | |
| - | + | ||
| - | different PPTases. The x-axis depicts four variants of indC, in which the T-domain has been replaced | + | |
| - | + | ||
| - | (1: native indC; 2: indC with T-domain from delH4 (<i>D. acidovorans</i>; 3: T-domain from plu2642 | + | |
| - | + | ||
| - | (<i>P. luminescens</i>); 4: synthetic T-domain #4 (see Methods section)). The y-axis indicates four | + | |
| - | + | ||
| - | different PPTases we used (1: sfp from <i>B. subtilis</i>; 2: svp from <i>S. verticillus</i>; 3: entD | + | |
| - | + | ||
| - | from <i>E. coli</i>; 4: delC from <i>D. acidovorans</i>). The color of each field depicts the maximal | + | |
| - | + | ||
| - | amount of indigoidine production per cell density by cells expressing the respective indigoidine | + | |
| - | + | ||
| - | synthetase and PPTase. | + | |
| - | Remarkably, when coexpressed with sfp, the engineered indigoidine synthetase with the T-domain of | + | |
| - | + | ||
| - | plu2642 results in higher indigoidine yield compared to the native indC. Note, that the combination of | + | |
| - | + | ||
| - | the engineered indigoidine synthetase with the T-domain of plu2642 and entD is most efficient among the | + | |
| - | + | ||
| - | combinations shown." | + | |
> | > | ||
| - | <img style="width:25%; align:center; margin-bottom:10px; padding:1%;border-style:solid;border- | + | <img style="width:25%; align:center; margin-bottom:10px; padding:1%;border-style:solid;border-width:1px;border-radius: 5px;" src="https://static.igem.org/mediawiki/2013/0/05/Heidelberg_heatmap.png"></img> |
| - | + | <figcaption style="width:80%;"><b>Figure 10: Combinations of Engineered Indigoidine Synthetases and PPTases differ in Efficiency.</b> | |
| - | width:1px;border-radius: 5px;" | + | E. coli TOP10 cells were co-transformed with engineered variants of the indigoidine synthetase indC and different PPTases. The x-axis depicts four variants of indC, in which the T-domain has been replaced (1: native indC; 2: indC with T-domain from delH4 (<i>D. acidovorans</i>; 3: T-domain from plu2642 (<i>P. luminescens</i>); 4: synthetic T-domain #4 (see Methods section)). The y-axis indicates four different PPTases we used (1: sfp from <i>B. subtilis</i>; 2: svp from <i>S. verticillus</i>; 3: entD from <i>E. coli</i>; 4: delC from <i>D. acidovorans</i>). The color of each field depicts the maximal amount of indigoidine production per cell density by cells expressing the respective indigoidine synthetase and PPTase. |
| - | + | Remarkably, when coexpressed with sfp, the engineered indigoidine synthetase with the T-domain of plu2642 results in higher indigoidine yield compared to the native indC. Note, that the combination of the engineered indigoidine synthetase with the T-domain of plu2642 and entD is most efficient among the combinations shown. <br/> | |
| - | src="https://static.igem.org/mediawiki/2013/0/05/Heidelberg_heatmap.png"></img> | + | |
| - | <figcaption style="width:80%;"><b>Figure 10: Combinations of Engineered Indigoidine Synthetases | + | |
| - | + | ||
| - | and PPTases differ in Efficiency.</b> | + | |
| - | E. coli TOP10 cells were co-transformed with engineered variants of the indigoidine synthetase indC and | + | |
| - | + | ||
| - | different PPTases. The x-axis depicts four variants of indC, in which the T-domain has been replaced | + | |
| - | + | ||
| - | (1: native indC; 2: indC with T-domain from delH4 (<i>D. acidovorans</i>; 3: T-domain from plu2642 | + | |
| - | + | ||
| - | (<i>P. luminescens</i>); 4: synthetic T-domain #4 (see Methods section)). The y-axis indicates four | + | |
| - | + | ||
| - | different PPTases we used (1: sfp from <i>B. subtilis</i>; 2: svp from <i>S. verticillus</i>; 3: entD | + | |
| - | + | ||
| - | from <i>E. coli</i>; 4: delC from <i>D. acidovorans</i>). The color of each field depicts the maximal | + | |
| - | + | ||
| - | amount of indigoidine production per cell density by cells expressing the respective indigoidine | + | |
| - | + | ||
| - | synthetase and PPTase. | + | |
| - | Remarkably, when coexpressed with sfp, the engineered indigoidine synthetase with the T-domain of | + | |
| - | + | ||
| - | plu2642 results in higher indigoidine yield compared to the native indC. Note, that the combination of | + | |
| - | + | ||
| - | the engineered indigoidine synthetase with the T-domain of plu2642 and entD is most efficient among the | + | |
| - | + | ||
| - | combinations shown. <br/> | + | |
</figcaption> | </figcaption> | ||
</a> | </a> | ||
| Line 1,678: | Line 478: | ||
<h2 id="discussion">Discussion</h2> | <h2 id="discussion">Discussion</h2> | ||
<p> | <p> | ||
| - | Motivated by the establishment of the Indigoidine-Tag, which enables the labelling of nonribosomal | + | Motivated by the establishment of the Indigoidine-Tag, which enables the labelling of nonribosomal peptides, we wanted to further investigate the indigoidine synthetase indC [3] and thus the overall NRPS modularity in order to optimize the functionality of the indigoidine tag. In previous studies, direct T-domain exchanges have not been successful in the context of the indigoidine synthetase BpsA from <em>S. lavendulae</em> [6][7]. Furthermore, the endogenous PPTase EntD of <em>E. coli</em> was considered inefficient in the activation of the blue pigment synthetase BpsA [6]. Therefore, most studies in the field of NRPS are conducted with the PPTase Sfp from <em>B. subtilis</em> [11]. The family of 4'-Phosphopantheteinyl-transferases was reported to vary in substrate specificity [11]. Therefore, they can only activate specific NRPS module families [9]. We first investigated the production of indigoidine in five substrains of <em>E. coli</em>: TOP10 (Invitrogen), MG1655 [4], NEB Turbo (NEB), BAP1 [5] and Rosetta (Novagen), using an expression plasmid coding for the indigoidine synthetase IndC and the PPTase Sfp. Though differring in their growth behaviour, all substrains showed to be capable of producing the blue pigment indigoidine (<a class="fancybox fancyGraphical" href="https://static.igem.org/mediawiki/2013/c/cf/Heidelberg_IndPD_Fig6.png" caption="<b>Figure 3: Comparison between different <em>E. coli</em> strains and PPTases:</b> |
| - | + | <b>a)</b> Comparison of different <em>E. coli</em> strains examining growth and indigoidine production | |
| - | peptides, we wanted to further investigate the indigoidine synthetase indC [3] and thus the overall | + | The figure shows five different strains of <em>E. coli</em> that have been co-transformed with an indC expression plasmid and a sfp expression plasmid. The negative control is <em>E. coli</em> TOP10 without a plasmid. All transformants have been grown on LB agar for 48 hours at room temperature, cells were not induced. One can see that even without induction all strains express the indigoidine synthetase and produce the blue pigment indigoidine. However, the strains BAP1 and NEB Turbo grow faster in the first day, exhibiting a white phenotype (data not shown). Colonies on the plate of <em>E. coli</em> TOP10 are very small and dark blue/ black. Assuming that indigoidine production inhibits cell growth due to its toxicity, we concluded that TOP10 produced the most indigoidine among the strains we tested. We used <em>E. coli</em> TOP10 for the following experiments. |
| - | + | ||
| - | NRPS modularity in order to optimize the functionality of the indigoidine tag. In previous studies, | + | |
| - | + | ||
| - | direct T-domain exchanges have not been successful in the context of the indigoidine synthetase BpsA | + | |
| - | + | ||
| - | from <em>S. lavendulae</em> [6][7]. Furthermore, the endogenous PPTase EntD of <em>E. coli</em> was | + | |
| - | + | ||
| - | considered inefficient in the activation of the blue pigment synthetase BpsA [6]. Therefore, most | + | |
| - | + | ||
| - | studies in the field of NRPS are conducted with the PPTase Sfp from <em>B. subtilis</em> [11]. The | + | |
| - | + | ||
| - | family of 4'-Phosphopantheteinyl-transferases was reported to vary in substrate specificity [11]. | + | |
| - | + | ||
| - | Therefore, they can only activate specific NRPS module families [9]. We first investigated the | + | |
| - | + | ||
| - | production of indigoidine in five substrains of <em>E. coli</em>: TOP10 (Invitrogen), MG1655 [4], NEB | + | |
| - | + | ||
| - | Turbo (NEB), BAP1 [5] and Rosetta (Novagen), using an expression plasmid coding for the indigoidine | + | |
| - | + | ||
| - | synthetase IndC and the PPTase Sfp. Though differring in their growth behaviour, all substrains showed | + | |
| - | + | ||
| - | to be capable of producing the blue pigment indigoidine (<a class="fancybox fancyGraphical" | + | |
| - | + | ||
| - | href="https://static.igem.org/mediawiki/2013/c/cf/Heidelberg_IndPD_Fig6.png" caption="<b>Figure 3: Comparison | + | |
| - | + | ||
| - | between different <em>E. coli</em> strains and PPTases:</b> | + | |
| - | <b>a)</b> Comparison of different <em>E. coli</em> strains examining growth and indigoidine | + | |
| - | + | ||
| - | production | + | |
| - | The figure shows five different strains of <em>E. coli</em> that have been co-transformed with an indC | + | |
| - | + | ||
| - | expression plasmid and a sfp expression plasmid. The negative control is <em>E. coli</em> TOP10 without | + | |
| - | + | ||
| - | a plasmid. All transformants have been grown on LB agar for 48 hours at room temperature, cells were | + | |
| - | + | ||
| - | not induced. One can see that even without induction all strains express the indigoidine synthetase and | + | |
| - | + | ||
| - | produce the blue pigment indigoidine. However, the strains BAP1 and NEB Turbo grow faster in the first | + | |
| - | + | ||
| - | day, exhibiting a white phenotype (data not shown). Colonies on the plate of <em>E. coli</em> TOP10 | + | |
| - | + | ||
| - | are very small and dark blue/ black. Assuming that indigoidine production inhibits cell growth due to | + | |
| - | + | ||
| - | its toxicity, we concluded that TOP10 produced the most indigoidine among the strains we tested. We | + | |
| - | + | ||
| - | used <em>E. coli</em> TOP10 for the following experiments. | + | |
<b>b)</b> Comparison between different PPTases concerning overall indigoidine production | <b>b)</b> Comparison between different PPTases concerning overall indigoidine production | ||
| - | The Figure shows ''E. coli'' TOP10 cells co-transformed with indC and four different PPTases (sfp, svp, | + | The Figure shows ''E. coli'' TOP10 cells co-transformed with indC and four different PPTases (sfp, svp, entD and delC), respectively. The image bottom left shows ''E. coli'' TOP10 cells without additional PPTase and the negative control is TOP10 without a plasmid. |
| - | + | ||
| - | entD and delC), respectively. The image bottom left shows ''E. coli'' TOP10 cells without additional | + | |
| - | + | ||
| - | PPTase and the negative control is TOP10 without a plasmid. | + | |
">Fig. 3a</a>). | ">Fig. 3a</a>). | ||
<br/><br/> | <br/><br/> | ||
| - | In our approach, we replaced single domains of the indC indigoidine synthetase module with both | + | In our approach, we replaced single domains of the indC indigoidine synthetase module with both respective domains of other NRPS pathways from different organisms and entirely synthetic domains which were created based on multiple sequence alignments of 250 NRPS domains. We also created indC variants, in which different domain borders have been applied for the domain exchange (<a class="fancybox fancyGraphical" href="https://static.igem.org/mediawiki/2013/e/eb/Heidelberg_IndPD_Fig8.png" caption="<b>Figure 6: Determination of required domain borders for T-domain exchange</b> |
| - | + | ||
| - | respective domains of other NRPS pathways from different organisms and entirely synthetic domains which | + | |
| - | + | ||
| - | were created based on multiple sequence alignments of 250 NRPS domains. We also created indC variants, | + | |
| - | + | ||
| - | in which different domain borders have been applied for the domain exchange (<a class="fancybox | + | |
| - | + | ||
| - | fancyGraphical" href="https://static.igem.org/mediawiki/2013/e/eb/Heidelberg_IndPD_Fig8.png" | + | |
| - | + | ||
| - | caption="<b>Figure 6: Determination of required domain borders for T-domain exchange</b> | + | |
<b>a)</b> Definition of different domain border combinations for T-domain exchanges | <b>a)</b> Definition of different domain border combinations for T-domain exchanges | ||
The figure shows a sequence alignment of the indC and bpsA amino acid sequences. | The figure shows a sequence alignment of the indC and bpsA amino acid sequences. | ||
| Line 1,760: | Line 500: | ||
plasmid coding for the PPTase Sfp shows that only three domain border combinations can be | plasmid coding for the PPTase Sfp shows that only three domain border combinations can be | ||
used for exchanging the indC T-domain with the T-domain of bpsA. These are the | used for exchanging the indC T-domain with the T-domain of bpsA. These are the | ||
| - | combinations A1, A2 and C1. We applied combination A2 for further T-domain exchanges. ">Fig. 6</a>), | + | combinations A1, A2 and C1. We applied combination A2 for further T-domain exchanges. ">Fig. 6</a>), since setting the correct linker sequence is crucial for the NRPS function [7]. We used NRPS domains from <em>Streptomyces lavendulae lavendulae</em> ATCC11924 (blue pigment synthetase bpsA) [6], <em>Brevibacillus parabrevis</em> (Tyrocidine synthesis cluster) [2], <em>Delftia acidovorans</em> SPH-1 (Delftibactin synthesis cluster) [8], <em>Photorhabdus luminescens laumondii</em> TT01 (plu2670 and plu2642, unknown function) [14] and <em>Escherichia coli</em> MG1655 (entF from enterobactin synthesis cluster) [4], thus creating a library of 58 different engineered indigoidine synthetases. We co-transformed the 58 indC variants with four different PPTases into <em>E. coli</em> TOP10 cells. We used the PPTases Sfp (<em>Bacillus subtilis</em> str. 168) [11], Svp (<em>Streptomyces verticillus</em> ATCC15003) [12], EntD (<em>Escherichia coli</em> MG1655) [7] and DelC (<em>Delftia acidovorans</em> SPH-1) [8] and screened them on their functionality. This screening is remarkably easy, because functional indigoidine synthetases result in a blue phenotype when being expressed and activated in <em>E. coli</em> cells [3]. We found, that nine engineered indigoidine synthetases, in which the T-domain was replaced, remained functional in producing indigoidine when co-expressed with specific PPTases. The inserted T-domains include four synthetic T-domains (<a class="fancybox fancyGraphical" "href="https://static.igem.org/mediawiki/2013/1/11/Heidelberg_tagopt_Fig4.png" caption="<b>Figure 4: Coexpression of Engineered Indigoidine Synthetases and Supplementary PPTases in <i>E. coli</i></b> |
| - | + | In this first experiment, we replaced the indC T-domain with the T-domains of other native NRPS modules (1: wild-type indC, 2: bpsA,3: entF, 4: delH4, 5: delH5, 6: tycA, 7: tycC6, 8: plu2642 and 9: plu2670) and synthetic T-domains (10-16: synT1-7). We also exchanged both the T- and TE-domain by the T- and TE-domain of other natural NRPS modules (17: bpsA, 18: tycC6, 19: delH5). The cells have been co-transformed with a plasmid containing the respective engineered variant of indC and a second plasmid coding for the PPTase Sfp, Svp, EntD or DelC. The first row shows plates with cells only expressing the engineered indigoidine synthetases without a supplementary PPTase. Note that some combinations result in blue colonies, whereas others don't.">Fig. 4</a> | |
| - | since setting the correct linker sequence is crucial for the NRPS function [7]. We used NRPS domains | + | ), the T-domain of bpsA with three different domain border combinations (<a class="fancybox fancyGraphical" href="https://static.igem.org/mediawiki/2013/e/eb/Heidelberg_IndPD_Fig8.png" caption="<b>Figure 6: Determination of required domain borders for T-domain exchange</b> |
| - | + | ||
| - | from <em>Streptomyces lavendulae lavendulae</em> ATCC11924 (blue pigment synthetase bpsA) [6], | + | |
| - | + | ||
| - | <em>Brevibacillus parabrevis</em> (Tyrocidine synthesis cluster) [2], <em>Delftia acidovorans</em> | + | |
| - | + | ||
| - | SPH-1 (Delftibactin synthesis cluster) [8], <em>Photorhabdus luminescens laumondii</em> TT01 (plu2670 | + | |
| - | + | ||
| - | and plu2642, unknown function) [14] and <em>Escherichia coli</em> MG1655 (entF from enterobactin | + | |
| - | + | ||
| - | synthesis cluster) [4], thus creating a library of 58 different engineered indigoidine synthetases. We | + | |
| - | + | ||
| - | co-transformed the 58 indC variants with four different PPTases into <em>E. coli</em> TOP10 cells. We | + | |
| - | + | ||
| - | used the PPTases Sfp (<em>Bacillus subtilis</em> str. 168) [11], Svp (<em>Streptomyces verticillus</em> | + | |
| - | + | ||
| - | ATCC15003) [12], EntD (<em>Escherichia coli</em> MG1655) [7] and DelC (<em>Delftia acidovorans</em> | + | |
| - | + | ||
| - | SPH-1) [8] and screened them on their functionality. This screening is remarkably easy, because | + | |
| - | + | ||
| - | functional indigoidine synthetases result in a blue phenotype when being expressed and activated in | + | |
| - | + | ||
| - | <em>E. coli</em> cells [3]. We found, that nine engineered indigoidine synthetases, in which the T- | + | |
| - | + | ||
| - | domain was replaced, remained functional in producing indigoidine when co-expressed with specific | + | |
| - | + | ||
| - | PPTases. The inserted T-domains include four synthetic T-domains (<a class="fancybox fancyGraphical" | + | |
| - | + | ||
| - | "href="https://static.igem.org/mediawiki/2013/1/11/Heidelberg_tagopt_Fig4.png" caption="<b>Figure 4: | + | |
| - | + | ||
| - | Coexpression of Engineered Indigoidine Synthetases and Supplementary PPTases in <i>E. coli</i></b> | + | |
| - | In this first experiment, we replaced the indC T-domain with the T-domains of other native NRPS | + | |
| - | + | ||
| - | modules (1: wild-type indC, 2: bpsA,3: entF, 4: delH4, 5: delH5, 6: tycA, 7: tycC6, 8: plu2642 and 9: | + | |
| - | + | ||
| - | plu2670) and synthetic T-domains (10-16: synT1-7). We also exchanged both the T- and TE-domain by the | + | |
| - | + | ||
| - | T- and TE-domain of other natural NRPS modules (17: bpsA, 18: tycC6, 19: delH5). The cells have been | + | |
| - | + | ||
| - | co-transformed with a plasmid containing the respective engineered variant of indC and a second plasmid | + | |
| - | + | ||
| - | coding for the PPTase Sfp, Svp, EntD or DelC. The first row shows plates with cells only expressing the | + | |
| - | + | ||
| - | engineered indigoidine synthetases without a supplementary PPTase. Note that some combinations result | + | |
| - | + | ||
| - | in blue colonies, whereas others don't.">Fig. 4</a> | + | |
| - | ), the T-domain of bpsA with three different domain border combinations (<a class="fancybox | + | |
| - | + | ||
| - | fancyGraphical" href="https://static.igem.org/mediawiki/2013/e/eb/Heidelberg_IndPD_Fig8.png" | + | |
| - | + | ||
| - | caption="<b>Figure 6: Determination of required domain borders for T-domain exchange</b> | + | |
<b>a)</b> Definition of different domain border combinations for T-domain exchanges | <b>a)</b> Definition of different domain border combinations for T-domain exchanges | ||
The figure shows a sequence alignment of the indC and bpsA amino acid sequences. | The figure shows a sequence alignment of the indC and bpsA amino acid sequences. | ||
| Line 1,825: | Line 515: | ||
plasmid coding for the PPTase Sfp shows that only three domain border combinations can be | plasmid coding for the PPTase Sfp shows that only three domain border combinations can be | ||
used for exchanging the indC T-domain with the T-domain of bpsA. These are the | used for exchanging the indC T-domain with the T-domain of bpsA. These are the | ||
| - | combinations A1, A2 and C1. We applied combination A2 for further T-domain exchanges. ">Fig. 6</a>) and | + | combinations A1, A2 and C1. We applied combination A2 for further T-domain exchanges. ">Fig. 6</a>) and the T-domains of the NRPS modules plu2642 (<em>P. luminescens</em>) and delH (<em>D. acidovorans</em>)(<a class="fancybox fancyGraphical" href="https://static.igem.org/mediawiki/2013/6/6e/Heidelberg_IndPD_Fig9.png" caption="<b>Figure 7: Applying optimized domain border combinations by T-domain exchange of native NRPS T-domains</b> |
| - | + | As described above, we determined an optimized domain border combination for the exchange of the native indC T-domain with the T-domain of the indigoidine synthetase bpsA. We applied this border combination (previously referred to as ''A2'') to the T-domains of the NRPS modules entF, delH4, delH5, tycA1, tycC6, plu2642 and plu2670, replacing the indC T-domain with the respective fragments of those modules. This figure shows three transformants with a blue phenotype in which the indC T-domain was exchanged by the T-domain of the respective NRPS module. The pictures were taken after 60 hours of incubation at room temperature. Once more one can see the differences in growth kinetics due to the production of indigoidine: Cells expressing the indC variant with the T-domain of bpsA grow very slow and form small and dark blue colonies, whereas cells expressing other variants grow faster. Comparing the images on the very right, we suggest that cells expressing indC with the T-domain of plu2642 produce the most indigoidine in the given timeframe, compared to both the delH4- and the bpsA-variant. The combination of the plu2642 T-domain and the indC indigoidine synthetase seems to be ideal, concerning both indigoidine production and overall growth.">Fig. 7</a>). In order to quantify the amount of indigoidine produced by the engineered indigoidine synthetases when co-transformed with different PPTases, we established a quantitative indigoidine assay based on OD measurement using a Tecan infinite M200 plate reader, inspired by Myers et al. [15]. Notably, one of our engineered IndC constructs was more efficient ind the production of indigoidine compared to the wild-type IndC (T-domain Plu2642; <a class="fancybox fancyGraphical" href="https://static.igem.org/mediawiki/2013/0/05/Heidelberg_heatmap.png" caption="<b>Figure 10: Combinations of Engineered Indigoidine Synthetases and PPTases differ in Efficiency.</b> | |
| - | the T-domains of the NRPS modules plu2642 (<em>P. luminescens</em>) and delH (<em>D. acidovorans</em>) | + | E. coli TOP10 cells were co-transformed with engineered variants of the indigoidine synthetase indC and different PPTases. The x-axis depicts four variants of indC, in which the T-domain has been replaced (1: native indC; 2: indC with T-domain from delH4 (<i>D. acidovorans</i>; 3: T-domain from plu2642 (<i>P. luminescens</i>); 4: synthetic T-domain #4 (see Methods section)). The y-axis indicates four different PPTases we used (1: sfp from <i>B. subtilis</i>; 2: svp from <i>S. verticillus</i>; 3: entD from <i>E. coli</i>; 4: delC from <i>D. acidovorans</i>). The color of each field depicts the maximal amount of indigoidine production per cell density by cells expressing the respective indigoidine synthetase and PPTase. |
| - | + | Remarkably, when coexpressed with sfp, the engineered indigoidine synthetase with the T-domain of plu2642 results in higher indigoidine yield compared to the native indC. Note, that the combination of the engineered indigoidine synthetase with the T-domain of plu2642 and entD is most efficient among the combinations shown." | |
| - | (<a class="fancybox fancyGraphical" | + | |
| - | + | ||
| - | href="https://static.igem.org/mediawiki/2013/6/6e/Heidelberg_IndPD_Fig9.png" caption="<b>Figure 7: Applying | + | |
| - | + | ||
| - | optimized domain border combinations by T-domain exchange of native NRPS T-domains</b> | + | |
| - | As described above, we determined an optimized domain border combination for the exchange of the | + | |
| - | + | ||
| - | native indC T-domain with the T-domain of the indigoidine synthetase bpsA. We applied this border | + | |
| - | + | ||
| - | combination (previously referred to as ''A2'') to the T-domains of the NRPS modules entF, delH4, delH5, | + | |
| - | + | ||
| - | tycA1, tycC6, plu2642 and plu2670, replacing the indC T-domain with the respective fragments of those | + | |
| - | + | ||
| - | modules. This figure shows three transformants with a blue phenotype in which the indC T-domain was | + | |
| - | + | ||
| - | exchanged by the T-domain of the respective NRPS module. The pictures were taken after 60 hours of | + | |
| - | + | ||
| - | incubation at room temperature. Once more one can see the differences in growth kinetics due to the | + | |
| - | + | ||
| - | production of indigoidine: Cells expressing the indC variant with the T-domain of bpsA grow very slow | + | |
| - | + | ||
| - | and form small and dark blue colonies, whereas cells expressing other variants grow faster. Comparing | + | |
| - | + | ||
| - | the images on the very right, we suggest that cells expressing indC with the T-domain of plu2642 | + | |
| - | + | ||
| - | produce the most indigoidine in the given timeframe, compared to both the delH4- and the bpsA-variant. | + | |
| - | + | ||
| - | The combination of the plu2642 T-domain and the indC indigoidine synthetase seems to be ideal, | + | |
| - | + | ||
| - | concerning both indigoidine production and overall growth.">Fig. 7</a>). In order to quantify the | + | |
| - | + | ||
| - | amount of indigoidine produced by the engineered indigoidine synthetases when co-transformed with | + | |
| - | + | ||
| - | different PPTases, we established a quantitative indigoidine assay based on OD measurement using a | + | |
| - | + | ||
| - | Tecan infinite M200 plate reader, inspired by Myers et al. [15]. Notably, one of our engineered IndC | + | |
| - | + | ||
| - | constructs was more efficient ind the production of indigoidine compared to the wild-type IndC (T- | + | |
| - | + | ||
| - | domain Plu2642; <a class="fancybox fancyGraphical" | + | |
| - | + | ||
| - | href="https://static.igem.org/mediawiki/2013/0/05/Heidelberg_heatmap.png" caption="<b>Figure 10: Combinations | + | |
| - | + | ||
| - | of Engineered Indigoidine Synthetases and PPTases differ in Efficiency.</b> | + | |
| - | E. coli TOP10 cells were co-transformed with engineered variants of the indigoidine synthetase indC and | + | |
| - | + | ||
| - | different PPTases. The x-axis depicts four variants of indC, in which the T-domain has been replaced | + | |
| - | + | ||
| - | (1: native indC; 2: indC with T-domain from delH4 (<i>D. acidovorans</i>; 3: T-domain from plu2642 | + | |
| - | + | ||
| - | (<i>P. luminescens</i>); 4: synthetic T-domain #4 (see Methods section)). The y-axis indicates four | + | |
| - | + | ||
| - | different PPTases we used (1: sfp from <i>B. subtilis</i>; 2: svp from <i>S. verticillus</i>; 3: entD | + | |
| - | + | ||
| - | from <i>E. coli</i>; 4: delC from <i>D. acidovorans</i>). The color of each field depicts the maximal | + | |
| - | + | ||
| - | amount of indigoidine production per cell density by cells expressing the respective indigoidine | + | |
| - | + | ||
| - | synthetase and PPTase. | + | |
| - | Remarkably, when coexpressed with sfp, the engineered indigoidine synthetase with the T-domain of | + | |
| - | + | ||
| - | plu2642 results in higher indigoidine yield compared to the native indC. Note, that the combination of | + | |
| - | + | ||
| - | the engineered indigoidine synthetase with the T-domain of plu2642 and entD is most efficient among the | + | |
| - | + | ||
| - | combinations shown." | + | |
>Fig. 10</a>). | >Fig. 10</a>). | ||
| - | This is particularly remarkable as our results contradict to previous studies of NRPS domains that | + | This is particularly remarkable as our results contradict to previous studies of NRPS domains that reported the native T-domain of the indigoidine synthetase BpsA to be essential for protein function (and therefore not replaceable by other T-domains)[7]. |
| - | + | ||
| - | reported the native T-domain of the indigoidine synthetase BpsA to be essential for protein function | + | |
| - | + | ||
| - | (and therefore not replaceable by other T-domains)[7]. | + | |
<br/><br/> | <br/><br/> | ||
| - | In conclusion, we were able to demonstrate that it is indeed possible to replace single domains from | + | In conclusion, we were able to demonstrate that it is indeed possible to replace single domains from NRPS modules, while preserving or even enhancing their functionality. In addition, we established an approach for the design of synthetic T-domains and proved their functionality by introducing them into the indigoidine synthetase indC scaffold. Moreover, we established a high throughput protocol for circular polymerase extension cloning and transformation (Hi-CT) (<a href="https://2013.igem.org/Team:Heidelberg/RFCs#rfc99">BBF RFC 99</a>) based on CPEC assembly [13], which we applied for our domain shuffling approach. In summary, we created a library of 58 engineered indC variants. In addition we perforemd measurement of blue pigement production over time, which gave us novel insights in how NRPS domains should be designed, where the domain borders between different domains in a single NRPS module have to be set and which domains from respective NRPS pathways and bacterial strains can be used, when creating novel engineered NRPS pathways. We implemented our findings into the <a href="https://2013.igem.org/Team:Heidelberg/Project_Software">"NRPS-Designer" Software</a>, so that the underlying algorithm for NRPS design takes into consideration the abovementioned findings (e.g. domain border setting) which are certainly crucial for successful in silico prediction of functional NRPSs. The crystal structure of our optimized indigoidine synthetase, which is currently investigated by the group of Dr. Bange (Philipps-University Marburg), will give more insight into structural aspects of non-ribosomal peptide synthesis.<br/> |
| - | + | Thereby, our project pioneers the research on high-throughput methods for creation and optimization of synthetic NRPS modules composed of user-defined domains. We believe that our findings will highly contribute to future development of custom NRPSs. | |
| - | NRPS modules, while preserving or even enhancing their functionality. In addition, we established an | + | |
| - | + | ||
| - | approach for the design of synthetic T-domains and proved their functionality by introducing them into | + | |
| - | + | ||
| - | the indigoidine synthetase indC scaffold. Moreover, we established a high throughput protocol for | + | |
| - | + | ||
| - | circular polymerase extension cloning and transformation (Hi-CT) (<a | + | |
| - | + | ||
| - | href="https://2013.igem.org/Team:Heidelberg/RFCs#rfc99">BBF RFC 99</a>) based on CPEC assembly [13], | + | |
| - | + | ||
| - | which we applied for our domain shuffling approach. In summary, we created a library of 58 engineered | + | |
| - | + | ||
| - | indC variants. In addition we perforemd measurement of blue pigement production over time, which gave | + | |
| - | + | ||
| - | us novel insights in how NRPS domains should be designed, where the domain borders between different | + | |
| - | + | ||
| - | domains in a single NRPS module have to be set and which domains from respective NRPS pathways and | + | |
| - | + | ||
| - | bacterial strains can be used, when creating novel engineered NRPS pathways. We implemented our | + | |
| - | + | ||
| - | findings into the <a href="https://2013.igem.org/Team:Heidelberg/Project_Software">"NRPS-Designer" | + | |
| - | + | ||
| - | Software</a>, so that the underlying algorithm for NRPS design takes into consideration the | + | |
| - | + | ||
| - | abovementioned findings (e.g. domain border setting) which are certainly crucial for successful in | + | |
| - | + | ||
| - | silico prediction of functional NRPSs. The crystal structure of our optimized indigoidine synthetase, | + | |
| - | + | ||
| - | which is currently investigated by the group of Dr. Bange (Philipps-University Marburg), will give more | + | |
| - | + | ||
| - | insight into structural aspects of non-ribosomal peptide synthesis.<br/> | + | |
| - | Thereby, our project pioneers the research on high-throughput methods for creation and optimization of | + | |
| - | + | ||
| - | synthetic NRPS modules composed of user-defined domains. We believe that our findings will highly | + | |
| - | + | ||
| - | contribute to future development of custom NRPSs. | + | |
</p> | </p> | ||
| Line 1,954: | Line 538: | ||
<h3>Cloning Strategy</h3> | <h3>Cloning Strategy</h3> | ||
| - | We assembled the different indC variants on a chloramphenicol resistance backbone (pSB1C3) with an | + | We assembled the different indC variants on a chloramphenicol resistance backbone (pSB1C3) with an IPTG-inducable lac-promoter, the ribosome binding site BBa_B0034 and the coding sequence of the respective indC variant. The indC plasmids should be co-transformed with a PPTase construct to get a significant and fast indigoidine production. Therefore, we used a second plasmid backbone carrying a kanamycin resistance (pSB3K3). We assembled five pSB3K3 derived plasmids, each carrying an expression cassette with an IPTG induceable lac-promotor, the BBa_B0029 ribosome binding site and the coding sequence of the respective PPTase (sfp, svp, entD, delC and ngrA). |
| - | + | We used <em>E. coli</em> TOP10 for co-transformations of the possible combination of the indC variants and all PPTase plasmids. | |
| - | IPTG-inducable lac-promoter, the ribosome binding site BBa_B0034 and the coding sequence of the | + | |
| - | + | ||
| - | respective indC variant. The indC plasmids should be co-transformed with a PPTase construct to get a | + | |
| - | + | ||
| - | significant and fast indigoidine production. Therefore, we used a second plasmid backbone carrying a | + | |
| - | + | ||
| - | kanamycin resistance (pSB3K3). We assembled five pSB3K3 derived plasmids, each carrying an expression | + | |
| - | + | ||
| - | cassette with an IPTG induceable lac-promotor, the BBa_B0029 ribosome binding site and the coding | + | |
| - | + | ||
| - | sequence of the respective PPTase (sfp, svp, entD, delC and ngrA). | + | |
| - | We used <em>E. coli</em> TOP10 for co-transformations of the possible combination of the indC variants | + | |
| - | + | ||
| - | and all PPTase plasmids. | + | |
<h3>Circular Polymerase Extension Cloning</h3> | <h3>Circular Polymerase Extension Cloning</h3> | ||
<p> | <p> | ||
| - | Circular Polymerase Extension Cloning (CPEC) is a sequence-independent cloning method based on | + | Circular Polymerase Extension Cloning (CPEC) is a sequence-independent cloning method based on homologous recombination of double-strand DNA overlaps of vector and insert(s) (<a class="fancybox fancyGraphical" href="https://static.igem.org/mediawiki/2013/6/6c/Heidelberg_IndPD_Fig3.png" caption="<b>Figure 11: Circular polymerase extension cloning: a sequence-independent, homologous recombination based cloning approach</b>Insert and backbone fragments sharing overlapping regions at their ends are transferred into a single reaction set-up in molecular ratios determined by equation 1 (compare to 5.1.4). 2) The insert/backbone reaction mixture is heat-denaturized and subsequently cooled down to 53°C to allow for annealing of the complementary overlaps. 3) By polymerase chain reaction, the single strand hybrid-regions are filled up to double strands yielding circular, double-stranded molecules with nicks at overlapping regions. 4) Plasmids resulting from CPEC can be used directly for transformation.">Fig. 11</a> |
| - | + | )(Quan 2008). It is suitable for the generation of combinatorial, synthetic construct libraries as it allows for multi-fragment assembly in an accurate, efficient and economical manner. | |
| - | homologous recombination of double-strand DNA overlaps of vector and insert(s) (<a class="fancybox | + | |
| - | + | ||
| - | fancyGraphical" href="https://static.igem.org/mediawiki/2013/6/6c/Heidelberg_IndPD_Fig3.png" | + | |
| - | + | ||
| - | caption="<b>Figure 11: Circular polymerase extension cloning: a sequence-independent, homologous | + | |
| - | + | ||
| - | recombination based cloning approach</b>Insert and backbone fragments sharing overlapping regions at | + | |
| - | + | ||
| - | their ends are transferred into a single reaction set-up in molecular ratios determined by equation 1 | + | |
| - | + | ||
| - | (compare to 5.1.4). 2) The insert/backbone reaction mixture is heat-denaturized and subsequently | + | |
| - | + | ||
| - | cooled down to 53°C to allow for annealing of the complementary overlaps. 3) By polymerase chain | + | |
| - | + | ||
| - | reaction, the single strand hybrid-regions are filled up to double strands yielding circular, double- | + | |
| - | + | ||
| - | stranded molecules with nicks at overlapping regions. 4) Plasmids resulting from CPEC can be used | + | |
| - | + | ||
| - | directly for transformation.">Fig. 11</a> | + | |
| - | )(Quan 2008). It is suitable for the generation of combinatorial, synthetic construct libraries as it | + | |
| - | + | ||
| - | allows for multi-fragment assembly in an accurate, efficient and economical manner. | + | |
</p> | </p> | ||
<br/> | <br/> | ||
<center> | <center> | ||
| - | <a class="fancybox fancyGraphical" | + | <a class="fancybox fancyGraphical" href="https://static.igem.org/mediawiki/2013/6/6c/Heidelberg_IndPD_Fig3.png" caption="<b>Figure 11: Circular polymerase extension cloning: a sequence-independent, homologous recombination based cloning approach</b>Insert and backbone fragments sharing overlapping regions at their ends are transferred into a single reaction set-up in molecular ratios determined by equation 1 (compare to 5.1.4). 2) The insert/backbone reaction mixture is heat-denaturized and subsequently cooled down to 53°C to allow for annealing of the complementary overlaps. 3) By polymerase chain reaction, the single strand hybrid-regions are filled up to double strands yielding circular, double-stranded molecules with nicks at overlapping regions. 4) Plasmids resulting from CPEC can be used directly for transformation."> |
| - | + | <img style="width:40%; margin-bottom:10px; padding:1%;border-style:solid;border-width:1px;border-radius: 5px;" src="https://static.igem.org/mediawiki/2013/6/6c/Heidelberg_IndPD_Fig3.png"></img> | |
| - | href="https://static.igem.org/mediawiki/2013/6/6c/Heidelberg_IndPD_Fig3.png" caption="<b>Figure 11: Circular | + | <figcaption style="width:80%;"><b>Figure 11: Circular polymerase extension cloning: a sequence-independent, homologous recombination based cloning approach</b>Insert and backbone fragments sharing overlapping regions at their ends are transferred into a single reaction set-up in molecular ratios determined by equation 1 (compare to 5.1.4). 2) The insert/backbone reaction mixture is heat-denaturized and subsequently cooled down to 53°C to allow for annealing of the complementary overlaps. 3) By polymerase chain reaction, the single strand hybrid-regions are filled up to double strands yielding circular, double-stranded molecules with nicks at overlapping regions. 4) Plasmids resulting from CPEC can be used directly for transformation. |
| - | + | ||
| - | polymerase extension cloning: a sequence-independent, homologous recombination based cloning | + | |
| - | + | ||
| - | approach</b>Insert and backbone fragments sharing overlapping regions at their ends are transferred | + | |
| - | + | ||
| - | into a single reaction set-up in molecular ratios determined by equation 1 (compare to 5.1.4). 2) The | + | |
| - | + | ||
| - | insert/backbone reaction mixture is heat-denaturized and subsequently cooled down to 53°C to allow for | + | |
| - | + | ||
| - | annealing of the complementary overlaps. 3) By polymerase chain reaction, the single strand hybrid- | + | |
| - | + | ||
| - | regions are filled up to double strands yielding circular, double-stranded molecules with nicks at | + | |
| - | + | ||
| - | overlapping regions. 4) Plasmids resulting from CPEC can be used directly for transformation."> | + | |
| - | <img style="width:40%; margin-bottom:10px; padding:1%;border-style:solid;border-width:1px;border- | + | |
| - | + | ||
| - | radius: 5px;" src="https://static.igem.org/mediawiki/2013/6/6c/Heidelberg_IndPD_Fig3.png"></img> | + | |
| - | <figcaption style="width:80%;"><b>Figure 11: Circular polymerase extension cloning: a sequence- | + | |
| - | + | ||
| - | independent, homologous recombination based cloning approach</b>Insert and backbone fragments sharing | + | |
| - | + | ||
| - | overlapping regions at their ends are transferred into a single reaction set-up in molecular ratios | + | |
| - | + | ||
| - | determined by equation 1 (compare to 5.1.4). 2) The insert/backbone reaction mixture is heat- | + | |
| - | + | ||
| - | denaturized and subsequently cooled down to 53°C to allow for annealing of the complementary overlaps. | + | |
| - | + | ||
| - | 3) By polymerase chain reaction, the single strand hybrid-regions are filled up to double strands | + | |
| - | + | ||
| - | yielding circular, double-stranded molecules with nicks at overlapping regions. 4) Plasmids resulting | + | |
| - | + | ||
| - | from CPEC can be used directly for transformation. | + | |
</figcaption> | </figcaption> | ||
</a> | </a> | ||
| Line 2,040: | Line 556: | ||
<br/> | <br/> | ||
<p> | <p> | ||
| - | CPEC relies on a simple polymerase extension of the DNA fragments to be assembled. Crucial to this | + | CPEC relies on a simple polymerase extension of the DNA fragments to be assembled. Crucial to this concept is the design of vector and insert fragments which must share overlapping regions at the ends (<a class="fancybox fancyFigure" title="CPEC method" href="https://static.igem.org/mediawiki/2013/6/6c/Heidelberg_IndPD_Fig3.png" rel="gallery1">Figure 11(1)</a>). In a single reaction set-up, insert DNA fragments and linear vector are heat denaturized and allowed to anneal at elevated temperature, resulting in specific hybridized insert-vector constructs (<a class="fancybox fancyFigure" title="CPEC method" href="https://static.igem.org/mediawiki/2013/6/6c/Heidelberg_IndPD_Fig3.png" rel="gallery1">Figure 11(2)</a>). Subsequently, the single-strand hybrid constructs are extended under PCR-elongation conditions (72 °C for 20 s/kbp of longest fragment) which yield completely assembled, double-stranded circular constructs (<a class="fancybox fancyFigure" title="CPEC method" href="https://static.igem.org/mediawiki/2013/6/6c/Heidelberg_IndPD_Fig3.png" rel="gallery1">Figure 11(3)</a>) ready for transformation into competent cells. The single strands nicks introduced on each strand due to the unidirectional nature of the polymerase chain reaction will be removed by endogenous ligases upon transformation into <em>Escherichia coli</em>. |
| - | + | ||
| - | concept is the design of vector and insert fragments which must share overlapping regions at the ends | + | |
| - | + | ||
| - | (<a class="fancybox fancyFigure" title="CPEC method" | + | |
| - | + | ||
| - | href="https://static.igem.org/mediawiki/2013/6/6c/Heidelberg_IndPD_Fig3.png" rel="gallery1">Figure 11(1) | + | |
| - | + | ||
| - | </a>). In a single reaction set-up, insert DNA fragments and linear vector are heat denaturized and | + | |
| - | + | ||
| - | allowed to anneal at elevated temperature, resulting in specific hybridized insert-vector constructs | + | |
| - | + | ||
| - | (<a class="fancybox fancyFigure" title="CPEC method" | + | |
| - | + | ||
| - | href="https://static.igem.org/mediawiki/2013/6/6c/Heidelberg_IndPD_Fig3.png" rel="gallery1">Figure 11(2) | + | |
| - | + | ||
| - | </a>). Subsequently, the single-strand hybrid constructs are extended under PCR-elongation conditions | + | |
| - | + | ||
| - | (72 °C for 20 s/kbp of longest fragment) which yield completely assembled, double-stranded circular | + | |
| - | + | ||
| - | constructs (<a class="fancybox fancyFigure" title="CPEC method" | + | |
| - | + | ||
| - | href="https://static.igem.org/mediawiki/2013/6/6c/Heidelberg_IndPD_Fig3.png" rel="gallery1">Figure 11(3)</a>) | + | |
| - | + | ||
| - | ready for transformation into competent cells. The single strands nicks introduced on each strand due | + | |
| - | + | ||
| - | to the unidirectional nature of the polymerase chain reaction will be removed by endogenous ligases | + | |
| - | + | ||
| - | upon transformation into <em>Escherichia coli</em>. | + | |
<br/> | <br/> | ||
| - | We provide instructions (<a href="https://2013.igem.org/Team:Heidelberg/RFCs#rfc99">RFC 99</a>) for a | + | We provide instructions (<a href="https://2013.igem.org/Team:Heidelberg/RFCs#rfc99">RFC 99</a>) for a rapid and cost efficient cloning and transformation method based on CPEC which allows for the manufacturing of multi-fragment plasmid constructs in a parallelized manner: High Throughput Circular Extension Cloning and Transformation (HiCT) |
| - | + | ||
| - | rapid and cost efficient cloning and transformation method based on CPEC which allows for the | + | |
| - | + | ||
| - | manufacturing of multi-fragment plasmid constructs in a parallelized manner: High Throughput Circular | + | |
| - | + | ||
| - | Extension Cloning and Transformation (HiCT) | + | |
</p> | </p> | ||
<p> | <p> | ||
CPEC was performed according to the following protocol: | CPEC was performed according to the following protocol: | ||
| - | The total mass of DNA used per CPEC reaction varied between 50 to 200 ng. The insert to backbone molar | + | The total mass of DNA used per CPEC reaction varied between 50 to 200 ng. The insert to backbone molar ratio was 3:1 for insert-backbone and 1:1 for insert-insert molar ratio. Conversion from mass concentration of fragments to molar concentration was done using the formula: cM = c*10^6/(n*660), where c is the measured oligonucleotide concentration [ng/µl], n is the number of dinucleotides of the fragment and cM is the resulting concentration [nM]. |
| - | + | ||
| - | ratio was 3:1 for insert-backbone and 1:1 for insert-insert molar ratio. Conversion from mass | + | |
| - | + | ||
| - | concentration of fragments to molar concentration was done using the formula: cM = c*10^6/(n*660), | + | |
| - | + | ||
| - | where c is the measured oligonucleotide concentration [ng/µl], n is the number of dinucleotides of the | + | |
| - | + | ||
| - | fragment and cM is the resulting concentration [nM]. | + | |
| - | + | ||
| - | + | ||
| - | + | ||
| - | + | ||
| - | conditions: | + | The final reaction volume was adjusted to 6 µl with polymerase master mix (Phusion® High-Fidelity PCR Master Mix with HF Buffer, NEB #M0531S/L). The CPEC reaction was carried out under the following conditions: |
</html> | </html> | ||
| Line 2,106: | Line 576: | ||
<html> | <html> | ||
| - | After CPEC, 5 µl of of the reaction mixture were used for transformation. The remaining volume was used | + | After CPEC, 5 µl of of the reaction mixture were used for transformation. The remaining volume was used for quality check on a gel with small pockets (10 to 20 µl in volume). |
| - | + | ||
| - | for quality check on a gel with small pockets (10 to 20 µl in volume). | + | |
</p> | </p> | ||
<h3>Generation of cdB-indC Construct</h3> | <h3>Generation of cdB-indC Construct</h3> | ||
<p> | <p> | ||
| - | To minimize the background colonies when exchanging the T-domain of the indigoidine synthetase we | + | To minimize the background colonies when exchanging the T-domain of the indigoidine synthetase we generated the ccdB-Ind plasmid where we replaced the indC T-domain with the ccdB gene (Modul structure: AoxA-ccdb-TE) which kills <em>E. coli</em> TOP10 cells but not <em>E. coli</em> OneShot ccdB survival cells. Test-transformation in both <em>E. coli</em> TOP10 and the <em>E. coli</em> OneShot ccdB survival cells showed that background colonies could be eliminated by this strategy. |
| - | + | We used the ccdB-Ind for all further CPEC experiments aiming to swap T-domains. Primers for the backbone CPEC fragments were designed to facilitate the amplification of the entire ccdB-Ind plasmid while omitting the ccdB sequence. Assembly of the finale indigoidine synthase products with exchanged T-domain was achieved by CPEC as described or above or HiCT (<a href="https://2013.igem.org/Team:Heidelberg/RFCs#rfc99">RFC 99</a>). | |
| - | generated the ccdB-Ind plasmid where we replaced the indC T-domain with the ccdB gene (Modul | + | |
| - | + | ||
| - | structure: AoxA-ccdb-TE) which kills <em>E. coli</em> TOP10 cells but not <em>E. coli</em> OneShot ccdB | + | |
| - | + | ||
| - | survival cells. Test-transformation in both <em>E. coli</em> TOP10 and the <em>E. coli</em> OneShot | + | |
| - | + | ||
| - | ccdB survival cells showed that background colonies could be eliminated by this strategy. | + | |
| - | We used the ccdB-Ind for all further CPEC experiments aiming to swap T-domains. Primers for the | + | |
| - | + | ||
| - | backbone CPEC fragments were designed to facilitate the amplification of the entire ccdB-Ind plasmid | + | |
| - | + | ||
| - | while omitting the ccdB sequence. Assembly of the finale indigoidine synthase products with exchanged | + | |
| - | + | ||
| - | T-domain was achieved by CPEC as described or above or HiCT (<a | + | |
| - | + | ||
| - | href="https://2013.igem.org/Team:Heidelberg/RFCs#rfc99">RFC 99</a>). | + | |
</p> | </p> | ||
<h3>Examination of T-domain Borders</h3> | <h3>Examination of T-domain Borders</h3> | ||
<p> | <p> | ||
| - | We exchanged the T-domain of indC with the T-domain of bpsA and varied the size of the exchanged DNA | + | We exchanged the T-domain of indC with the T-domain of bpsA and varied the size of the exchanged DNA sequence, thus examining several domain borders (Figure 5a). We used the CPEC assembly method and the indC-ccdB plasmid for this approach. |
| - | + | For the investigation of additional T-domains from less related NRPS modules, we selected the border combination A2 which was positive in the test with bpsA. We used the T-domains of the following genes: | |
| - | sequence, thus examining several domain borders (Figure 5a). We used the CPEC assembly method and the | + | |
| - | + | ||
| - | indC-ccdB plasmid for this approach. | + | |
| - | For the investigation of additional T-domains from less related NRPS modules, we selected the border | + | |
| - | + | ||
| - | combination A2 which was positive in the test with bpsA. We used the T-domains of the following genes: | + | |
</html> | </html> | ||
| Line 2,154: | Line 600: | ||
| entF || <em>Escherichia coli</em> K-12|| NRPS module of enterobactin synthesis pathway | | entF || <em>Escherichia coli</em> K-12|| NRPS module of enterobactin synthesis pathway | ||
|- | |- | ||
| - | |tycA1|| <em>Brevibacillus parabrevis</em>|| 1st module in tyrocidine | + | |tycA1|| <em>Brevibacillus parabrevis</em>|| 1st module in tyrocidine synthesis cluster |
| - | + | ||
| - | synthesis cluster | + | |
|- | |- | ||
| - | |tycC6|| <em>Brevibacillus parabrevis</em>|| Last module in tyrocidine | + | |tycC6|| <em>Brevibacillus parabrevis</em>|| Last module in tyrocidine synthesis cluster |
| - | + | ||
| - | synthesis cluster | + | |
|- | |- | ||
| - | |delH4|| <em>Delftia acidovorans</em> SPH-1|| 2nd but last module in | + | |delH4|| <em>Delftia acidovorans</em> SPH-1|| 2nd but last module in delftibactin synthesis cluster |
| - | + | ||
| - | delftibactin synthesis cluster | + | |
|- | |- | ||
| - | |delH5|| <em>Delftia acidovorans</em> SPH-1|| Last module in delftibaction | + | |delH5|| <em>Delftia acidovorans</em> SPH-1|| Last module in delftibaction synthesis cluster |
| - | + | ||
| - | synthesis cluster | + | |
|- | |- | ||
| - | |plu2642|| <em>P. luminescens</em> DSM15139|| NRPS of unknown function (one | + | |plu2642|| <em>P. luminescens</em> DSM15139|| NRPS of unknown function (one module: A-T-TE) |
| - | + | ||
| - | module: A-T-TE) | + | |
|- | |- | ||
| - | |plu2670|| <em>P. luminescens</em> DSM15139|| module of NRPS pathway of | + | |plu2670|| <em>P. luminescens</em> DSM15139|| module of NRPS pathway of unknown function |
| - | + | ||
| - | unknown function | + | |
|} | |} | ||
</center> | </center> | ||
<html> | <html> | ||
<br/> | <br/> | ||
| - | All T-domains from the respective genomes were amplified using CPEC primers with a uniform 5’-end and a | + | All T-domains from the respective genomes were amplified using CPEC primers with a uniform 5’-end and a 3’-end specific for the respective gene. For the assembly of the hybrid-indigoidine synthetases by CPEC, the indC-ccdB construct was used. |
| - | + | ||
| - | 3’-end specific for the respective gene. For the assembly of the hybrid-indigoidine synthetases by | + | |
| - | + | ||
| - | CPEC, the indC-ccdB construct was used. | + | |
</p> | </p> | ||
| Line 2,192: | Line 622: | ||
All R scripts used in the following sections are based on R version R-3.0.1. | All R scripts used in the following sections are based on R version R-3.0.1. | ||
| - | Different assumptions about the evolutionary conservation of T-domains were examined: i) conservation | + | Different assumptions about the evolutionary conservation of T-domains were examined: i) conservation of a specific module across different species, ii) conservation of T-domains across different modules for the same species, iii) conservation of T-domains across different species, iv) conservation of similar modules across different species. According to these three assumptions, different libraries of homologous protein sequences were generated using ncbi protein BLAST (blast.ncbi.nlm.nih.gov) with standard parameters: |
| - | + | ||
| - | of a specific module across different species, ii) conservation of T-domains across different modules | + | |
| - | + | ||
| - | for the same species, iii) conservation of T-domains across different species, iv) conservation of | + | |
| - | + | ||
| - | similar modules across different species. According to these three assumptions, different libraries of | + | |
| - | + | ||
| - | homologous protein sequences were generated using ncbi protein BLAST (blast.ncbi.nlm.nih.gov) with | + | |
| - | + | ||
| - | standard parameters: | + | |
</html> | </html> | ||
# query sequence: indC; Search set: non-redundant protein sequences without organism restriction | # query sequence: indC; Search set: non-redundant protein sequences without organism restriction | ||
| - | # query sequence: indC T-domain; Search set: non-redundant protein sequences within <em>P. | + | # query sequence: indC T-domain; Search set: non-redundant protein sequences within <em>P. luminescens</em> |
| - | + | # query sequence: indC T-domain; Search set: non-redundant protein sequences without organism restriction | |
| - | luminescens</em> | + | # query sequences: indC, bpsA, entF, delH5 and tycC6; Search set: non-redundant protein sequences without organism restriction; |
| - | # query sequence: indC T-domain; Search set: non-redundant protein sequences without organism | + | |
| - | + | ||
| - | restriction | + | |
| - | # query sequences: indC, bpsA, entF, delH5 and tycC6; Search set: non-redundant protein sequences | + | |
| - | + | ||
| - | without organism restriction; | + | |
<html> | <html> | ||
| - | The 50 closest related protein sequences contained in each the library were subjected to a multiple | + | The 50 closest related protein sequences contained in each the library were subjected to a multiple sequence alignment (MSA) using clustalO (<a href="http://www.ebi.ac.uk/Tools/msa/clustalo/">http://www.ebi.ac.uk/Tools/msa/clustalo/</a>). with standard parameters for protein alignments. For library generation iv), each query sequence was BLASTed separately and the 50 best results of each query were combined i.e. a total of 250 sequences for the MSA. |
| - | + | ||
| - | sequence alignment (MSA) using clustalO (<a | + | |
| - | + | ||
| - | href="http://www.ebi.ac.uk/Tools/msa/clustalo/">http://www.ebi.ac.uk/Tools/msa/clustalo/</a>). with | + | |
| - | + | ||
| - | standard parameters for protein alignments. For library generation iv), each query sequence was BLASTed | + | |
| - | + | ||
| - | separately and the 50 best results of each query were combined i.e. a total of 250 sequences for the | + | |
| - | + | ||
| - | MSA. | + | |
| - | + | ||
| - | + | ||
| - | domains. | + | After library generation, the following three methods were employed to design different synthetic T-domains. |
</p> | </p> | ||
<h4>1. Consensus Method</h4> | <h4>1. Consensus Method</h4> | ||
<p> | <p> | ||
| - | Based on the .clustal file obtained from the MSA of the homology libraries, a consensus sequence using | + | Based on the .clustal file obtained from the MSA of the homology libraries, a consensus sequence using the UGENE software (<a href="http://ugene.unipro.ru/">http://ugene.unipro.ru/</a>) with a threshold of 50% was created (i.e. if an amino acid appears in 50% or more of all sequences at a specific position it is considered as a consensus amino acid). For the creation of the synthetic T-domains, this consensus sequence was used to fill the gaps where there was no consensus amino acid with the original amino acid from the indC T-domain. By this approach, T-domains were generated which might deviate from the original sequence at positions with at least average conservation but coreespond to the original one if there is less conservation. |
| - | + | ||
| - | the UGENE software (<a href="http://ugene.unipro.ru/">http://ugene.unipro.ru/</a>) with a threshold of | + | |
| - | + | ||
| - | 50% was created (i.e. if an amino acid appears in 50% or more of all sequences at a specific position | + | |
| - | + | ||
| - | it is considered as a consensus amino acid). For the creation of the synthetic T-domains, this | + | |
| - | + | ||
| - | consensus sequence was used to fill the gaps where there was no consensus amino acid with the original | + | |
| - | + | ||
| - | amino acid from the indC T-domain. By this approach, T-domains were generated which might deviate from | + | |
| - | + | ||
| - | the original sequence at positions with at least average conservation but coreespond to the original | + | |
| - | + | ||
| - | one if there is less conservation. | + | |
</p> | </p> | ||
<h4>2. Guided Random Method</h4> | <h4>2. Guided Random Method</h4> | ||
<p> | <p> | ||
| - | In this approach, the multiple sequence alignments (MSA) generated by the consensus method was used. | + | In this approach, the multiple sequence alignments (MSA) generated by the consensus method was used. Implemented in R, a position-specific profile was generated which has the same length as the MSA and contains the rate at which amino acids occur at any given position of the sequence alignment. The synthetic T-domain is created by position-wise generation of the sequence where the probability of choosing an amino acid at a given position is determined by the rate in the profile. |
| - | + | ||
| - | Implemented in R, a position-specific profile was generated which has the same length as the MSA and | + | |
| - | + | ||
| - | contains the rate at which amino acids occur at any given position of the sequence alignment. The | + | |
| - | + | ||
| - | synthetic T-domain is created by position-wise generation of the sequence where the probability of | + | |
| - | + | ||
| - | choosing an amino acid at a given position is determined by the rate in the profile. | + | |
</p> | </p> | ||
<h4>3. Randomized Generation Method</h4> | <h4>3. Randomized Generation Method</h4> | ||
<p> | <p> | ||
| - | For generation of synthetic sequences by the randomized generation method, every amino acid was | + | For generation of synthetic sequences by the randomized generation method, every amino acid was assigned a score of 1 or 0, i.e. occuring at least ones or not at all at a given position in the MSA. In the subsequent generation of the synthetic T-domain sequence of the synthetic domain, any amino acid assigned 1 had the same likelihood of being chosen at this position. |
| - | + | Seven synthetic T-domains were designed based on differnt combinations of the homology libraries and sequence generation methods. | |
| - | assigned a score of 1 or 0, i.e. occuring at least ones or not at all at a given position in the MSA. | + | |
| - | + | ||
| - | In the subsequent generation of the synthetic T-domain sequence of the synthetic domain, any amino acid | + | |
| - | + | ||
| - | assigned 1 had the same likelihood of being chosen at this position. | + | |
| - | Seven synthetic T-domains were designed based on differnt combinations of the homology libraries and | + | |
| - | + | ||
| - | sequence generation methods. | + | |
</p> | </p> | ||
<br/> | <br/> | ||
| Line 2,281: | Line 653: | ||
<center> | <center> | ||
{|class="wikitable" style="font-size:100%;" | {|class="wikitable" style="font-size:100%;" | ||
| - | |+Table 3: Overview of the homology libraries and sequence generation methods employed for the | + | |+Table 3: Overview of the homology libraries and sequence generation methods employed for the generation of seven synthetic T-domains |
| - | + | ||
| - | generation of seven synthetic T-domains | + | |
|- | |- | ||
!Domain ID !!Homology library !!Sequence generation method | !Domain ID !!Homology library !!Sequence generation method | ||
| Line 2,305: | Line 675: | ||
<br/> | <br/> | ||
<p> | <p> | ||
| - | <a class="fancybox fancyGraphical" | + | <a class="fancybox fancyGraphical" href="https://static.igem.org/mediawiki/2013/4/4b/Heidelberg_IndPD_Fig4.png" caption="<b>Figure 12: Multiple Sequence Alignment of seven synthetic T-domains generated by consensus and guided random methods.</b> |
| - | + | The multiple sequence alignment (MSA) was generated using clustalo (www.ebi.ac.uk/Tools/msa/clustalo/) with standard parameters. The color code is adapted from ClustalX: here, the amino acids are colored according to their chemical and structural properties. The first line (with the label indC) refers to the native T-domain sequence of the indigoidine synthetase indC from <i>P. luminescens</i>, whereas the following line refer to the seven synthetic T-domains created by the Consensus method (synT1 to synT4), the Guided random method (synT5 and synT6) and the Randomized generation method (synT7). | |
| - | href="https://static.igem.org/mediawiki/2013/4/4b/Heidelberg_IndPD_Fig4.png" caption="<b>Figure 12: Multiple | + | When inserted into the indC indigoidine synthetase - thus replacing the native T-domain - four of the synthetic T-domains resulted in a functional enzyme producing the blue pigment indigoidine, namely synT1, synT3, synT4 and synT5. |
| - | + | Notably, the engineered indC variants containing the T-domains synT1, synT3 and synT4 showed to be more efficient in the production of indigoidine than the wild-type indC (see Fig. 10).">Fig. 12</a> | |
| - | Sequence Alignment of seven synthetic T-domains generated by consensus and guided random methods.</b> | + | |
| - | The multiple sequence alignment (MSA) was generated using clustalo (www.ebi.ac.uk/Tools/msa/clustalo/) | + | |
| - | + | ||
| - | with standard parameters. The color code is adapted from ClustalX: here, the amino acids are colored | + | |
| - | + | ||
| - | according to their chemical and structural properties. The first line (with the label indC) refers to | + | |
| - | + | ||
| - | the native T-domain sequence of the indigoidine synthetase indC from <i>P. luminescens</i>, whereas the | + | |
| - | + | ||
| - | following line refer to the seven synthetic T-domains created by the Consensus method (synT1 to synT4), | + | |
| - | + | ||
| - | the Guided random method (synT5 and synT6) and the Randomized generation method (synT7). | + | |
| - | When inserted into the indC indigoidine synthetase - thus replacing the native T-domain - four of the | + | |
| - | + | ||
| - | synthetic T-domains resulted in a functional enzyme producing the blue pigment indigoidine, namely | + | |
| - | + | ||
| - | synT1, synT3, synT4 and synT5. | + | |
| - | Notably, the engineered indC variants containing the T-domains synT1, synT3 and synT4 showed to be more | + | |
| - | + | ||
| - | efficient in the production of indigoidine than the wild-type indC (see Fig. 10).">Fig. 12</a> | + | |
shows the multiple sequence alignment of the seven synthetic T-domains and the native indC T-domain. | shows the multiple sequence alignment of the seven synthetic T-domains and the native indC T-domain. | ||
| - | After the generation of the T-domain amino acid sequences, the OPTIMIZER web-tool(<a | + | After the generation of the T-domain amino acid sequences, the OPTIMIZER web-tool(<a href="http://genomes.urv.es/OPTIMIZER/">http://genomes.urv.es/OPTIMIZER/</a>) was used to obtain the corresponding DNA sequence [16]. <em>E. coli</em> K-12 was set as strain for codon optimization and <em>most frequent</em> was chosen as codon option. The generated DNA sequence was cured from internal RFC10 cutting sites and CPEC cloning overhang required for the T-domain swapping into the ccdb construct were introduced. The synthetic T-domains were ordered at IDT (Integrated DNA Technologies, Coralville, Iowa). In order to obtain sufficient amounts of DNA, the synthetic T-domains were amplified via PCR. IndC-hybrid constructs of the native IndC with exchange of the native T-domain by the synthetic variants were assembled using CPEC and the indC-ccdB construct as backbone. The synthetic T-domains were amplified for CPEC using the same primers as for the native indC T-domain. |
| - | + | ||
| - | href="http://genomes.urv.es/OPTIMIZER/">http://genomes.urv.es/OPTIMIZER/</a>) was used to obtain the | + | |
| - | + | ||
| - | corresponding DNA sequence [16]. <em>E. coli</em> K-12 was set as strain for codon optimization and | + | |
| - | + | ||
| - | <em>most frequent</em> was chosen as codon option. The generated DNA sequence was cured from internal | + | |
| - | + | ||
| - | RFC10 cutting sites and CPEC cloning overhang required for the T-domain swapping into the ccdb | + | |
| - | + | ||
| - | construct were introduced. The synthetic T-domains were ordered at IDT (Integrated DNA Technologies, | + | |
| - | + | ||
| - | Coralville, Iowa). In order to obtain sufficient amounts of DNA, the synthetic T-domains were amplified | + | |
| - | + | ||
| - | via PCR. IndC-hybrid constructs of the native IndC with exchange of the native T-domain by the | + | |
| - | + | ||
| - | synthetic variants were assembled using CPEC and the indC-ccdB construct as backbone. The synthetic T- | + | |
| - | + | ||
| - | domains were amplified for CPEC using the same primers as for the native indC T-domain. | + | |
</p> | </p> | ||
<br/> | <br/> | ||
<center> | <center> | ||
| - | <a class="fancybox fancyGraphical" | + | <a class="fancybox fancyGraphical" href="https://static.igem.org/mediawiki/2013/4/4b/Heidelberg_IndPD_Fig4.png" caption="<b>Figure 12: Multiple Sequence Alignment of seven synthetic T-domains generated by consensus and guided random methods.</b> |
| - | + | The multiple sequence alignment (MSA) was generated using clustalo (www.ebi.ac.uk/Tools/msa/clustalo/) with standard parameters. The color code is adapted from ClustalX: here, the amino acids are colored according to their chemical and structural properties. The first line (with the label indC) refers to the native T-domain sequence of the indigoidine synthetase indC from <i>P. luminescens</i>, whereas the following line refer to the seven synthetic T-domains created by the Consensus method (synT1 to synT4), the Guided random method (synT5 and synT6) and the Randomized generation method (synT7). | |
| - | href="https://static.igem.org/mediawiki/2013/4/4b/Heidelberg_IndPD_Fig4.png" caption="<b>Figure 12: Multiple | + | When inserted into the indC indigoidine synthetase - thus replacing the native T-domain - four of the synthetic T-domains resulted in a functional enzyme producing the blue pigment indigoidine, namely synT1, synT3, synT4 and synT5. |
| - | + | Notably, the engineered indC variants containing the T-domains synT1, synT3 and synT4 showed to be more efficient in the production of indigoidine than the wild-type indC (see Fig. 10)."> | |
| - | Sequence Alignment of seven synthetic T-domains generated by consensus and guided random methods.</b> | + | <img style="width:90%; margin-bottom:10px; padding:1%;border-style:solid;border-width:1px;border-radius: 5px;" src="https://static.igem.org/mediawiki/2013/4/4b/Heidelberg_IndPD_Fig4.png"></img> |
| - | The multiple sequence alignment (MSA) was generated using clustalo (www.ebi.ac.uk/Tools/msa/clustalo/) | + | <figcaption style="width:90%;"><b>Figure 12: Multiple Sequence Alignment of seven synthetic T-domains generated by consensus and guided random methods.</b> |
| - | + | The multiple sequence alignment (MSA) was generated using clustalo (<a href="www.ebi.ac.uk/Tools/msa/clustalo/>www.ebi.ac.uk/Tools/msa/clustalo/</a>) with standard parameters. The color code is adapted from ClustalX: here, the amino acids are colored according to their chemical and structural properties. The first line (with the label "indC") refers to the native T-domain sequence of the indigoidine synthetase indC from <i>P. luminescens</i>, whereas the following line refer to the seven synthetic T-domains created by the Consensus method (synT1 to synT4), the Guided random method (synT5 and synT6) and the Randomized generation method (synT7). | |
| - | with standard parameters. The color code is adapted from ClustalX: here, the amino acids are colored | + | When inserted into the indC indigoidine synthetase - thus replacing the native T-domain - four of the synthetic T-domains resulted in a functional enzyme producing the blue pigment indigoidine, namely synT1, synT3, synT4 and synT5. |
| - | + | Notably, the engineered indC variants containing the T-domains synT1, synT3 and synT4 showed to be more efficient in the production of indigoidine than the wild-type indC (see Fig. 10). | |
| - | according to their chemical and structural properties. The first line (with the label indC) refers to | + | |
| - | + | ||
| - | the native T-domain sequence of the indigoidine synthetase indC from <i>P. luminescens</i>, whereas the | + | |
| - | + | ||
| - | following line refer to the seven synthetic T-domains created by the Consensus method (synT1 to synT4), | + | |
| - | + | ||
| - | the Guided random method (synT5 and synT6) and the Randomized generation method (synT7). | + | |
| - | When inserted into the indC indigoidine synthetase - thus replacing the native T-domain - four of the | + | |
| - | + | ||
| - | synthetic T-domains resulted in a functional enzyme producing the blue pigment indigoidine, namely | + | |
| - | + | ||
| - | synT1, synT3, synT4 and synT5. | + | |
| - | Notably, the engineered indC variants containing the T-domains synT1, synT3 and synT4 showed to be more | + | |
| - | + | ||
| - | efficient in the production of indigoidine than the wild-type indC (see Fig. 10)."> | + | |
| - | <img style="width:90%; margin-bottom:10px; padding:1%;border-style:solid;border-width:1px;border- | + | |
| - | + | ||
| - | radius: 5px;" src="https://static.igem.org/mediawiki/2013/4/4b/Heidelberg_IndPD_Fig4.png"></img> | + | |
| - | <figcaption style="width:90%;"><b>Figure 12: Multiple Sequence Alignment of seven synthetic T- | + | |
| - | + | ||
| - | domains generated by consensus and guided random methods.</b> | + | |
| - | The multiple sequence alignment (MSA) was generated using clustalo (<a | + | |
| - | + | ||
| - | href="www.ebi.ac.uk/Tools/msa/clustalo/>www.ebi.ac.uk/Tools/msa/clustalo/</a>) with standard | + | |
| - | + | ||
| - | parameters. The color code is adapted from ClustalX: here, the amino acids are colored according to | + | |
| - | + | ||
| - | their chemical and structural properties. The first line (with the label "indC") refers to the native | + | |
| - | + | ||
| - | T-domain sequence of the indigoidine synthetase indC from <i>P. luminescens</i>, whereas the following | + | |
| - | + | ||
| - | line refer to the seven synthetic T-domains created by the Consensus method (synT1 to synT4), the | + | |
| - | + | ||
| - | Guided random method (synT5 and synT6) and the Randomized generation method (synT7). | + | |
| - | When inserted into the indC indigoidine synthetase - thus replacing the native T-domain - four of the | + | |
| - | + | ||
| - | synthetic T-domains resulted in a functional enzyme producing the blue pigment indigoidine, namely | + | |
| - | + | ||
| - | synT1, synT3, synT4 and synT5. | + | |
| - | Notably, the engineered indC variants containing the T-domains synT1, synT3 and synT4 showed to be more | + | |
| - | + | ||
| - | efficient in the production of indigoidine than the wild-type indC (see Fig. 10). | + | |
</figcaption> | </figcaption> | ||
</a><br/> | </a><br/> | ||
| Line 2,412: | Line 702: | ||
<h4>1. OD Spectrum Measurement</h4> | <h4>1. OD Spectrum Measurement</h4> | ||
<p> | <p> | ||
| - | 96-well plates are prepared with 100 μl LB-medium/well containing appropriate antibiotics | + | 96-well plates are prepared with 100 μl LB-medium/well containing appropriate antibiotics (chloramphenicol and kanamycin for the indigoidine and PPTase contrcuts, respectively) and each well is inoculated with single colonies (in duplicates) from plates positive for the co-tansformation experiments i.e. from plates with blue colonies. Two sets of negative controls are also inoculated on the plate: First, pure medium serving as the baseline for background correction for the OD measurements. Second, transformation controls accounting for potential differences in cell growth due to expression of proteins contained on the plasmids, i.e. the antibitotic resistance gene and IndC. In this set of controls, the plasmid used in co-transformation with the PPTase plasmid contains IndC-constructs carrying a randomly generated sequence instead of the T-domain. A second 96 well plate was prepared with 180 µl LB-medium/well for the measurement itself. The 96-well plate containing the pre-cultures of the co-transformed colonies was inoculated for 24 hours at 37°C. Subsequently, 20 µl of the pre-culture was transferred to the measurement plate. The absorbance of the bacterial cultures was measured at wavelengths ranging from 400 nm to 800 nm in intervals of 10 nm for each well every 30 min for 30 hours at 30°C in a Tecan infinite M200 plate reader. For the measurement plate, Greiner 96-well flat black plates with a clear lid were used. |
| - | + | ||
| - | (chloramphenicol and kanamycin for the indigoidine and PPTase contrcuts, respectively) and each well is | + | |
| - | + | ||
| - | inoculated with single colonies (in duplicates) from plates positive for the co-tansformation | + | |
| - | + | ||
| - | experiments i.e. from plates with blue colonies. Two sets of negative controls are also inoculated on | + | |
| - | + | ||
| - | the plate: First, pure medium serving as the baseline for background correction for the OD | + | |
| - | + | ||
| - | measurements. Second, transformation controls accounting for potential differences in cell growth due | + | |
| - | + | ||
| - | to expression of proteins contained on the plasmids, i.e. the antibitotic resistance gene and IndC. In | + | |
| - | + | ||
| - | this set of controls, the plasmid used in co-transformation with the PPTase plasmid contains IndC- | + | |
| - | + | ||
| - | constructs carrying a randomly generated sequence instead of the T-domain. A second 96 well plate was | + | |
| - | + | ||
| - | prepared with 180 µl LB-medium/well for the measurement itself. The 96-well plate containing the pre- | + | |
| - | + | ||
| - | cultures of the co-transformed colonies was inoculated for 24 hours at 37°C. Subsequently, 20 µl of the | + | |
| - | + | ||
| - | pre-culture was transferred to the measurement plate. The absorbance of the bacterial cultures was | + | |
| - | + | ||
| - | measured at wavelengths ranging from 400 nm to 800 nm in intervals of 10 nm for each well every 30 min | + | |
| - | + | ||
| - | for 30 hours at 30°C in a Tecan infinite M200 plate reader. For the measurement plate, Greiner 96-well | + | |
| - | + | ||
| - | flat black plates with a clear lid were used. | + | |
</p> | </p> | ||
<h4>2. Data Analysis</h4> | <h4>2. Data Analysis</h4> | ||
<p> | <p> | ||
| - | Detecting the amount of the NRP expressed by the bacterial host strain is desirable. By tagging the NRP | + | Detecting the amount of the NRP expressed by the bacterial host strain is desirable. By tagging the NRP with indigoidine, the amount of the fusion peptide can be determined by quantifying the amount of blue pigment present in the cells. As the amount of blue pigment is proportional to the amount of the NRP of interest, a method for the quantification of the blue pigment will yield information about the expression of the NRP. Quantification of the pure indigoidine pigment can be easily achieved by optical density (OD) measurements at its maximum wavelength of about 590 nm. In cellular culture, indigoidine quantification by OD measurements is impaired. Cellular density of liquid cultures is standardly measured as the optical density (OD) at a wave length of 600 nm, i. e. the absorption peak of indigoidine interferes with the measurement of cell density at the preferred wave length (compare to <a class="fancybox fancyGraphical" href="https://static.igem.org/mediawiki/2013/6/64/Heidelberg_IndPD_Fig5.png" caption="<b>Figure 13: Quantification of dye in cellular culture by OD measurements at robust and sensitive wavelengths. </b>The contribution of the scattering by the cellular components at the sensitive wavelength, i.e. 590 nm for indigoidine has to be subtracted from the overall OD at this wavelength. For a detailed description of the calculation refer to text below. |
| - | + | Figure adopted from Myers, 2013. ">Fig. 13</a>, grey dashed line). Thus, for measurement of NRP expression without time consuming a priori purification of the tagged-protein, a method to separate the cellular and pigment-derived contributions to the OD is required (compare to <a class="fancybox fancyGraphical" href="https://static.igem.org/mediawiki/2013/6/64/Heidelberg_IndPD_Fig5.png" caption="<b>Figure 13: Quantification of dye in cellular culture by OD measurements at robust and sensitive wavelengths. </b>The contribution of the scattering by the cellular components at the sensitive wavelength, i.e. 590 nm for indigoidine has to be subtracted from the overall OD at this wavelength. For a detailed description of the calculation refer to text below. | |
| - | with indigoidine, the amount of the fusion peptide can be determined by quantifying the amount of blue | + | |
| - | + | ||
| - | pigment present in the cells. As the amount of blue pigment is proportional to the amount of the NRP of | + | |
| - | + | ||
| - | interest, a method for the quantification of the blue pigment will yield information about the | + | |
| - | + | ||
| - | expression of the NRP. Quantification of the pure indigoidine pigment can be easily achieved by optical | + | |
| - | + | ||
| - | density (OD) measurements at its maximum wavelength of about 590 nm. In cellular culture, indigoidine | + | |
| - | + | ||
| - | quantification by OD measurements is impaired. Cellular density of liquid cultures is standardly | + | |
| - | + | ||
| - | measured as the optical density (OD) at a wave length of 600 nm, i. e. the absorption peak of | + | |
| - | + | ||
| - | indigoidine interferes with the measurement of cell density at the preferred wave length (compare to <a | + | |
| - | + | ||
| - | class="fancybox fancyGraphical" href="https://static.igem.org/mediawiki/2013/6/64/Heidelberg_IndPD_Fig5.png" | + | |
| - | + | ||
| - | caption="<b>Figure 13: Quantification of dye in cellular culture by OD measurements at robust and | + | |
| - | + | ||
| - | sensitive wavelengths. </b>The contribution of the scattering by the cellular components at the | + | |
| - | + | ||
| - | sensitive wavelength, i.e. 590 nm for indigoidine has to be subtracted from the overall OD at this | + | |
| - | + | ||
| - | wavelength. For a detailed description of the calculation refer to text below. | + | |
| - | Figure adopted from Myers, 2013. ">Fig. 13</a>, grey dashed line). Thus, for measurement of NRP | + | |
| - | + | ||
| - | expression without time consuming a priori purification of the tagged-protein, a method to separate the | + | |
| - | + | ||
| - | cellular and pigment-derived contributions to the OD is required (compare to <a class="fancybox | + | |
| - | + | ||
| - | fancyGraphical" href="https://static.igem.org/mediawiki/2013/6/64/Heidelberg_IndPD_Fig5.png" | + | |
| - | + | ||
| - | caption="<b>Figure 13: Quantification of dye in cellular culture by OD measurements at robust and | + | |
| - | + | ||
| - | sensitive wavelengths. </b>The contribution of the scattering by the cellular components at the | + | |
| - | + | ||
| - | sensitive wavelength, i.e. 590 nm for indigoidine has to be subtracted from the overall OD at this | + | |
| - | + | ||
| - | wavelength. For a detailed description of the calculation refer to text below. | + | |
Figure adopted from Myers, 2013. ">Fig. 13</a>, brown and blue lines, respectively). | Figure adopted from Myers, 2013. ">Fig. 13</a>, brown and blue lines, respectively). | ||
</p> | </p> | ||
<center> | <center> | ||
| - | <br/><a class="fancybox fancyGraphical" | + | <br/><a class="fancybox fancyGraphical" href="https://static.igem.org/mediawiki/2013/6/64/Heidelberg_IndPD_Fig5.png" caption="<b>Figure 13: Quantification of dye in cellular culture by OD measurements at robust and sensitive wavelengths. </b>The contribution of the scattering by the cellular components at the sensitive wavelength, i.e. 590 nm for indigoidine has to be subtracted from the overall OD at this wavelength. For a detailed description of the calculation refer to text below. |
| - | + | ||
| - | href="https://static.igem.org/mediawiki/2013/6/64/Heidelberg_IndPD_Fig5.png" caption="<b>Figure 13: | + | |
| - | + | ||
| - | Quantification of dye in cellular culture by OD measurements at robust and sensitive wavelengths. | + | |
| - | + | ||
| - | </b>The contribution of the scattering by the cellular components at the sensitive wavelength, i.e. 590 | + | |
| - | + | ||
| - | nm for indigoidine has to be subtracted from the overall OD at this wavelength. For a detailed | + | |
| - | + | ||
| - | description of the calculation refer to text below. | + | |
Figure adopted from Myers, 2013. "> | Figure adopted from Myers, 2013. "> | ||
| - | <img style="width:50%; margin-bottom:10px; padding:1%;border-style:solid;border-width:1px;border- | + | <img style="width:50%; margin-bottom:10px; padding:1%;border-style:solid;border-width:1px;border-radius: 5px;" src="https://static.igem.org/mediawiki/2013/6/64/Heidelberg_IndPD_Fig5.png"></img> |
| - | + | <figcaption style="width:80%;"><b>Figure 13: Quantification of dye in cellular culture by OD measurements at robust and sensitive wavelengths. </b>The contribution of the scattering by the cellular components at the sensitive wavelength, i.e. 590 nm for indigoidine has to be subtracted from the overall OD at this wavelength. For a detailed description of the calculation refer to text below. | |
| - | radius: 5px;" src="https://static.igem.org/mediawiki/2013/6/64/Heidelberg_IndPD_Fig5.png"></img> | + | |
| - | <figcaption style="width:80%;"><b>Figure 13: Quantification of dye in cellular culture by OD | + | |
| - | + | ||
| - | measurements at robust and sensitive wavelengths. </b>The contribution of the scattering by the | + | |
| - | + | ||
| - | cellular components at the sensitive wavelength, i.e. 590 nm for indigoidine has to be subtracted from | + | |
| - | + | ||
| - | the overall OD at this wavelength. For a detailed description of the calculation refer to text below. | + | |
Figure adopted from Myers, 2013. | Figure adopted from Myers, 2013. | ||
</figcaption> | </figcaption> | ||
| Line 2,517: | Line 721: | ||
</center> | </center> | ||
<p> | <p> | ||
| - | The method of choice, as described by Myers et al. [15], requires the OD measurement of cell culture | + | The method of choice, as described by Myers et al. [15], requires the OD measurement of cell culture at two distinct wavelengths: the robust wave length ODR and the sensitive wave length ODS. The concentration of indigoidine will have to be deducted from measurements at ODS = 590 nm: |
| - | + | ||
| - | at two distinct wavelengths: the robust wave length ODR and the sensitive wave length ODS. The | + | |
| - | + | ||
| - | concentration of indigoidine will have to be deducted from measurements at ODS = 590 nm: | + | |
$$OD_{S,+P}$$ | $$OD_{S,+P}$$ | ||
$$[Indigoidine]= OD_{S,+P}-OD_{S,-P}$$ | $$[Indigoidine]= OD_{S,+P}-OD_{S,-P}$$ | ||
| - | with $OD_{S,+P}$ being the overall OD measurement and $OD_{S,-P}$ being the scattering contribution of | + | with $OD_{S,+P}$ being the overall OD measurement and $OD_{S,-P}$ being the scattering contribution of the cellular components at the sensitive OD. |
| - | + | ||
| - | the cellular components at the sensitive OD. | + | |
| - | + | ||
| - | + | ||
| - | + | ||
| - | + | ||
| - | + | ||
| - | + | ||
| - | + | ||
| - | + | ||
| - | their ratio. | + | The scattering contribution of the cellular compenents at $OD_S$ ($OD_{S,-P}$) can be calculated from the scattering contribution measured at the robust wave length according to the following formula: $OD_{S,-P}= \delta*OD_R$. The correction factor $\delta$ is be determined by measuring the OD of pure cellular culture without indigoidine at both the wavelength $[OD]_{S,-P}$ and $[OD]_R$ and calculating their ratio. |
Finally, the indigoidine production can be determined as | Finally, the indigoidine production can be determined as | ||
$$[Indigoidine]=OD_{S,+P}- \delta*OD_{R}$$ | $$[Indigoidine]=OD_{S,+P}- \delta*OD_{R}$$ | ||
| - | For the calculation of the cellular component when measuring indigoidine producing liquid cell | + | For the calculation of the cellular component when measuring indigoidine producing liquid cell cultures, OD measurement at 800 nm as robust wavelength is recommended. By the approach described above, quantitative observation of the indigoidine production in a liquid culture over time as well as the indigoidine production in relation to the cell growth can be conducted. |
| - | + | Background correction i. e. the contribution of the culture medium to the OD measurement is achieved by subtracting the mean of pure culture medium replicates from all OD values measured (<a class="fancybox fancyGraphical fancybox_p_centered" href="https://static.igem.org/mediawiki/2013/7/75/Heidelberg_IndPD_Fig_multiplot.png" caption="<b>Figure 13: Multiplot Illustrating the Quantitative Indigoidine Assay Based on OD Measurement</b> | |
| - | + | The diagrams were generated based on data from absorption spectrum measurements of <i>E. coli</i> liquid cultures expressing a functional indigoidine synthetase (a) and a nonfunctional indigoidine synthetase (b). The absorption spectrum measurement was performed at 30 °C every 30 minutes over 30 hours in a Tecan infinite M200 plate reader. The plots shown show representative results to illustrate the principle of the indigoidine assay. | |
| - | + | <b>a)</b> Absorption spectrum of an <i>E. coli</i> liquid culture producing the blue pigment indigoidine. Each color refers to a measurement at a certain timepoint - starting from <i>t = 0</i> (dark blue) to <i>t = 30 hours</i>. Note that the graphs develop a local maximum at around 600 nm over time, which corresponds to the absorption maximum of indigoidine. | |
| - | + | <b>b)</b> Absorption spectrum of an <i>E. coli</i> liquid culture expressing a nonfunctional indigoidine synthetase (a part of the indigoidine synthetase gene has been replaced by a randomly generated sequence). This absorption spectrum was used as a negative control. Note, that the graphs are stricly monoton in every measurement. | |
| - | + | <b>c)</b> The dot graph shows the ratio of the absorbance at 590 nm and 800 nm of a liquid culture producing indigoidine. The red graph was generated by linear regression of the OD590/OD800 graphs of negative controls as described in b). The OD590/OD800 ratio of the liquid culture producing indigoidine (black dots) differs from the linear behaviour of the negative control due to the production of indigoidine, which disproportionally increases the absorption at 590 nm. The OD590/OD800 ratio of an <i>E. coli</i> negative color (red graph) shows to be constant. Therefore, a constant factor has been determined, allowing to calculate the OD590 by multiplying the OD800 of a liquid culture with that constant factor (see Quantitative Indigoidine Production Assay - 2. Data Analysis). | |
| - | + | <b>d)</b> The graph shows the amount of indigoidine in an <i>E. coli</i> liquid culture expressing a functional indigoidine synthetase. Applying the data analysis method described above, the absorption at 590 nm has been corrected subtracting the fraction due to the absorption of the cells and the media. The remaining OD590 only refers to the amount of indigoidine in the liquid culture. Note, that the amount of indigoidine over time shows a sigmoidal behaviour. After a maximal level, the indigoidine level drops again. In parallel, the absorption at 430 nm rises, due to the reduction of the pigment keto-indigoidine to its fluorescent leuco-form (data not shown).">Fig. 14</a>). | |
| - | Background correction i. e. the contribution of the culture medium to the OD measurement is achieved by | + | |
| - | + | ||
| - | subtracting the mean of pure culture medium replicates from all OD values measured (<a class="fancybox | + | |
| - | + | ||
| - | fancyGraphical fancybox_p_centered" | + | |
| - | + | ||
| - | href="https://static.igem.org/mediawiki/2013/7/75/Heidelberg_IndPD_Fig_multiplot.png" caption="<b>Figure 13: | + | |
| - | + | ||
| - | Multiplot Illustrating the Quantitative Indigoidine Assay Based on OD Measurement</b> | + | |
| - | The diagrams were generated based on data from absorption spectrum measurements of <i>E. coli</i> | + | |
| - | + | ||
| - | liquid cultures expressing a functional indigoidine synthetase (a) and a nonfunctional indigoidine | + | |
| - | + | ||
| - | synthetase (b). The absorption spectrum measurement was performed at 30 °C every 30 minutes over 30 | + | |
| - | + | ||
| - | hours in a Tecan infinite M200 plate reader. The plots shown show representative results to illustrate | + | |
| - | + | ||
| - | the principle of the indigoidine assay. | + | |
| - | <b>a)</b> Absorption spectrum of an <i>E. coli</i> liquid culture producing the blue pigment | + | |
| - | + | ||
| - | indigoidine. Each color refers to a measurement at a certain timepoint - starting from <i>t = 0</i> | + | |
| - | + | ||
| - | (dark blue) to <i>t = 30 hours</i>. Note that the graphs develop a local maximum at around 600 nm over | + | |
| - | + | ||
| - | time, which corresponds to the absorption maximum of indigoidine. | + | |
| - | <b>b)</b> Absorption spectrum of an <i>E. coli</i> liquid culture expressing a nonfunctional | + | |
| - | + | ||
| - | indigoidine synthetase (a part of the indigoidine synthetase gene has been replaced by a randomly | + | |
| - | + | ||
| - | generated sequence). This absorption spectrum was used as a negative control. Note, that the graphs are | + | |
| - | + | ||
| - | stricly monoton in every measurement. | + | |
| - | <b>c)</b> The dot graph shows the ratio of the absorbance at 590 nm and 800 nm of a liquid culture | + | |
| - | + | ||
| - | producing indigoidine. The red graph was generated by linear regression of the OD590/OD800 graphs of | + | |
| - | + | ||
| - | negative controls as described in b). The OD590/OD800 ratio of the liquid culture producing indigoidine | + | |
| - | + | ||
| - | (black dots) differs from the linear behaviour of the negative control due to the production of | + | |
| - | + | ||
| - | indigoidine, which disproportionally increases the absorption at 590 nm. The OD590/OD800 ratio of an | + | |
| - | + | ||
| - | <i>E. coli</i> negative color (red graph) shows to be constant. Therefore, a constant factor has been | + | |
| - | + | ||
| - | determined, allowing to calculate the OD590 by multiplying the OD800 of a liquid culture with that | + | |
| - | + | ||
| - | constant factor (see Quantitative Indigoidine Production Assay - 2. Data Analysis). | + | |
| - | <b>d)</b> The graph shows the amount of indigoidine in an <i>E. coli</i> liquid culture expressing a | + | |
| - | + | ||
| - | functional indigoidine synthetase. Applying the data analysis method described above, the absorption at | + | |
| - | + | ||
| - | 590 nm has been corrected subtracting the fraction due to the absorption of the cells and the media. | + | |
| - | + | ||
| - | The remaining OD590 only refers to the amount of indigoidine in the liquid culture. Note, that the | + | |
| - | + | ||
| - | amount of indigoidine over time shows a sigmoidal behaviour. After a maximal level, the indigoidine | + | |
| - | + | ||
| - | level drops again. In parallel, the absorption at 430 nm rises, due to the reduction of the pigment | + | |
| - | + | ||
| - | keto-indigoidine to its fluorescent leuco-form (data not shown).">Fig. 14</a>). | + | |
</p> | </p> | ||
<center> | <center> | ||
| - | <a class="fancybox fancyGraphical fancybox_p_centered" | + | <a class="fancybox fancyGraphical fancybox_p_centered" href="https://static.igem.org/mediawiki/2013/7/75/Heidelberg_IndPD_Fig_multiplot.png" caption="<b>Figure 13: Multiplot Illustrating the Quantitative Indigoidine Assay Based on OD Measurement</b> |
| - | + | The diagrams were generated based on data from absorption spectrum measurements of <i>E. coli</i> liquid cultures expressing a functional indigoidine synthetase (a) and a nonfunctional indigoidine synthetase (b). The absorption spectrum measurement was performed at 30 °C every 30 minutes over 30 hours in a Tecan infinite M200 plate reader. The plots shown show representative results to illustrate the principle of the indigoidine assay. | |
| - | href="https://static.igem.org/mediawiki/2013/7/75/Heidelberg_IndPD_Fig_multiplot.png" caption="<b>Figure 13: | + | <b>a)</b> Absorption spectrum of an <i>E. coli</i> liquid culture producing the blue pigment indigoidine. Each color refers to a measurement at a certain timepoint - starting from <i>t = 0</i> (dark blue) to <i>t = 30 hours</i>. Note that the graphs develop a local maximum at around 600 nm over time, which corresponds to the absorption maximum of indigoidine. |
| - | + | <b>b)</b> Absorption spectrum of an <i>E. coli</i> liquid culture expressing a nonfunctional indigoidine synthetase (a part of the indigoidine synthetase gene has been replaced by a randomly generated sequence). This absorption spectrum was used as a negative control. Note, that the graphs are stricly monoton in every measurement. | |
| - | Multiplot Illustrating the Quantitative Indigoidine Assay Based on OD Measurement</b> | + | <b>c)</b> The dot graph shows the ratio of the absorbance at 590 nm and 800 nm of a liquid culture producing indigoidine. The red graph was generated by linear regression of the OD590/OD800 graphs of negative controls as described in b). The OD590/OD800 ratio of the liquid culture producing indigoidine (black dots) differs from the linear behaviour of the negative control due to the production of indigoidine, which disproportionally increases the absorption at 590 nm. The OD590/OD800 ratio of an <i>E. coli</i> negative color (red graph) shows to be constant. Therefore, a constant factor has been determined, allowing to calculate the OD590 by multiplying the OD800 of a liquid culture with that constant factor (see Quantitative Indigoidine Production Assay - 2. Data Analysis). |
| - | The diagrams were generated based on data from absorption spectrum measurements of <i>E. coli</i> | + | <b>d)</b> The graph shows the amount of indigoidine in an <i>E. coli</i> liquid culture expressing a functional indigoidine synthetase. Applying the data analysis method described above, the absorption at 590 nm has been corrected subtracting the fraction due to the absorption of the cells and the media. The remaining OD590 only refers to the amount of indigoidine in the liquid culture. Note, that the amount of indigoidine over time shows a sigmoidal behaviour. After a maximal level, the indigoidine level drops again. In parallel, the absorption at 430 nm rises, due to the reduction of the pigment keto-indigoidine to its fluorescent leuco-form (data not shown)."> |
| - | + | <img style="width:60%; margin-bottom:10px; padding:1%;border-style:solid;border-width:1px;border-radius: 5px;" src="https://static.igem.org/mediawiki/2013/7/75/Heidelberg_IndPD_Fig_multiplot.png"></img> | |
| - | liquid cultures expressing a functional indigoidine synthetase (a) and a nonfunctional indigoidine | + | <figcaption><b>Figure 13: Multiplot Illustrating the Quantitative Indigoidine Assay Based on OD Measurement</b> |
| - | + | The diagrams were generated based on data from absorption spectrum measurements of <i>E. coli</i> liquid cultures expressing a functional indigoidine synthetase (a) and a nonfunctional indigoidine synthetase (b). The absorption spectrum measurement was performed at 30 °C every 30 minutes over 30 hours in a Tecan infinite M200 plate reader. The plots shown show representative results to illustrate the principle of the indigoidine assay. | |
| - | synthetase (b). The absorption spectrum measurement was performed at 30 °C every 30 minutes over 30 | + | <b>a)</b> Absorption spectrum of an <i>E. coli</i> liquid culture producing the blue pigment indigoidine. Each color refers to a measurement at a certain timepoint - starting from <i>t = 0</i> (dark blue) to <i>t = 30 hours</i>. Note that the graphs develop a local maximum at around 600 nm over time, which corresponds to the absorption maximum of indigoidine. |
| - | + | <b>b)</b> Absorption spectrum of an <i>E. coli</i> liquid culture expressing a nonfunctional indigoidine synthetase (a part of the indigoidine synthetase gene has been replaced by a randomly generated sequence). This absorption spectrum was used as a negative control. Note, that the graphs are stricly monoton in every measurement. | |
| - | hours in a Tecan infinite M200 plate reader. The plots shown show representative results to illustrate | + | <b>c)</b> The dot graph shows the ratio of the absorbance at 590 nm and 800 nm of a liquid culture producing indigoidine. The red graph was generated by linear regression of the OD590/OD800 graphs of negative controls as described in b). The OD590/OD800 ratio of the liquid culture producing indigoidine (black dots) differs from the linear behaviour of the negative control due to the production of indigoidine, which disproportionally increases the absorption at 590 nm. The OD590/OD800 ratio of an <i>E. coli</i> negative color (red graph) shows to be constant. Therefore, a constant factor has been determined, allowing to calculate the OD590 by multiplying the OD800 of a liquid culture with that constant factor (see Quantitative Indigoidine Production Assay - 2. Data Analysis). |
| - | + | <b>d)</b> The graph shows the amount of indigoidine in an <i>E. coli</i> liquid culture expressing a functional indigoidine synthetase. Applying the data analysis method described above, the absorption at 590 nm has been corrected subtracting the fraction due to the absorption of the cells and the media. The remaining OD590 only refers to the amount of indigoidine in the liquid culture. Note, that the amount of indigoidine over time shows a sigmoidal behaviour. After a maximal level, the indigoidine level drops again. In parallel, the absorption at 430 nm rises, due to the reduction of the pigment keto-indigoidine to its fluorescent leuco-form (data not shown). | |
| - | the principle of the indigoidine assay. | + | |
| - | <b>a)</b> Absorption spectrum of an <i>E. coli</i> liquid culture producing the blue pigment | + | |
| - | + | ||
| - | indigoidine. Each color refers to a measurement at a certain timepoint - starting from <i>t = 0</i> | + | |
| - | + | ||
| - | (dark blue) to <i>t = 30 hours</i>. Note that the graphs develop a local maximum at around 600 nm over | + | |
| - | + | ||
| - | time, which corresponds to the absorption maximum of indigoidine. | + | |
| - | <b>b)</b> Absorption spectrum of an <i>E. coli</i> liquid culture expressing a nonfunctional | + | |
| - | + | ||
| - | indigoidine synthetase (a part of the indigoidine synthetase gene has been replaced by a randomly | + | |
| - | + | ||
| - | generated sequence). This absorption spectrum was used as a negative control. Note, that the graphs are | + | |
| - | + | ||
| - | stricly monoton in every measurement. | + | |
| - | <b>c)</b> The dot graph shows the ratio of the absorbance at 590 nm and 800 nm of a liquid culture | + | |
| - | + | ||
| - | producing indigoidine. The red graph was generated by linear regression of the OD590/OD800 graphs of | + | |
| - | + | ||
| - | negative controls as described in b). The OD590/OD800 ratio of the liquid culture producing indigoidine | + | |
| - | + | ||
| - | (black dots) differs from the linear behaviour of the negative control due to the production of | + | |
| - | + | ||
| - | indigoidine, which disproportionally increases the absorption at 590 nm. The OD590/OD800 ratio of an | + | |
| - | + | ||
| - | <i>E. coli</i> negative color (red graph) shows to be constant. Therefore, a constant factor has been | + | |
| - | + | ||
| - | determined, allowing to calculate the OD590 by multiplying the OD800 of a liquid culture with that | + | |
| - | + | ||
| - | constant factor (see Quantitative Indigoidine Production Assay - 2. Data Analysis). | + | |
| - | <b>d)</b> The graph shows the amount of indigoidine in an <i>E. coli</i> liquid culture expressing a | + | |
| - | + | ||
| - | functional indigoidine synthetase. Applying the data analysis method described above, the absorption at | + | |
| - | + | ||
| - | 590 nm has been corrected subtracting the fraction due to the absorption of the cells and the media. | + | |
| - | + | ||
| - | The remaining OD590 only refers to the amount of indigoidine in the liquid culture. Note, that the | + | |
| - | + | ||
| - | amount of indigoidine over time shows a sigmoidal behaviour. After a maximal level, the indigoidine | + | |
| - | + | ||
| - | level drops again. In parallel, the absorption at 430 nm rises, due to the reduction of the pigment | + | |
| - | + | ||
| - | keto-indigoidine to its fluorescent leuco-form (data not shown)."> | + | |
| - | <img style="width:60%; margin-bottom:10px; padding:1%;border-style:solid;border-width:1px;border- | + | |
| - | + | ||
| - | radius: 5px;" src="https://static.igem.org/mediawiki/2013/7/75/Heidelberg_IndPD_Fig_multiplot.png"></img> | + | |
| - | <figcaption><b>Figure 13: Multiplot Illustrating the Quantitative Indigoidine Assay Based on OD | + | |
| - | + | ||
| - | Measurement</b> | + | |
| - | The diagrams were generated based on data from absorption spectrum measurements of <i>E. coli</i> | + | |
| - | + | ||
| - | liquid cultures expressing a functional indigoidine synthetase (a) and a nonfunctional indigoidine | + | |
| - | + | ||
| - | synthetase (b). The absorption spectrum measurement was performed at 30 °C every 30 minutes over 30 | + | |
| - | + | ||
| - | hours in a Tecan infinite M200 plate reader. The plots shown show representative results to illustrate | + | |
| - | + | ||
| - | the principle of the indigoidine assay. | + | |
| - | <b>a)</b> Absorption spectrum of an <i>E. coli</i> liquid culture producing the blue pigment | + | |
| - | + | ||
| - | indigoidine. Each color refers to a measurement at a certain timepoint - starting from <i>t = 0</i> | + | |
| - | + | ||
| - | (dark blue) to <i>t = 30 hours</i>. Note that the graphs develop a local maximum at around 600 nm over | + | |
| - | + | ||
| - | time, which corresponds to the absorption maximum of indigoidine. | + | |
| - | <b>b)</b> Absorption spectrum of an <i>E. coli</i> liquid culture expressing a nonfunctional | + | |
| - | + | ||
| - | indigoidine synthetase (a part of the indigoidine synthetase gene has been replaced by a randomly | + | |
| - | + | ||
| - | generated sequence). This absorption spectrum was used as a negative control. Note, that the graphs are | + | |
| - | + | ||
| - | stricly monoton in every measurement. | + | |
| - | <b>c)</b> The dot graph shows the ratio of the absorbance at 590 nm and 800 nm of a liquid culture | + | |
| - | + | ||
| - | producing indigoidine. The red graph was generated by linear regression of the OD590/OD800 graphs of | + | |
| - | + | ||
| - | negative controls as described in b). The OD590/OD800 ratio of the liquid culture producing indigoidine | + | |
| - | + | ||
| - | (black dots) differs from the linear behaviour of the negative control due to the production of | + | |
| - | + | ||
| - | indigoidine, which disproportionally increases the absorption at 590 nm. The OD590/OD800 ratio of an | + | |
| - | + | ||
| - | <i>E. coli</i> negative color (red graph) shows to be constant. Therefore, a constant factor has been | + | |
| - | + | ||
| - | determined, allowing to calculate the OD590 by multiplying the OD800 of a liquid culture with that | + | |
| - | + | ||
| - | constant factor (see Quantitative Indigoidine Production Assay - 2. Data Analysis). | + | |
| - | <b>d)</b> The graph shows the amount of indigoidine in an <i>E. coli</i> liquid culture expressing a | + | |
| - | + | ||
| - | functional indigoidine synthetase. Applying the data analysis method described above, the absorption at | + | |
| - | + | ||
| - | 590 nm has been corrected subtracting the fraction due to the absorption of the cells and the media. | + | |
| - | + | ||
| - | The remaining OD590 only refers to the amount of indigoidine in the liquid culture. Note, that the | + | |
| - | + | ||
| - | amount of indigoidine over time shows a sigmoidal behaviour. After a maximal level, the indigoidine | + | |
| - | + | ||
| - | level drops again. In parallel, the absorption at 430 nm rises, due to the reduction of the pigment | + | |
| - | + | ||
| - | keto-indigoidine to its fluorescent leuco-form (data not shown). | + | |
</figcaption> | </figcaption> | ||
</a> | </a> | ||
| Line 2,736: | Line 766: | ||
<div class="references jumbotron" style="margin-top:5%"> | <div class="references jumbotron" style="margin-top:5%"> | ||
| - | <p>1. Marahiel MA (2009) Working outside the protein-synthesis rules: insights into non-ribosomal | + | <p>1. Marahiel MA (2009) Working outside the protein-synthesis rules: insights into non-ribosomal peptide synthesis. J Pept Sci 15: 799-807.</p> |
| - | + | <p>2. Doekel S, Marahiel MA (2000) Dipeptide formation on engineered hybrid peptide synthetases. Chem Biol 7: 373-384.</p> | |
| - | peptide synthesis. J Pept Sci 15: 799-807 | + | <p>3. Brachmann AO, Bode HB (2013) Identification and Bioanalysis of Natural Products from Insect Symbionts and Pathogens. Adv Biochem Eng Biotechnol </p> |
| - | + | <p>4. Blattner FR, Plunkett G, 3rd, Bloch CA, Perna NT, Burland V, Riley M, Collado-Vides J, Glasner JD, Rode CK, Mayhew GF, Gregor J, Davis NW, Kirkpatrick HA, Goeden MA, Rose DJ, Mau B, Shao Y (1997) The complete genome sequence of Escherichia coli K-12. Science 277: 1453-1462.</p> | |
| - | + | <p>5. Pfeifer BA, Admiraal SJ, Gramajo H, Cane DE, Khosla C (2001) Biosynthesis of complex polyketides in a metabolically engineered strain of E. coli. Science 291: 1790-1792.</p> | |
| - | <p>2. Doekel S, Marahiel MA (2000) Dipeptide formation on engineered hybrid peptide synthetases. Chem | + | <p>6. Takahashi H, Kumagai T, Kitani K, Mori M, Matoba Y, Sugiyama M (2007) Cloning and characterization of a Streptomyces single module type non-ribosomal peptide synthetase catalyzing a blue pigment synthesis. J Biol Chem 282: 9073-9081.</p> |
| - | + | <p>7. Owen JG, Robins KJ, Parachin NS, Ackerley DF (2012) A functional screen for recovery of 4'-phosphopantetheinyl transferase and associated natural product biosynthesis genes from metagenome libraries. Environ Microbiol 14: 1198-1209.</p> | |
| - | Biol 7: 373-384.</p> | + | <p>8. Johnston CW, Wyatt MA, Li X, Ibrahim A, Shuster J, Southam G, Magarvey NA (2013) Gold biomineralization by a metallophore from a gold-associated microbe. Nat Chem Biol 9: 241-243.</p> |
| - | <p>3. Brachmann AO, Bode HB (2013) Identification and Bioanalysis of Natural Products from Insect | + | <p>9. Fischbach MA, Walsh CT (2006) Assembly-line enzymology for polyketide and nonribosomal Peptide antibiotics: logic, machinery, and mechanisms. Chem Rev 106: 3468-3496.</p> |
| - | + | <p>10. Lambalot RH, Gehring AM, Flugel RS, Zuber P, LaCelle M, Marahiel MA, Reid R, Khosla C, Walsh CT (1996) A new enzyme superfamily - the phosphopantetheinyl transferases. Chem Biol 3: 923-936.</p> | |
| - | Symbionts and Pathogens. Adv Biochem Eng Biotechnol </p> | + | <p>11. Nakano MM, Corbell N, Besson J, Zuber P (1992) Isolation and characterization of sfp: a gene that functions in the production of the lipopeptide biosurfactant, surfactin, in Bacillus subtilis. Mol Gen Genet 232: 313-321.</p> |
| - | <p>4. Blattner FR, Plunkett G, 3rd, Bloch CA, Perna NT, Burland V, Riley M, Collado-Vides J, Glasner | + | <p>12. Sanchez C, Du L, Edwards DJ, Toney MD, Shen B (2001) Cloning and characterization of a phosphopantetheinyl transferase from Streptomyces verticillus ATCC15003, the producer of the hybrid peptide-polyketide antitumor drug bleomycin. Chem Biol 8: 725-738.</p> |
| - | + | <p>13. Quan J, Tian J (2009) Circular polymerase extension cloning of complex gene libraries and pathways. PLoS One 4: e6441.</p> | |
| - | JD, Rode CK, Mayhew GF, Gregor J, Davis NW, Kirkpatrick HA, Goeden MA, Rose DJ, Mau B, Shao Y (1997) | + | <p>14. Duchaud E, Rusniok C, Frangeul L, Buchrieser C, Givaudan A, Taourit S, Bocs S, Boursaux-Eude C, Chandler M, Charles JF, Dassa E, Derose R, Derzelle S, Freyssinet G, Gaudriault S, Medigue C, Lanois A, Powell K, Siguier P, Vincent R, Wingate V, Zouine M, Glaser P, Boemare N, Danchin A, Kunst F (2003) The genome sequence of the entomopathogenic bacterium Photorhabdus luminescens. Nat Biotechnol 21: 1307-1313.</p> |
| - | + | <p>15. Myers JA, Curtis BS, Curtis WR (2013) Improving accuracy of cell and chromophore concentration measurements using optical density. Bmc Biophysics 6: </p> | |
| - | The complete genome sequence of Escherichia coli K-12. Science 277: 1453-1462.</p> | + | <p>16. Puigbo P, Guzman E, Romeu A, Garcia-Vallve S (2007) OPTIMIZER: a web server for optimizing the codon usage of DNA sequences. Nucleic Acids Res 35: W126-131.</p> |
| - | <p>5. Pfeifer BA, Admiraal SJ, Gramajo H, Cane DE, Khosla C (2001) Biosynthesis of complex polyketides | + | |
| - | + | ||
| - | in a metabolically engineered strain of E. coli. Science 291: 1790-1792.</p> | + | |
| - | <p>6. Takahashi H, Kumagai T, Kitani K, Mori M, Matoba Y, Sugiyama M (2007) Cloning and | + | |
| - | + | ||
| - | characterization of a Streptomyces single module type non-ribosomal peptide synthetase catalyzing a | + | |
| - | + | ||
| - | blue pigment synthesis. J Biol Chem 282: 9073-9081.</p> | + | |
| - | <p>7. Owen JG, Robins KJ, Parachin NS, Ackerley DF (2012) A functional screen for recovery of 4'- | + | |
| - | + | ||
| - | phosphopantetheinyl transferase and associated natural product biosynthesis genes from metagenome | + | |
| - | + | ||
| - | libraries. Environ Microbiol 14: 1198-1209.</p> | + | |
| - | <p>8. Johnston CW, Wyatt MA, Li X, Ibrahim A, Shuster J, Southam G, Magarvey NA (2013) Gold | + | |
| - | + | ||
| - | biomineralization by a metallophore from a gold-associated microbe. Nat Chem Biol 9: 241-243.</p> | + | |
| - | <p>9. Fischbach MA, Walsh CT (2006) Assembly-line enzymology for polyketide and nonribosomal Peptide | + | |
| - | + | ||
| - | antibiotics: logic, machinery, and mechanisms. Chem Rev 106: 3468-3496.</p> | + | |
| - | <p>10. Lambalot RH, Gehring AM, Flugel RS, Zuber P, LaCelle M, Marahiel MA, Reid R, Khosla C, Walsh CT | + | |
| - | + | ||
| - | (1996) A new enzyme superfamily - the phosphopantetheinyl transferases. Chem Biol 3: 923-936.</p> | + | |
| - | <p>11. Nakano MM, Corbell N, Besson J, Zuber P (1992) Isolation and characterization of sfp: a gene | + | |
| - | + | ||
| - | that functions in the production of the lipopeptide biosurfactant, surfactin, in Bacillus subtilis. Mol | + | |
| - | + | ||
| - | Gen Genet 232: 313-321.</p> | + | |
| - | <p>12. Sanchez C, Du L, Edwards DJ, Toney MD, Shen B (2001) Cloning and characterization of a | + | |
| - | + | ||
| - | phosphopantetheinyl transferase from Streptomyces verticillus ATCC15003, the producer of the hybrid | + | |
| - | + | ||
| - | peptide-polyketide antitumor drug bleomycin. Chem Biol 8: 725-738.</p> | + | |
| - | <p>13. Quan J, Tian J (2009) Circular polymerase extension cloning of complex gene libraries and | + | |
| - | + | ||
| - | pathways. PLoS One 4: e6441.</p> | + | |
| - | <p>14. Duchaud E, Rusniok C, Frangeul L, Buchrieser C, Givaudan A, Taourit S, Bocs S, Boursaux-Eude C, | + | |
| - | + | ||
| - | Chandler M, Charles JF, Dassa E, Derose R, Derzelle S, Freyssinet G, Gaudriault S, Medigue C, Lanois A, | + | |
| - | + | ||
| - | Powell K, Siguier P, Vincent R, Wingate V, Zouine M, Glaser P, Boemare N, Danchin A, Kunst F (2003) The | + | |
| - | + | ||
| - | genome sequence of the entomopathogenic bacterium Photorhabdus luminescens. Nat Biotechnol 21: 1307- | + | |
| - | + | ||
| - | 1313.</p> | + | |
| - | <p>15. Myers JA, Curtis BS, Curtis WR (2013) Improving accuracy of cell and chromophore concentration | + | |
| - | + | ||
| - | measurements using optical density. Bmc Biophysics 6: </p> | + | |
| - | <p>16. Puigbo P, Guzman E, Romeu A, Garcia-Vallve S (2007) OPTIMIZER: a web server for optimizing the | + | |
| - | + | ||
| - | codon usage of DNA sequences. Nucleic Acids Res 35: W126-131.</p> | + | |
</div> | </div> | ||
</div> | </div> | ||
Revision as of 23:43, 28 October 2013


Project

Notebook


Human Practice


Tag-Optimization. Engineering indC by Domain Exchanges.

Highlights
Abstract
Non-ribosomal peptide synthetases (NRPS) offer a unique opportunity to spin around their inherent logical assembly and observe if their functionality is preserved or even improved.
Following this idea, we investigate the interchangeability of NRPS domains and the possibility to tune their efficiency at the example of indC from Photorhabdus luminescens, the NRPS module used for the Indigoidine-Tag. The native NRPS domains have been replaced with domains from other bacterial organisms and fully synthetic domains. Moreover, we compare the activity of different PPTases, which are required for the activation of NRPS modules. To determine the NRPS efficiency we established a quantitative indigoidine assay based on OD measurement of the blue-colored pigment. Interestingly, our data points out that some of our engineered indC variants exhibit increased efficiency in producing indigoidine compared to the native enzyme. Furthermore, we introduce HiCT - High throughput protocols for circular polymerase extension Cloning and Transformation - a new standard for the assembly of combinatorial gene libraries (RFC 99).


Introduction
In Non-Ribosomal Peptide Synthesis, peptides are produced by multienzyme complexes, the NRPS, which form an assembly line, in which every NRPS module is responsible for the incorporation of one single amino acid into the growing peptide chain (for more detailled information on the NRPS system, please visit our Background Page to see our NRPS introduction video)[1]. As previously shown, the natural NRPS assembly lines can be rearranged to create novel assembly lines producing custom peptides (please find our experiments on the Peptide Synthesis Page)[2]. Since the detection of those custom peptides remained challenging when produced in vivo, we developped a method which enables the labelling of non-ribosomal peptides (NRPs) with the blue pigment indigoidine (please find our experiments on the Indigoidine-Tag Page). The Indigoidine-Tag enables for applying high-throughput methods in the creation of NRPS libraries as well as in detection, purification and validation of synthetic NRPs (please find our RFC Page for standardized high-throughput protocols). Custom short peptides might have a great potential for production in industrial scale. Therefore, we try to optimize the efficiency of the indigoidine synthetase indC, which is used for the Indigoidine-Tag.
The indigoidine synthetase indC from Photorhabdus luminescens laumondii TT01 (DSM15139) consists of an adenylation domain with an internal oxidation domain, a thiolation domain and a thioesterase domain [3]. The A-domain adenylates L-glutamine, which is then attached to the T-domain via a thioester bond. The TE-domain catalyzes the cyclization of the glutamine and cleaves it from the T-domain. Each two cyclic glutamines are oxidized by the Ox-domain, resulting in the blue pigment indigoidine (Fig. 1a). The indigoidine synthetase must be activated by an enzyme called 4'Phosphopantheteinyl-transferase (PPTase), which transfers the 4'-PPT residue from Coenzyme A to a conserved serine residue in the T-domain of the indigoidine synthetase, thus transforming it from its inactive apo- to the active holo-form (Fig. 1b)[3].

We expressed the indigoidine synthetase indC together with the PPTase in different substrains of E. coli to observe their growth behaviour and to get an impression, which substrain is most suitable for our experiments. We used the E. coli substrains MG1655 [4], TOP10 (Invitrogen), NEB Turbo (NEB), BAP1 [5] and Rosetta (Novagen). In order to optimize the yield of indigoidine produced by indC, we investigated the influence of the T-domain on the enzyme efficiency. Previous studies showed, that exchanging the T-domain of the blue pigment synthetase bpsA from S. lavendulae [6] yields an unfunctional indigoidine synthetase [7].We replaced the T-domain of the wild-type indC with T-domains from several other NRPS modules from different host organisms (S. lavendulae, E. coli, B. parabrevis, D. acidovorans, P. luminescens) observing the change in enzyme efficiency (Fig. 2a) [2][3][6][8]. Moreover, we created seven fully synthetic T-domains based on multiple sequence alignments of 250 NRPS modules and measured the indigoidine yield after insertion into the indigoidine synthetase scaffold. Since the the NRPS T-domains must be activated by a member of the 4'-Phosphopantheteinyl-transferases (PPTases) [9], which differ in their substrate specificity [10], we coexpressed every engineered indigoidine synthetase with PPTases from different host organisms (Sfp from B. subtilis [11], Svp from S. verticillus [12], EntD from E. coli [7], DelC from D. acidovorans [8], NgrA from P. luminescens [14]) (Fig. 2b) and determined the indigoidine production rate of every engineered indigoidine synthetase in combination with a respective PPTase.
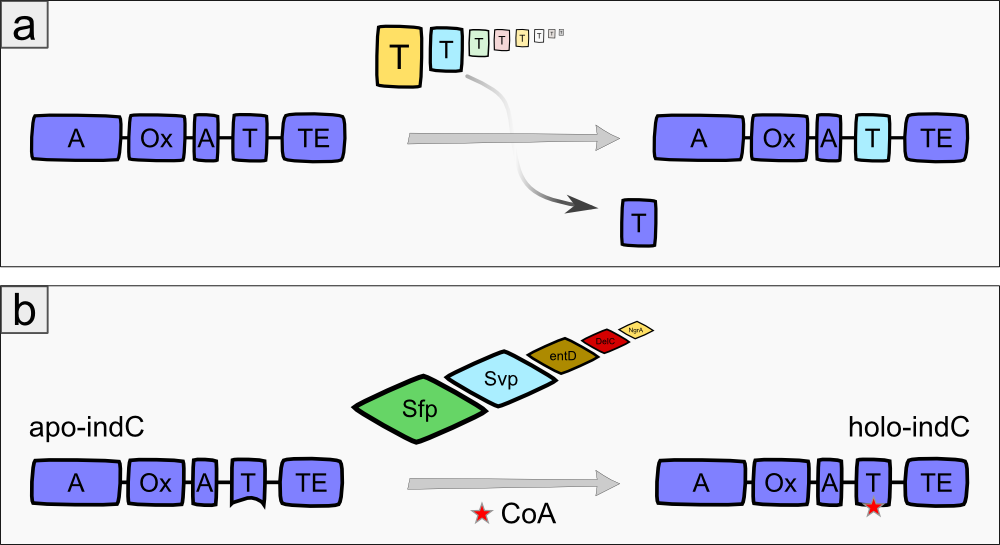
With this approach, we learn more about the interaction of T-domains and PPTases and their influence on the NRPS efficiency. Since this combinatorial approach requires the cloning of large plasmid libraries and hundreds of cotransformations, we established HiCT: High-throughput protocols for circular polymerase extension Cloning and Transformation (please find more information on HiCT on our RFC99 Page) based on CPEC assembly [11].
Results
Expression of Indigoidine Synthetase IndC in Five Substrains of ''E. coli''
The open reading frame of the native indigoidine synthetase indC was amplified from genomic DNA of P. lumninescens laumondii TT01 (DSM15139) and cloned into a pSB1C3 derived plasmid under the control of an lac-inducible promoter. This indC expression cassette was transformed into different substrains of E. coli, namely DH5alpha, MG1655, BAP1, TOP10 and NEB Turbo. All of these host strains were previously transformed with a pSB3K3 derived expression plasmid coding for the PPTase Sfp from ''B. subtilis'', which is commonly used in NRPS studies. As depicted in Fig. 3a, Sfp is able to activate the T-domain of indC as determined by the blue phenotype of the transformed cells. Except for NEB Turbo cells, all transformed host strains displayed a decellerated growth and significantly smaller colonies on plate when compared to the E. coli TOP10 negative control. The blue phenotype developed late after transformation ranging from first blue colonies after 24 h and taking up to three days for visible poduction of the blue pigment. NEB Turbo showed regular colony growth and developed a strong blue phenotype upon induction with IPTG. As all host strains were able to express the functional indigoidine sythetase IndC, further experiments were only conducted with one E. coli strain. Due to its simplicity in handling and sufficient expression of the constructs, the substrain TOP10 was chosen.

Indigoidine Production Varies when Co-expressed with Different PPTases
The expression of indC under activation by the endogenous PPTase entD in ''E. coli'' was sufficient for easy detection of indigoidine production on plates Fig. 3b, indC). In order to determine, whether the amount of indigoidine in the E. coli TOP10 cells is dependent on the quality of the interacting of indC with the PPTase, four PPTase dervied from varying origins were selected and amplified from the genome of the hosts of origin. ''E. coli''TOP10 cells were co-transformed with plasmids coding for the different PPTases and the plasmid containing the expression cassette for indC. As reference for the endogenous PPTase activity served cells only transformed with the indC plasmid. Irrespective of the PPTase, growth of colonies was retarded. Remarkably however, colonies co-transformed with the PPTase plasmid remained of smaller size than the ones only carrying the indC construct. On the other side, indigoidine production was more diffuse in the latter cells with secretion of the blue pigment into the agar (Fig. 3b, indC) and only slight blue-greenish coloring of the colonies. The four PPTases additionally introduced into the TOP10 cells were all shown to be functional (blue phenotype of the transformants, Fig. 3b ), but lead to the retention of most of the indigoidine within the cells. Colonies of cells transformed with thess constructs, were of convex shape and of distinct, dark blue color. Overall, cells carrying an additional PPTase showed increased indigoidine production compared to the cells relying on the endogenous entD.
T-Domain Exchanges in IndC Yield Functional Indigoidine Synthetases
The main structural characteristic of NRPSs is their modular composition on different hierarchical levels. The indogoidine synthetase indC is a single module NRPS comprised of the three domains, namely AOxA, T and TE. Since the functionality of this NRPS is detectable by the bare eye, it offers a perfect and simple experimental set-up for proof of principle experiments regarding the interchangeability of domains from different NRPS. Out of the three domains in indC, the T-domain is supposed to exhibit the least substrate specificity and was thus chosen for first domain shuffling approaches. For the initial definition of T-domain boundaries of indC, we used Pfam, a web-tool which allows -amongst other functions- for the prediction of NRPS module and domain boundaries (Pfam.sanger.ac.uk. Following the boundary prediction, we choose a two-pronged domain shuffling approach: First, we transferred native T-domains derived from either different host species and/or NRPS of entirely different function into the indC indigoidine synthetase (Streptomyces lavendulae lavendulae ATCC11924 (blue pigment synthetase bpsA) [6], Brevibacillus parabrevis (Tyrocidine synthesis cluster) [2], Delftia acidovorans SPH-1 (Delftibactin synthesis cluster) [8], Photorhabdus luminescens laumondii TT01 (plu2670 and plu2642, unknown function) [14] and Escherichia coli MG1655 (entF from enterobactin synthesis cluster) [4]). Second, we deviced three methods for the generation of synthetic T-domains based on different NRPS libraries generated by BLAST search against either specific subranges of host organisms or restricting the query sequence to be BLASTed (BLAST.ncbi.nlm.nih.gov). The engineered indigoidine synthetases were coexpressed with supplementary PPTases (sfp, svp, entD and delC) in E. coli TOP10 cells (Fig. 4a).
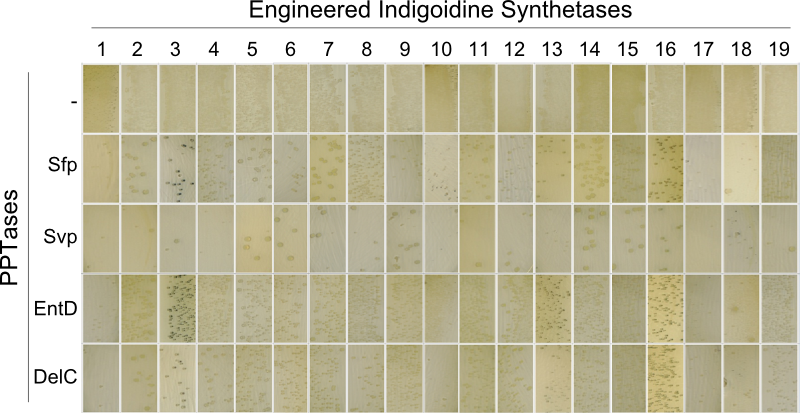
As depicted in Fig. 5, both approaches lead principally to fully functional indCs. The synthetic T-domains 1, 3 and 4 showed the same decreased growth and indigoidine production on plates as did the native T-domain derived from ''P. lumninescens''. The colonies obtained after co-transformation with supplementary PPTase plasmid were small in size and of dark blue color. Compared to synthetic T-domain 5, indigoidine production started earlier (approximately after 24-30 hours).

In contrast to the synthetic domains 1,3 and 4 which were designed by the consensus method and showed medium to high similarity to the sequence of origin, synthetic domain 5 was generated by the guided random method. Remarkably, even though 39 out of the 62 amino acids of the original T-domain were exchanged, the indigoidine synthetase with this T-domain was still functional. Closer analysis of the sequence compared to the original indC T-domain sequence showed, that the characteristics of the amino acid sequence, i. e. for instance polar or charged amino acids, were retained in 72 % of the sequence. Also, the GGxS core sequence of the T-domain at which the activation by the PPTas occurs was conserved.
The Efficiency of Engineered NRPS is Improved When Optimal Domain Borders Are Applied
Multiple web-tools exist which offer the prediction of NRPS module and domain boundaries. One of the most common used prediction tools is Pfam which we used as a starting point to determine the best method for defining domain boundaries. Pfam predicted large linker structures between the end of the A- and the beginning of the T-domain (compare Fig. 5, T-boundaries from "B" to "2"). Using these domain boundaries for the native T-domains did only yield one functional native T-domain (Fig. 5, plu2642). We tried to improve this yield by defining new T-domain boundaries based on the predictions of Pfam and multiple sequence alignments (MSA) with the respective homology libraries at the predicted linker regions. Boundaries were set closer to the preceeding A-domain, at regions were less sequence conservation was observed. Fig. 6 shows the indigoidine production after insertion of native T-domains with revised boundaries. T-domain boundary combinations A1, A2 and C1 yielded functional T-domains. As the indigoidine production and cell growth was best for the T-domains created with boundary combination A2, this boundary design was used for all subsequent cloning strategies.

Fig. 7 depicts the success of this boundary desgin as two additional native T-domains derived from delH4 and bpsA (indigoidine synthetase) led to functional indCs and the production of indigoidine. In addition, the native T-domain from plu2642 which was already shown to be functional (compare Fig. 3b ) showed faster and increased indigoidine production (deep blue agar plate, lower right panel on Fig. 7 ). The results obtained from this experiments proofed two concepts: First, domain shuffling is possible across different species as the T-domains of delH4 and bpsA were derived from D. acidovorans and S. lavendulae lavendulae, respectively and were functional in E. coli. Also, shuffling of domains from modules of different substrate specificity has been proofen herein. Second, manually adjusting the boundaries predicted by Pfam based on MSA is a functional method to predict functional T-domain boundaries.

PPTase and T-domain Interaction Strongly Influence the Yield of Indigoidine Production
As the previous experiments of shuffled T-domains and different combinations of PPTases showed, there are substantial differences in cell growth and indigoidine production when observed on plates. However, this observations were always of qualitative nature and did not give any insight into quantitative differences. We approached the quantification of indigoidine production in a time-resolved and highly-combinatorial manner: plasmids coding for indC containing all synthetic (4) and native T-domains (3) proven functional by the previous assays were co-transformed with the four functional PPTases. The indigoidine production over time (30 hours) was measured at its absorption maximum of 590 nm and corrected for the contribution of the cellular components in the medium as described in the methods. As Fig. 8 shows, synthetic T-domains in combination with different PPTases lead to distinct differneces in indogoidin production.
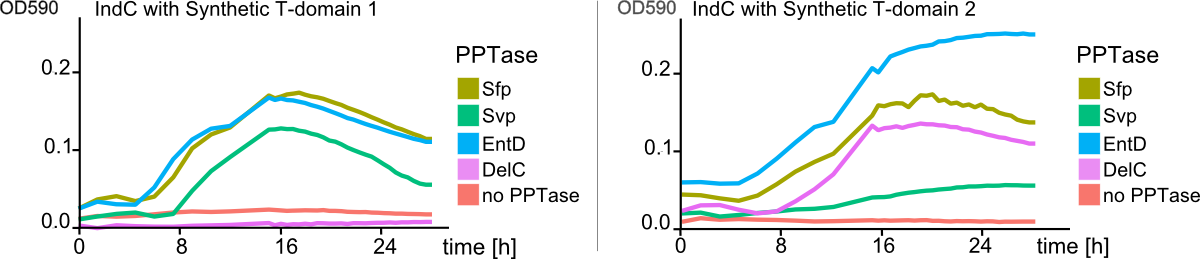
As a comparison between the left and right panel of Fig. 8 shows, PPTases working best with one T-domain might not lead to any indigoidine production when used with a indigoidine synthetase containing a different T-domain (Fig. 8 , pink line, delC). In addition, as distinctly visible in Fig. 9 , indigoidine production over time is not a strictly monoton function (blue line). After an indigoidin production peak at 16 hours, indigoidine production caused by indC containing the synthetic domain 4 decreases again. The indigoidin production in cells transformed with indC/synthetic T-domain 3 is still increasing.

Engineered Indigoidine Synthetase is More Efficient than Native Enzyme
After applying the domain border combination A2 (see Fig. 6
) to all T-domains we inserted to the indC gene, we quantified the amount of indigoidine produced per cell density of E. coli cells expressing both the engineered indC variant and a PPTase (Sfp, Svp, EntD or DelC). We used a Tecan infinite M200 plate reader and applied the quantitative indigoidine assay described in the methods section. Fig. 10
shows the relative indigoidine production of representative samples in this measurement, illustrated as a heat map. The indigidine production strongly varies among different combinations of T-domains and PPTases. Notably, one of the engineered indigoidine synthetases is more efficient than the native enzyme itself. This most efficient indigoidine synthetase carries the synthetic T-domain #3. With this remarkable finding we wanted to have a closer view at structural aspects of this enzyme. Currently, the crystal structures of both the native IndC and our optimized variant are investigated by the group of Dr. Bange (Philipps-Universität Marburg).

Discussion
Motivated by the establishment of the Indigoidine-Tag, which enables the labelling of nonribosomal peptides, we wanted to further investigate the indigoidine synthetase indC [3] and thus the overall NRPS modularity in order to optimize the functionality of the indigoidine tag. In previous studies, direct T-domain exchanges have not been successful in the context of the indigoidine synthetase BpsA from S. lavendulae [6][7]. Furthermore, the endogenous PPTase EntD of E. coli was considered inefficient in the activation of the blue pigment synthetase BpsA [6]. Therefore, most studies in the field of NRPS are conducted with the PPTase Sfp from B. subtilis [11]. The family of 4'-Phosphopantheteinyl-transferases was reported to vary in substrate specificity [11]. Therefore, they can only activate specific NRPS module families [9]. We first investigated the production of indigoidine in five substrains of E. coli: TOP10 (Invitrogen), MG1655 [4], NEB Turbo (NEB), BAP1 [5] and Rosetta (Novagen), using an expression plasmid coding for the indigoidine synthetase IndC and the PPTase Sfp. Though differring in their growth behaviour, all substrains showed to be capable of producing the blue pigment indigoidine (Fig. 3a).
In our approach, we replaced single domains of the indC indigoidine synthetase module with both respective domains of other NRPS pathways from different organisms and entirely synthetic domains which were created based on multiple sequence alignments of 250 NRPS domains. We also created indC variants, in which different domain borders have been applied for the domain exchange (Fig. 6), since setting the correct linker sequence is crucial for the NRPS function [7]. We used NRPS domains from Streptomyces lavendulae lavendulae ATCC11924 (blue pigment synthetase bpsA) [6], Brevibacillus parabrevis (Tyrocidine synthesis cluster) [2], Delftia acidovorans SPH-1 (Delftibactin synthesis cluster) [8], Photorhabdus luminescens laumondii TT01 (plu2670 and plu2642, unknown function) [14] and Escherichia coli MG1655 (entF from enterobactin synthesis cluster) [4], thus creating a library of 58 different engineered indigoidine synthetases. We co-transformed the 58 indC variants with four different PPTases into E. coli TOP10 cells. We used the PPTases Sfp (Bacillus subtilis str. 168) [11], Svp (Streptomyces verticillus ATCC15003) [12], EntD (Escherichia coli MG1655) [7] and DelC (Delftia acidovorans SPH-1) [8] and screened them on their functionality. This screening is remarkably easy, because functional indigoidine synthetases result in a blue phenotype when being expressed and activated in E. coli cells [3]. We found, that nine engineered indigoidine synthetases, in which the T-domain was replaced, remained functional in producing indigoidine when co-expressed with specific PPTases. The inserted T-domains include four synthetic T-domains (Fig. 4
), the T-domain of bpsA with three different domain border combinations (Fig. 6) and the T-domains of the NRPS modules plu2642 (P. luminescens) and delH (D. acidovorans)(Fig. 7). In order to quantify the amount of indigoidine produced by the engineered indigoidine synthetases when co-transformed with different PPTases, we established a quantitative indigoidine assay based on OD measurement using a Tecan infinite M200 plate reader, inspired by Myers et al. [15]. Notably, one of our engineered IndC constructs was more efficient ind the production of indigoidine compared to the wild-type IndC (T-domain Plu2642; Fig. 10).
This is particularly remarkable as our results contradict to previous studies of NRPS domains that reported the native T-domain of the indigoidine synthetase BpsA to be essential for protein function (and therefore not replaceable by other T-domains)[7].
In conclusion, we were able to demonstrate that it is indeed possible to replace single domains from NRPS modules, while preserving or even enhancing their functionality. In addition, we established an approach for the design of synthetic T-domains and proved their functionality by introducing them into the indigoidine synthetase indC scaffold. Moreover, we established a high throughput protocol for circular polymerase extension cloning and transformation (Hi-CT) (BBF RFC 99) based on CPEC assembly [13], which we applied for our domain shuffling approach. In summary, we created a library of 58 engineered indC variants. In addition we perforemd measurement of blue pigement production over time, which gave us novel insights in how NRPS domains should be designed, where the domain borders between different domains in a single NRPS module have to be set and which domains from respective NRPS pathways and bacterial strains can be used, when creating novel engineered NRPS pathways. We implemented our findings into the "NRPS-Designer" Software, so that the underlying algorithm for NRPS design takes into consideration the abovementioned findings (e.g. domain border setting) which are certainly crucial for successful in silico prediction of functional NRPSs. The crystal structure of our optimized indigoidine synthetase, which is currently investigated by the group of Dr. Bange (Philipps-University Marburg), will give more insight into structural aspects of non-ribosomal peptide synthesis.
Thereby, our project pioneers the research on high-throughput methods for creation and optimization of synthetic NRPS modules composed of user-defined domains. We believe that our findings will highly contribute to future development of custom NRPSs.
Methods
Cloning Strategy
We assembled the different indC variants on a chloramphenicol resistance backbone (pSB1C3) with an IPTG-inducable lac-promoter, the ribosome binding site BBa_B0034 and the coding sequence of the respective indC variant. The indC plasmids should be co-transformed with a PPTase construct to get a significant and fast indigoidine production. Therefore, we used a second plasmid backbone carrying a kanamycin resistance (pSB3K3). We assembled five pSB3K3 derived plasmids, each carrying an expression cassette with an IPTG induceable lac-promotor, the BBa_B0029 ribosome binding site and the coding sequence of the respective PPTase (sfp, svp, entD, delC and ngrA). We used E. coli TOP10 for co-transformations of the possible combination of the indC variants and all PPTase plasmids.Circular Polymerase Extension Cloning
Circular Polymerase Extension Cloning (CPEC) is a sequence-independent cloning method based on homologous recombination of double-strand DNA overlaps of vector and insert(s) (Fig. 11 )(Quan 2008). It is suitable for the generation of combinatorial, synthetic construct libraries as it allows for multi-fragment assembly in an accurate, efficient and economical manner.
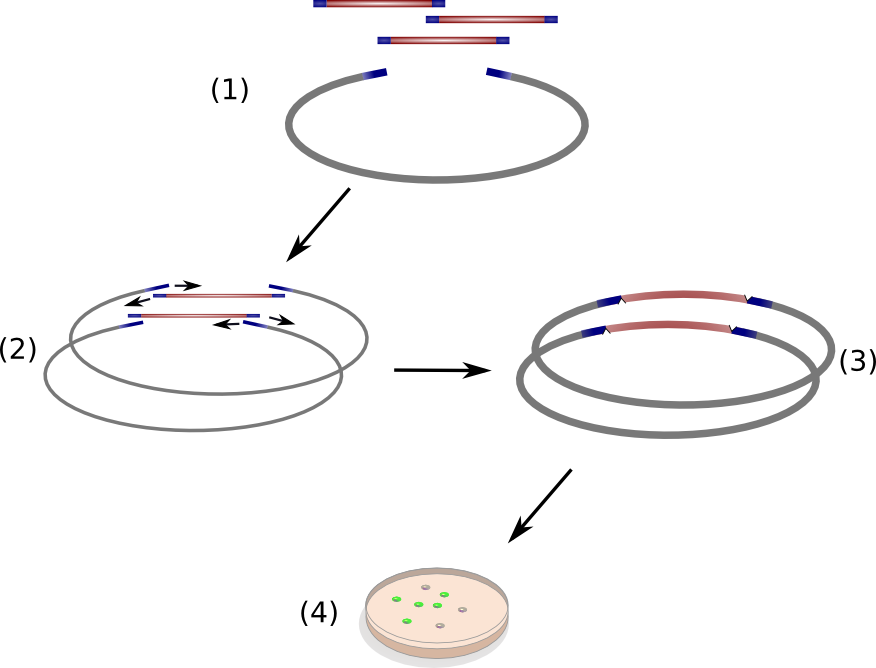
CPEC relies on a simple polymerase extension of the DNA fragments to be assembled. Crucial to this concept is the design of vector and insert fragments which must share overlapping regions at the ends (Figure 11(1)). In a single reaction set-up, insert DNA fragments and linear vector are heat denaturized and allowed to anneal at elevated temperature, resulting in specific hybridized insert-vector constructs (Figure 11(2)). Subsequently, the single-strand hybrid constructs are extended under PCR-elongation conditions (72 °C for 20 s/kbp of longest fragment) which yield completely assembled, double-stranded circular constructs (Figure 11(3)) ready for transformation into competent cells. The single strands nicks introduced on each strand due to the unidirectional nature of the polymerase chain reaction will be removed by endogenous ligases upon transformation into Escherichia coli.
We provide instructions (RFC 99) for a rapid and cost efficient cloning and transformation method based on CPEC which allows for the manufacturing of multi-fragment plasmid constructs in a parallelized manner: High Throughput Circular Extension Cloning and Transformation (HiCT)
CPEC was performed according to the following protocol: The total mass of DNA used per CPEC reaction varied between 50 to 200 ng. The insert to backbone molar ratio was 3:1 for insert-backbone and 1:1 for insert-insert molar ratio. Conversion from mass concentration of fragments to molar concentration was done using the formula: cM = c*10^6/(n*660), where c is the measured oligonucleotide concentration [ng/µl], n is the number of dinucleotides of the fragment and cM is the resulting concentration [nM]. The final reaction volume was adjusted to 6 µl with polymerase master mix (Phusion® High-Fidelity PCR Master Mix with HF Buffer, NEB #M0531S/L). The CPEC reaction was carried out under the following conditions:
- initial denaturation at 98°C for 30 s
- 5 cycles with:
- denaturation step at 98°C for 5 s.
- annealing step at 53°C for 15 s
- elongation/filling up step at 72°C for 20 s/kbp of longest fragment.
- final extension at 72°C for three times the calculated elongation time.
- (Optional: Hold at 12°C )
After CPEC, 5 µl of of the reaction mixture were used for transformation. The remaining volume was used for quality check on a gel with small pockets (10 to 20 µl in volume).
Generation of cdB-indC Construct
To minimize the background colonies when exchanging the T-domain of the indigoidine synthetase we generated the ccdB-Ind plasmid where we replaced the indC T-domain with the ccdB gene (Modul structure: AoxA-ccdb-TE) which kills E. coli TOP10 cells but not E. coli OneShot ccdB survival cells. Test-transformation in both E. coli TOP10 and the E. coli OneShot ccdB survival cells showed that background colonies could be eliminated by this strategy. We used the ccdB-Ind for all further CPEC experiments aiming to swap T-domains. Primers for the backbone CPEC fragments were designed to facilitate the amplification of the entire ccdB-Ind plasmid while omitting the ccdB sequence. Assembly of the finale indigoidine synthase products with exchanged T-domain was achieved by CPEC as described or above or HiCT (RFC 99).
Examination of T-domain Borders
We exchanged the T-domain of indC with the T-domain of bpsA and varied the size of the exchanged DNA sequence, thus examining several domain borders (Figure 5a). We used the CPEC assembly method and the indC-ccdB plasmid for this approach. For the investigation of additional T-domains from less related NRPS modules, we selected the border combination A2 which was positive in the test with bpsA. We used the T-domains of the following genes:
| Gene | Organism | Original function |
|---|---|---|
| entF | Escherichia coli K-12 | NRPS module of enterobactin synthesis pathway |
| tycA1 | Brevibacillus parabrevis | 1st module in tyrocidine synthesis cluster |
| tycC6 | Brevibacillus parabrevis | Last module in tyrocidine synthesis cluster |
| delH4 | Delftia acidovorans SPH-1 | 2nd but last module in delftibactin synthesis cluster |
| delH5 | Delftia acidovorans SPH-1 | Last module in delftibaction synthesis cluster |
| plu2642 | P. luminescens DSM15139 | NRPS of unknown function (one module: A-T-TE) |
| plu2670 | P. luminescens DSM15139 | module of NRPS pathway of unknown function |
All T-domains from the respective genomes were amplified using CPEC primers with a uniform 5’-end and a 3’-end specific for the respective gene. For the assembly of the hybrid-indigoidine synthetases by CPEC, the indC-ccdB construct was used.
Creation of Synthetic T-domains
All R scripts used in the following sections are based on R version R-3.0.1. Different assumptions about the evolutionary conservation of T-domains were examined: i) conservation of a specific module across different species, ii) conservation of T-domains across different modules for the same species, iii) conservation of T-domains across different species, iv) conservation of similar modules across different species. According to these three assumptions, different libraries of homologous protein sequences were generated using ncbi protein BLAST (blast.ncbi.nlm.nih.gov) with standard parameters:
- query sequence: indC; Search set: non-redundant protein sequences without organism restriction
- query sequence: indC T-domain; Search set: non-redundant protein sequences within P. luminescens
- query sequence: indC T-domain; Search set: non-redundant protein sequences without organism restriction
- query sequences: indC, bpsA, entF, delH5 and tycC6; Search set: non-redundant protein sequences without organism restriction;
The 50 closest related protein sequences contained in each the library were subjected to a multiple sequence alignment (MSA) using clustalO (http://www.ebi.ac.uk/Tools/msa/clustalo/). with standard parameters for protein alignments. For library generation iv), each query sequence was BLASTed separately and the 50 best results of each query were combined i.e. a total of 250 sequences for the MSA. After library generation, the following three methods were employed to design different synthetic T-domains.
1. Consensus Method
Based on the .clustal file obtained from the MSA of the homology libraries, a consensus sequence using the UGENE software (http://ugene.unipro.ru/) with a threshold of 50% was created (i.e. if an amino acid appears in 50% or more of all sequences at a specific position it is considered as a consensus amino acid). For the creation of the synthetic T-domains, this consensus sequence was used to fill the gaps where there was no consensus amino acid with the original amino acid from the indC T-domain. By this approach, T-domains were generated which might deviate from the original sequence at positions with at least average conservation but coreespond to the original one if there is less conservation.
2. Guided Random Method
In this approach, the multiple sequence alignments (MSA) generated by the consensus method was used. Implemented in R, a position-specific profile was generated which has the same length as the MSA and contains the rate at which amino acids occur at any given position of the sequence alignment. The synthetic T-domain is created by position-wise generation of the sequence where the probability of choosing an amino acid at a given position is determined by the rate in the profile.
3. Randomized Generation Method
For generation of synthetic sequences by the randomized generation method, every amino acid was assigned a score of 1 or 0, i.e. occuring at least ones or not at all at a given position in the MSA. In the subsequent generation of the synthetic T-domain sequence of the synthetic domain, any amino acid assigned 1 had the same likelihood of being chosen at this position. Seven synthetic T-domains were designed based on differnt combinations of the homology libraries and sequence generation methods.
| Domain ID | Homology library | Sequence generation method |
|---|---|---|
| synT1 | library i | consensus |
| synT2 | library ii | consensus |
| synT3 | library iii | consensus |
| synT4 | library iv | consensus |
| synT5 | library i | guided random |
| synT6 | library iv | guided random |
| synT7 | library i | randomized generation |
Fig. 12 shows the multiple sequence alignment of the seven synthetic T-domains and the native indC T-domain. After the generation of the T-domain amino acid sequences, the OPTIMIZER web-tool(http://genomes.urv.es/OPTIMIZER/) was used to obtain the corresponding DNA sequence [16]. E. coli K-12 was set as strain for codon optimization and most frequent was chosen as codon option. The generated DNA sequence was cured from internal RFC10 cutting sites and CPEC cloning overhang required for the T-domain swapping into the ccdb construct were introduced. The synthetic T-domains were ordered at IDT (Integrated DNA Technologies, Coralville, Iowa). In order to obtain sufficient amounts of DNA, the synthetic T-domains were amplified via PCR. IndC-hybrid constructs of the native IndC with exchange of the native T-domain by the synthetic variants were assembled using CPEC and the indC-ccdB construct as backbone. The synthetic T-domains were amplified for CPEC using the same primers as for the native indC T-domain.

Quantitative Indigoidine Production Assay
1. OD Spectrum Measurement
96-well plates are prepared with 100 μl LB-medium/well containing appropriate antibiotics (chloramphenicol and kanamycin for the indigoidine and PPTase contrcuts, respectively) and each well is inoculated with single colonies (in duplicates) from plates positive for the co-tansformation experiments i.e. from plates with blue colonies. Two sets of negative controls are also inoculated on the plate: First, pure medium serving as the baseline for background correction for the OD measurements. Second, transformation controls accounting for potential differences in cell growth due to expression of proteins contained on the plasmids, i.e. the antibitotic resistance gene and IndC. In this set of controls, the plasmid used in co-transformation with the PPTase plasmid contains IndC-constructs carrying a randomly generated sequence instead of the T-domain. A second 96 well plate was prepared with 180 µl LB-medium/well for the measurement itself. The 96-well plate containing the pre-cultures of the co-transformed colonies was inoculated for 24 hours at 37°C. Subsequently, 20 µl of the pre-culture was transferred to the measurement plate. The absorbance of the bacterial cultures was measured at wavelengths ranging from 400 nm to 800 nm in intervals of 10 nm for each well every 30 min for 30 hours at 30°C in a Tecan infinite M200 plate reader. For the measurement plate, Greiner 96-well flat black plates with a clear lid were used.
2. Data Analysis
Detecting the amount of the NRP expressed by the bacterial host strain is desirable. By tagging the NRP with indigoidine, the amount of the fusion peptide can be determined by quantifying the amount of blue pigment present in the cells. As the amount of blue pigment is proportional to the amount of the NRP of interest, a method for the quantification of the blue pigment will yield information about the expression of the NRP. Quantification of the pure indigoidine pigment can be easily achieved by optical density (OD) measurements at its maximum wavelength of about 590 nm. In cellular culture, indigoidine quantification by OD measurements is impaired. Cellular density of liquid cultures is standardly measured as the optical density (OD) at a wave length of 600 nm, i. e. the absorption peak of indigoidine interferes with the measurement of cell density at the preferred wave length (compare to Fig. 13, grey dashed line). Thus, for measurement of NRP expression without time consuming a priori purification of the tagged-protein, a method to separate the cellular and pigment-derived contributions to the OD is required (compare to Fig. 13, brown and blue lines, respectively).

The method of choice, as described by Myers et al. [15], requires the OD measurement of cell culture at two distinct wavelengths: the robust wave length ODR and the sensitive wave length ODS. The concentration of indigoidine will have to be deducted from measurements at ODS = 590 nm: $$OD_{S,+P}$$ $$[Indigoidine]= OD_{S,+P}-OD_{S,-P}$$ with $OD_{S,+P}$ being the overall OD measurement and $OD_{S,-P}$ being the scattering contribution of the cellular components at the sensitive OD. The scattering contribution of the cellular compenents at $OD_S$ ($OD_{S,-P}$) can be calculated from the scattering contribution measured at the robust wave length according to the following formula: $OD_{S,-P}= \delta*OD_R$. The correction factor $\delta$ is be determined by measuring the OD of pure cellular culture without indigoidine at both the wavelength $[OD]_{S,-P}$ and $[OD]_R$ and calculating their ratio. Finally, the indigoidine production can be determined as $$[Indigoidine]=OD_{S,+P}- \delta*OD_{R}$$ For the calculation of the cellular component when measuring indigoidine producing liquid cell cultures, OD measurement at 800 nm as robust wavelength is recommended. By the approach described above, quantitative observation of the indigoidine production in a liquid culture over time as well as the indigoidine production in relation to the cell growth can be conducted. Background correction i. e. the contribution of the culture medium to the OD measurement is achieved by subtracting the mean of pure culture medium replicates from all OD values measured (Fig. 14).

1. Marahiel MA (2009) Working outside the protein-synthesis rules: insights into non-ribosomal peptide synthesis. J Pept Sci 15: 799-807.
2. Doekel S, Marahiel MA (2000) Dipeptide formation on engineered hybrid peptide synthetases. Chem Biol 7: 373-384.
3. Brachmann AO, Bode HB (2013) Identification and Bioanalysis of Natural Products from Insect Symbionts and Pathogens. Adv Biochem Eng Biotechnol
4. Blattner FR, Plunkett G, 3rd, Bloch CA, Perna NT, Burland V, Riley M, Collado-Vides J, Glasner JD, Rode CK, Mayhew GF, Gregor J, Davis NW, Kirkpatrick HA, Goeden MA, Rose DJ, Mau B, Shao Y (1997) The complete genome sequence of Escherichia coli K-12. Science 277: 1453-1462.
5. Pfeifer BA, Admiraal SJ, Gramajo H, Cane DE, Khosla C (2001) Biosynthesis of complex polyketides in a metabolically engineered strain of E. coli. Science 291: 1790-1792.
6. Takahashi H, Kumagai T, Kitani K, Mori M, Matoba Y, Sugiyama M (2007) Cloning and characterization of a Streptomyces single module type non-ribosomal peptide synthetase catalyzing a blue pigment synthesis. J Biol Chem 282: 9073-9081.
7. Owen JG, Robins KJ, Parachin NS, Ackerley DF (2012) A functional screen for recovery of 4'-phosphopantetheinyl transferase and associated natural product biosynthesis genes from metagenome libraries. Environ Microbiol 14: 1198-1209.
8. Johnston CW, Wyatt MA, Li X, Ibrahim A, Shuster J, Southam G, Magarvey NA (2013) Gold biomineralization by a metallophore from a gold-associated microbe. Nat Chem Biol 9: 241-243.
9. Fischbach MA, Walsh CT (2006) Assembly-line enzymology for polyketide and nonribosomal Peptide antibiotics: logic, machinery, and mechanisms. Chem Rev 106: 3468-3496.
10. Lambalot RH, Gehring AM, Flugel RS, Zuber P, LaCelle M, Marahiel MA, Reid R, Khosla C, Walsh CT (1996) A new enzyme superfamily - the phosphopantetheinyl transferases. Chem Biol 3: 923-936.
11. Nakano MM, Corbell N, Besson J, Zuber P (1992) Isolation and characterization of sfp: a gene that functions in the production of the lipopeptide biosurfactant, surfactin, in Bacillus subtilis. Mol Gen Genet 232: 313-321.
12. Sanchez C, Du L, Edwards DJ, Toney MD, Shen B (2001) Cloning and characterization of a phosphopantetheinyl transferase from Streptomyces verticillus ATCC15003, the producer of the hybrid peptide-polyketide antitumor drug bleomycin. Chem Biol 8: 725-738.
13. Quan J, Tian J (2009) Circular polymerase extension cloning of complex gene libraries and pathways. PLoS One 4: e6441.
14. Duchaud E, Rusniok C, Frangeul L, Buchrieser C, Givaudan A, Taourit S, Bocs S, Boursaux-Eude C, Chandler M, Charles JF, Dassa E, Derose R, Derzelle S, Freyssinet G, Gaudriault S, Medigue C, Lanois A, Powell K, Siguier P, Vincent R, Wingate V, Zouine M, Glaser P, Boemare N, Danchin A, Kunst F (2003) The genome sequence of the entomopathogenic bacterium Photorhabdus luminescens. Nat Biotechnol 21: 1307-1313.
15. Myers JA, Curtis BS, Curtis WR (2013) Improving accuracy of cell and chromophore concentration measurements using optical density. Bmc Biophysics 6:
16. Puigbo P, Guzman E, Romeu A, Garcia-Vallve S (2007) OPTIMIZER: a web server for optimizing the codon usage of DNA sequences. Nucleic Acids Res 35: W126-131.