"
"
Team:HokkaidoU Japan/Shuffling Kit/Examples
From 2013.igem.org
| Line 20: | Line 20: | ||
<p>For a demonstration we decided to optimize the expression of Kanamycin resistance. Changing the concentration of Kanamycin in agar plate, it is estimated that different promoter will be chosen by our Promoter Selector (fig.1).</p> | <p>For a demonstration we decided to optimize the expression of Kanamycin resistance. Changing the concentration of Kanamycin in agar plate, it is estimated that different promoter will be chosen by our Promoter Selector (fig.1).</p> | ||
| - | <p>If the concentration of Kanamycin was high, the colony with strong promoter will survive. Therefore, only one or two colors | + | <p>If the concentration of Kanamycin was high, the colony with strong promoter will survive. Therefore, only one or two colors indicate the first and second biggest occupancy rate on the plate. |
If the concentration of Kanamycin was low, colonies with weak promoters will be able to survive. This way many colors of colonies would appear (fig.2). | If the concentration of Kanamycin was low, colonies with weak promoters will be able to survive. This way many colors of colonies would appear (fig.2). | ||
</p> | </p> | ||
| Line 49: | Line 49: | ||
Vector: pSB1C3 | Vector: pSB1C3 | ||
</p> | </p> | ||
| - | <p>We cloned Kanamycin resistant gene from | + | <p>We cloned Kanamycin resistant gene from pSB3K3, by using BsaI adding primer. Used the Promoter Selector (K1084501, K1084502, K1084503, K1084504, K1084505 ).</p> |
<p> | <p> | ||
| - | Culture: 37 °C, for | + | Culture: 37 °C, for 48h |
</p> | </p> | ||
| + | |||
| + | <h4>Results</h4> | ||
| + | |||
| + | <div class="fig fig400"> | ||
| + | <img src="https://static.igem.org/mediawiki/2013/2/28/HokkaidoU_2013_Km_resistance_assay_summary_data.png"> | ||
| + | <div><span class="bold">fig.4 Graph of number and rate, and table of number of colonies size over 1mm diameter.</span></div> | ||
| + | </div> | ||
| + | |||
<div class="fig fig400"> | <div class="fig fig400"> | ||
<img src="https://static.igem.org/mediawiki/2013/c/ca/POK_DEMO_48h_newnew_HokkaidoU_2013.png"> | <img src="https://static.igem.org/mediawiki/2013/c/ca/POK_DEMO_48h_newnew_HokkaidoU_2013.png"> | ||
| Line 59: | Line 67: | ||
</div> | </div> | ||
| - | + | <p>After 48h cultivation, around 300 colonies had appeared on each LBKC (Kanamycin and Chloramphenicol) plates. We prepared LacZa expression in Promoter Selector system as negative control to estimate the success of Golden Gate Assembly, and only 7 to 0 colonies are expressed LacZa. Mixed colored colonies which would have been transformed by two or more Promoter Selector were also observed. The number and rate of colonies per each plate were graphed (fig.4), with rejecting these undesirable colonies. | |
| - | <p>We | + | </p> |
| - | + | ||
| - | + | <p> | |
| - | The colonies were | + | In (fig.4), legend color corresponds to Promoter Selector’s part number. The sum of colony numbers is displayed above each bar, and rate is in these sections. Number in the table is the number of each Promoter Selector’s colonies. These data are collected from only one time Kanamycin resistance assay result. |
| - | The | + | |
</p> | </p> | ||
<div class="clearfix"></div> | <div class="clearfix"></div> | ||
| + | |||
<h4>Conclusion</h4> | <h4>Conclusion</h4> | ||
| - | <p> | + | <p> |
| - | This | + | There is no difference from lowest and highest Kanamycin concentration. In these colonies, number of colonies derived from K1084405 (containing K1084010 promoter ) has the most largest rate on each plate. This result suggests that the colonies expressed the lowest amount of Kanamycin resistance gene, and the resorce of transcription and translation could be spared to cell growth,thus the number of colonies may have been largest. Otherwise, the DNA solution of K1084505 Promoter Selector used at ligation was simply larger than other DNA solution. Although the result is collected from only one time assay, higher conscentration of Kanamycin and much number of trials than this time will be needed. |
| - | + | ||
</p> | </p> | ||
| + | <p> | ||
| + | From these result, and the experimental fact that the existence of Km resistance gene in Promoter Selector’s BsaI cloning section is partially confirmed. Our Promoter Selector was successfully assembled, but it does not adopted to all colonies. Then, as a result of assembling, we succeeded in making colorful colonies appear on one plate. | ||
| + | </p> | ||
<h2>RBS Selector</h2> | <h2>RBS Selector</h2> | ||
<h3>4 colors</h3> | <h3>4 colors</h3> | ||
| Line 81: | Line 91: | ||
<p> | <p> | ||
The RBS Selector we made, can randomize the strength of RBSs in the operon. | The RBS Selector we made, can randomize the strength of RBSs in the operon. | ||
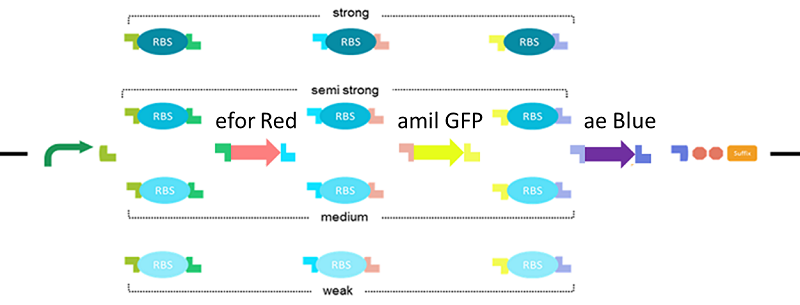
| - | For a demonstration, we decided to create all combinations by two genes; mRFP1 (BBa_E1010) and LacZα (BBa_I732006) (fig. | + | For a demonstration, we decided to create all combinations by two genes; mRFP1 (BBa_E1010) and LacZα (BBa_I732006) (fig.5). LacZα makes the colony blue. mRFP1 makes the colony red. |
</p> | </p> | ||
<div class="fig fig800"> | <div class="fig fig800"> | ||
<img src="https://static.igem.org/mediawiki/2013/9/90/Fig4_in_example_new_HokkaidoU_2013.png"> | <img src="https://static.igem.org/mediawiki/2013/9/90/Fig4_in_example_new_HokkaidoU_2013.png"> | ||
| - | <div><span class="bold">fig. | + | <div><span class="bold">fig.5 Create all combinations by RBS of defferent stlength mRFP1 (BBa_E1010) and LacZα (BBa_I732006).</span></div> |
</div> | </div> | ||
| - | <p>When the RBS upstream of mRFP1 was strong and the RBS upstream was weak, the colony should be red. When the RBS upstream of mRFP1 was weak, and the RBS upstream was strong, the colony should be blue. So when if the strength of RBS upstream both genes were the same, colony will be white, purple (fig. | + | <p>When the RBS upstream of mRFP1 was strong and the RBS upstream was weak, the colony should be red. When the RBS upstream of mRFP1 was weak, and the RBS upstream was strong, the colony should be blue. So when if the strength of RBS upstream both genes were the same, colony will be white, purple (fig.6).</p> |
<div class="fig fig800"> | <div class="fig fig800"> | ||
<img src="https://static.igem.org/mediawiki/2013/c/c8/Fig5_in_example_%2Boverhang_HokkaidoU_2013.png"> | <img src="https://static.igem.org/mediawiki/2013/c/c8/Fig5_in_example_%2Boverhang_HokkaidoU_2013.png"> | ||
| - | <div><span class="bold">fig. | + | <div><span class="bold">fig.6 Each combinations of RBS make different colors.</span></div> |
</div> | </div> | ||
| Line 106: | Line 116: | ||
<div class="fig fig400"> | <div class="fig fig400"> | ||
<img src="https://static.igem.org/mediawiki/2013/0/08/ROK_demo_new_HokkaidoU_2013.png"> | <img src="https://static.igem.org/mediawiki/2013/0/08/ROK_demo_new_HokkaidoU_2013.png"> | ||
| - | <div><span class="bold">fig. | + | <div><span class="bold">fig.7 The colonies showed red, blue, white, and purple.</span></div> |
</div> | </div> | ||
<h4>Results</h4> | <h4>Results</h4> | ||
| Line 131: | Line 141: | ||
<div class="fig fig800"> | <div class="fig fig800"> | ||
<img src="https://static.igem.org/mediawiki/2013/1/1d/64demo2_HokkaidoU_2013.png"> | <img src="https://static.igem.org/mediawiki/2013/1/1d/64demo2_HokkaidoU_2013.png"> | ||
| - | <div><span class="bold">fig. | + | <div><span class="bold">fig.8.</span></div> |
</div> | </div> | ||
Revision as of 07:48, 28 October 2013
Maestro E.coli
Optimization Kit

Demonstrations for Usecase Example
We will show some interesting demonstrations of our kits, Promoter Selector and RBS Selector!
Promoter Selector
Let's select the best promoter for Kanamycin resistance by Promoter Selector.
For a demonstration we decided to optimize the expression of Kanamycin resistance. Changing the concentration of Kanamycin in agar plate, it is estimated that different promoter will be chosen by our Promoter Selector (fig.1).
If the concentration of Kanamycin was high, the colony with strong promoter will survive. Therefore, only one or two colors indicate the first and second biggest occupancy rate on the plate. If the concentration of Kanamycin was low, colonies with weak promoters will be able to survive. This way many colors of colonies would appear (fig.2).


Method
Optimum concentration of Kanamycin: in LB is 50 mg/ml We prepared 3 different concentration plates.
- Plate A: Kanamycin 125 mg per plate
- Plate B: Kanamycin 250 mg per plate
- Plate C: Kanamycin 500 mg per plate (optimum concentration)
- Plate D: Kanamycin 1000 mg per plate
Gene Vector: pSB1C3
We cloned Kanamycin resistant gene from pSB3K3, by using BsaI adding primer. Used the Promoter Selector (K1084501, K1084502, K1084503, K1084504, K1084505 ).
Culture: 37 °C, for 48h
Results


After 48h cultivation, around 300 colonies had appeared on each LBKC (Kanamycin and Chloramphenicol) plates. We prepared LacZa expression in Promoter Selector system as negative control to estimate the success of Golden Gate Assembly, and only 7 to 0 colonies are expressed LacZa. Mixed colored colonies which would have been transformed by two or more Promoter Selector were also observed. The number and rate of colonies per each plate were graphed (fig.4), with rejecting these undesirable colonies.
In (fig.4), legend color corresponds to Promoter Selector’s part number. The sum of colony numbers is displayed above each bar, and rate is in these sections. Number in the table is the number of each Promoter Selector’s colonies. These data are collected from only one time Kanamycin resistance assay result.
Conclusion
There is no difference from lowest and highest Kanamycin concentration. In these colonies, number of colonies derived from K1084405 (containing K1084010 promoter ) has the most largest rate on each plate. This result suggests that the colonies expressed the lowest amount of Kanamycin resistance gene, and the resorce of transcription and translation could be spared to cell growth,thus the number of colonies may have been largest. Otherwise, the DNA solution of K1084505 Promoter Selector used at ligation was simply larger than other DNA solution. Although the result is collected from only one time assay, higher conscentration of Kanamycin and much number of trials than this time will be needed.
From these result, and the experimental fact that the existence of Km resistance gene in Promoter Selector’s BsaI cloning section is partially confirmed. Our Promoter Selector was successfully assembled, but it does not adopted to all colonies. Then, as a result of assembling, we succeeded in making colorful colonies appear on one plate.
RBS Selector
4 colors
Let’s create all combinations by two reporter genes and make various colors on one plate!
The RBS Selector we made, can randomize the strength of RBSs in the operon. For a demonstration, we decided to create all combinations by two genes; mRFP1 (BBa_E1010) and LacZα (BBa_I732006) (fig.5). LacZα makes the colony blue. mRFP1 makes the colony red.

When the RBS upstream of mRFP1 was strong and the RBS upstream was weak, the colony should be red. When the RBS upstream of mRFP1 was weak, and the RBS upstream was strong, the colony should be blue. So when if the strength of RBS upstream both genes were the same, colony will be white, purple (fig.6).

Method
- Used promoter1 (BBa_K1084001), SD2 (BBa_K1084101), SD4 (BBa_K1084102) and assembled with.
- Spread X-GAL(250 mg)on LBC plate.
- Cultured for 37 °C, 26h.

Results
We got many colored colonies,red, blue, white, and purple.
Conclusion
We can say that our RBS Selector worked!! The RBSs uptsream 2 genes were randomized and they had many levels of expressions.
64 colors