Team:NTU-Taida/Modeling/Flow Cytometry
From 2013.igem.org
Flow Cytometry
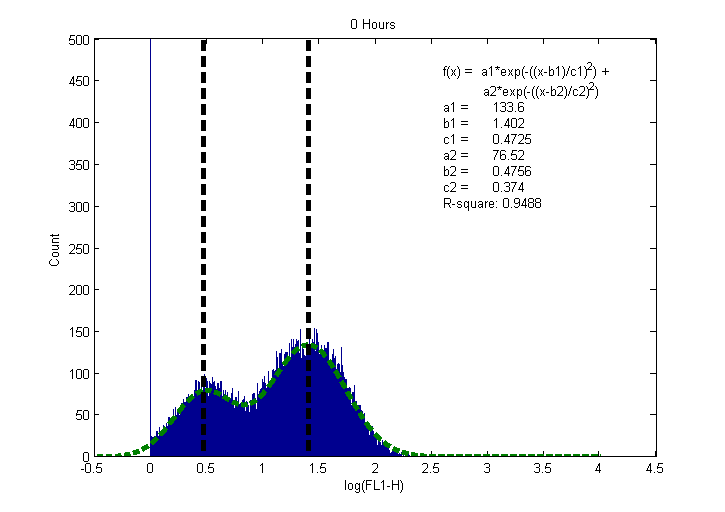
Now We try to find relationship between simulation result and reality by simulating the single cell model with Brownian noise many times (1000 times in this case) and collecting the data from flow cytometry (which can detect the GFP intensity of each cell and estimate the distribution of GFP intensity).
We collect the experiment result with 4 different initial condition (AHL concentration = 10-3, 10-5, 10-7, 0) in 5 time points (0,1,2,3,4 hours after reaction) (Figure 1~4). Bi-Gaussian distribution are observed in some cases (with AHL concentration = 10-3, 10-5 ) at 1 hours indicated that positive feedback system were amplifying the signal. The cells which can trigger the positive feedback loop create more AHL receptor hence more GFP are generated and other cells which cannot trigger the positive feedback loop create GFP much slower ,yields Bi-Gaussian distribution. However the GFP intensity reach saturation within 1 hours in all cases.
 "
"


