Team:SydneyUni Australia/Test
From 2013.igem.org
Assembly of dhlB-dhlA in pSB1C3
Characterisation of submitted parts with the constitutive promoter Pcat
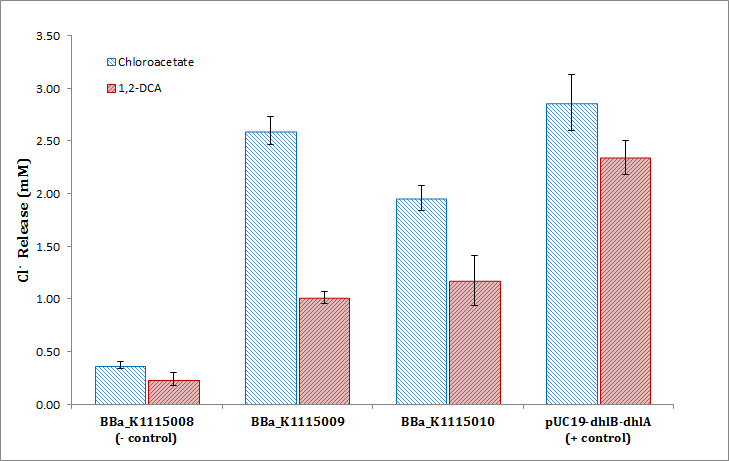
Colourmetric assay of chloride release from dhlB activity on chloroacetate (in blue) and dhlA activity on 1,2-Dichloroethane (1,2-DCA, in red). Standard curve generated with 0.0, 0.1, 0.2, 0.5, 1.0, 1.5, and 2.0mM NaCl in KP buffer. TOP10 E.coli cells were harvested at OD600=0.4, pelleted and washed three times in KP buffer. Cells were resuspended in 2mM chloroacetate or 1,2-DCA and incubated for 16hrs at 37°C and 200rpm. Cells were then pelleted and assayed using the Bergmann and Sanik chloride assay and the absorbance at 460nm read. Data for each condition is in triplicate (standard deviation <0.26 Cl- (mM)).
Chloride release from dhlB activity on chloroacetate (in blue) and dhlA activity on 1,2-Dichloroethane (1,2-DCA, in red). Negative Control was BBa_K1115008, the promoterless dhlB-dhlA coding region, BBa_K1115009 is dhlB-dhlA constitutively expressed by PCat (BBa_I14033), BBa_K1115009 is constitutively expressed by PTet (BBa_R0040), and the positive control is the Coleman lab pUC19 house plasmid expressing dhlB-dhlA with the same RBS.
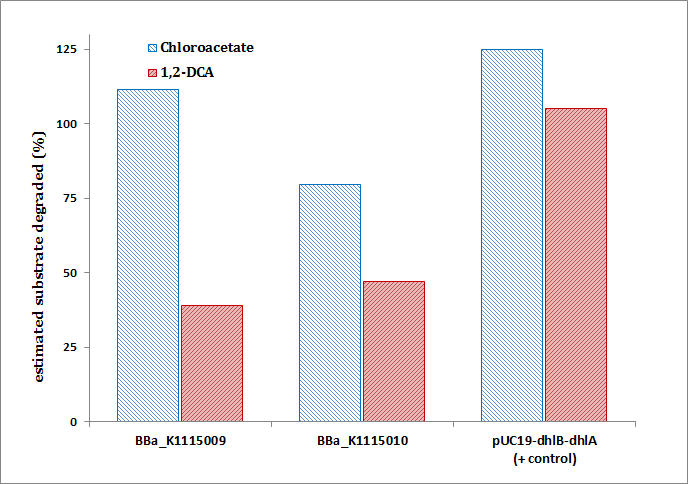
Estimated percentage degradation of chloroacetate and 1,2-DCA as determined by:
Where the Test cell supernatant is from BBa_K1115009 or BBa_K1115010, the Negative cell supernatant is from BBa_K1115008, and the substrate concentration is 2mM Chloroacetate or 1,2-DCA. Note that values of over 100% degradation are misleading and likely indicate endogenous Cl- production (i.e. Cl- production from other cellular processes unrelated to target substrate metaboloism.
 "
"

