"
"
Team:TU-Eindhoven/AnearobicTesting
From 2013.igem.org


Contents |
Anaerobic Testing of the FNR Promoter
Abstract
When the bacteria have reached the tumor zone, the CEST contrast proteins should be expressed. A characteristic of tumorous areas is the low oxygen concentration, so when the proteins can be expressed when they sense a hypoxic environment, tumors can be visualized. Hereto production of the contrast giving proteins chosen for this experiment will be induced by triggering an FNR promoter, making use of hypoxic conditions. The chosen proteins are all Arginine and lysine rich, which will ensure that CEST contrast becomes visible upon measurement with MRI machines, making bacterial protein expression a possible tumor imaging mechanism. Testing the promoter under hypoxic conditions it was revealed that no proteins were expressed in BL21 bacteria, but EGFP was produced in the XL-1 Blue and MG1655 strains. The XL1-Blue E.coli strain appears to be the best strain for the anaerobically induction of CEST protein expression, due to an increase in activity seen during the promoter experiments.
Introduction
Within the scope of this project, where bacteria are being used to express contrast proteins within tumor environments, the promoter had to be tested in similar conditions as to those in which tumor cells are present. Near and in tumors hypoxic (oxygen depleted) environments can be found. This means that the bacteria will need to express their proteins under hypoxic conditions, when tumor imaging is desired. The proteins that will be expressed are Arginine and lysine rich proteins, which can give the proteins the feature of generating CEST contrast. As a proof of concept, the promoter that has been chosen (an FNR promoter, which is known to induce transcription when the environment has a low oxygen concentrations, in particular for metabolic cell activities), has to be tested under hypoxic conditions.
Construct Design
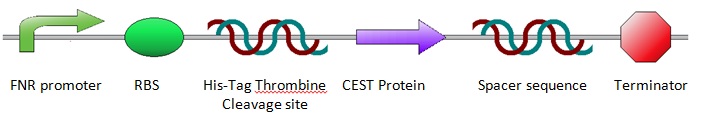
The construct was designed as shown below. The design was achieved by incorporating a number of predetermined specifications: An oxygen sensitive promoter was needed, which is explained in more detail below (see: FNR). To allow for purification of the proteins after expression, a His-Tag was included in front of the protein and a Thrombine cleavage site for cutting off the His-Tag after purification. Since the His-Tag will not be removed, the Thrombine cleavage site is not essential, but to reduce the number of differences between the anaerobic and aerobic sequences, a Thrombine cleavage site was inserted. Then the sequence for the CEST proteins/EGFP was placed into the construct. A spacer sequence and a terminator were placed behind the protein sequence to ensure correct termination of the protein expression. For more information about the construct design, see Construct Design and Chasis.
FNR
Since anaerobic expression is desired, a FNR promoter was inserted in front of the sequence for the desired protein. The promoter design was taken from research by Barnard et al. For more information about promoter design, see FNR Promoter. The chosen promoter had a 1.8 times higher activity than the most commonly used single binding site FNR promoter. The FNR promoter is regulated by the fumurate and nitrate reduction (FNR) protein. This is a transcription activator, that can control the expression of genes when oxygen concentrations are low. The inactive state of the FNR protein can acquire a [4Fe-4S]2+ cluster, subsequently it can form dimers containing [2Fe-2S]2+ clusters. These dimers are the active transcription factors. Oxygen destabilizes these dimerized iron-sulfur-clusters which results in an inactive state of the transcription factor. For more information about the FNR dynamics, see FNR Dynamics.
Methods and Results
Cloning
Once the pUC57-simple constructs were delivered, we transformed them into NB bacteria for amplification of the vectors. Once amplified, a digestion on the constructs as well as on the pBR322 vector was performed with EcoRI and HindIII restriction enzymes to cut out the entire sequence (from promoter up to and including the terminator) out of the pUC57-simple construct. The pBR322 vector was chosen since it contains no promoter making it easier to test the FNR promoter. Once the pUC57-simple constructs as well as pBR322 vector were digested a gel extraction was performed to retain the length constructs. Subsequently a ligation was performed to implant the complete sequences from the pUC57-simple constructs into the pBR322 vector. After ligation the constructs were plated with ampicilin antibiotics (for which resistance is introduced by the pBR322 vector) and grown overnight to create colonies. To check whether ligation had succeeded a colony PCR procedure was performed and the results were loaded on an agarose gel:
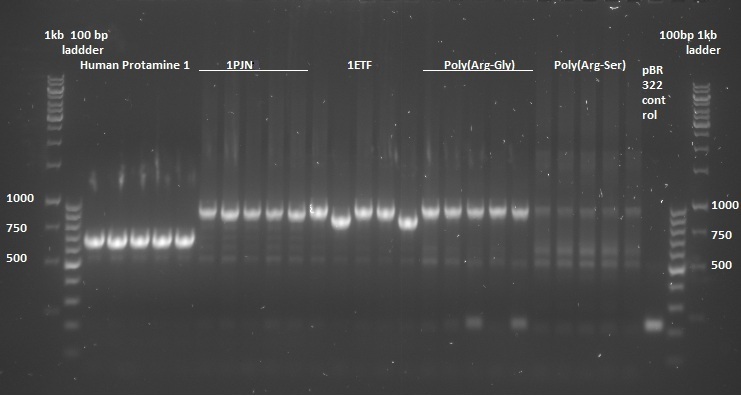
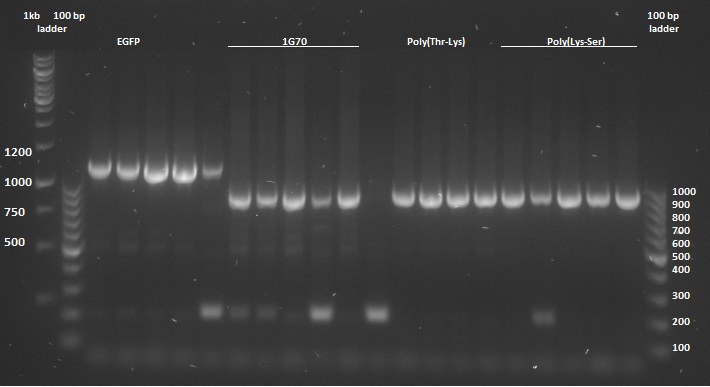
Based on the above gels the following constructs were chosen to continue experimentation with: (Pro1(1,2), 1PJN(1,2), 1ETF(3,4), P(RG)(1,2), P(RS)(1,5), EGFP(1,2), 1G70(3,5), P(TK)(2,3), P(KS)(1,3). Small cultures were created, again with ampicilin, and grown overnight. To retain the vectors, a miniprep procedure was performed, the product of which was sequenced allowing us to show that each of the constructs were correctly implemented. The ligated vectors were then transformed into BL21 bacteria as preparation for protein expression.
Protein Expression
For anaerobic protein expression a BioReactor, wherein anaerobic conditions can be reached by creating a flow of nitrogen through the culture, was used. First the ligated vectors were transformed into BL21 bacteria by heat shocking the bacteria. To test the FNR promoter the pBR322-EGFP construct was used, since EGFP can be measured with ease. 4L of LB medium was prepared and autoclaved within the vessel. This was subsequently inoculated with the bacteria, which were then grown aerobically until the optical density was approximately 0.6. Upon reaching the optical density of 0.6 the air supply was turned off and the vessel was continually flooded with Nitrogen ensuring an anaerobic environment. At several moments a sample was taken to follow the EGFP production curve. During the entire experiment the culture temperature was kept constant at 37 °C (equal to body temperature in which the bacteria should be able to function).
Upon analysis it was revealed that no EGFP had been produced. A possible explanation for this problem could be a mutation in the FNR coding gene within BL21 bacteria. This would mean that FNR production would not occur upon the bacteria entering an anaerobic environment. This was later confirmed by further researchNoFNRBL21Constanze Pinske et al, Metabolic Deficiences Revealed in the Biotechnologically Important Model Bacterium Escherichia coli BL21(DE3). PloS one 6.8, e22830 (2011).
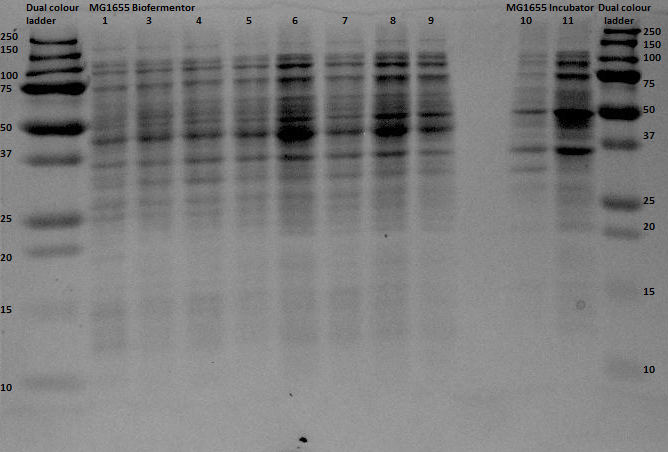
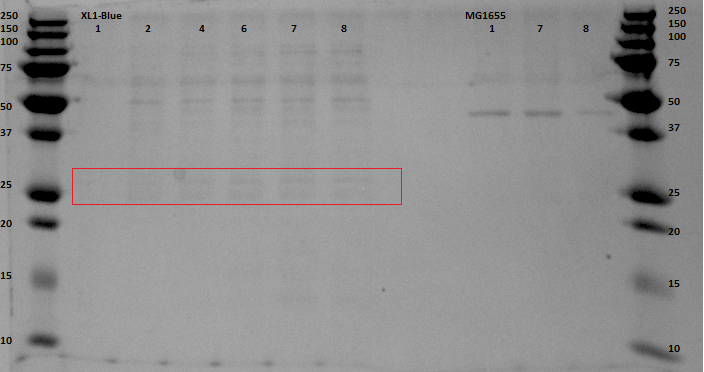
Since protein expression in BL21 bacteria was not successful, the pBR322-EGFP vector was then transformed, by heat shocking, into XL-1 Blue bacteria and by electroporation into an MG1655 strain, of which the latter was kindly provided by the University of Groningen. The same procedure for the anaerobic protein expression as was executed for the BL21 was now performed for the XL1-Blue and the MG1655 strain. In and the gel analyses of the BugBustered samples from the anaerobic induced EGFP expression are shown. After His-Tag purification of the samples, another 12% SDS gel analysis was performed. From the XL1-Blue samples the whole time sequence that was obtained from the Biofermentor was purified, since the unpurified gel clearly showed increasing intensity of some bands. There is a not so clear band at the height about 29 kDa, which could indicate that EGFP was expressed. For the MG1655 samples only samples 1, 8 and 9 were taken to see whether there was an increase in intensity (this gel was less promising than the XL1-Blue samples).
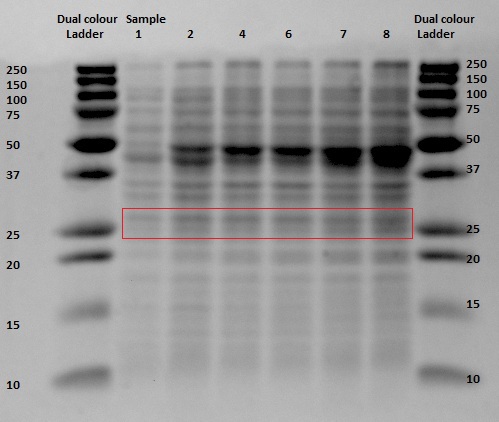
The gel with the purified samples is shown in . For the XL1-Blue samples there is a band around 50 kDa that increases in intensity. There is also a less intense band that might increase in intensity at around 30 kDa. This could indicate that EGFP, of which that is the correct molecular weight, is being expressed. Since the concentrations measured using nandrop after purification were very low, this could explain why the intensity is not that high. For the MG1655 a clear band is located around 45 kDa, which seems to correspond with the bands seen before on the unpurified gel, but this does not give us any information about EGFP expression.
By cross referencing these gels with previous gels from other experiments we were able to propose with high certainty that the thicker bands at 50kDA were native proteins being expressed naturally in anaerobic environments. A good follow up experiment could be to find out which proteins these are and to investigate their expression mechanism, although this is most definitely beyond the scope of our current experiment.
Fluorescence Measurements
From the purified protein solutions, samples were taken for fluorescence analysis. EGFP emission spectra were desired to have an increased intensity when the samples were taken at later points in time. From this we would be able to conclude that more EGFP was being expressed as the bacteria spent more time in anaerobic conditions. The samples from MG1655 did show the right emission spectra, but there was no increase in intensity between the samples. That the signal was merely caused by scattering was excluded since a shift in excitation wavelength did not result in a shift in emission spectrum. The samples of the XL1-Blue expression, however, did show an increase in intensity. The results are shown in . Here scattering was also excluded. The fluorescence intensities of the peaks at λ = 508 nm are shown in . A comment on these measurements is that the gain was relatively high (187), which is a result of the low concentrations of EGFP formed.
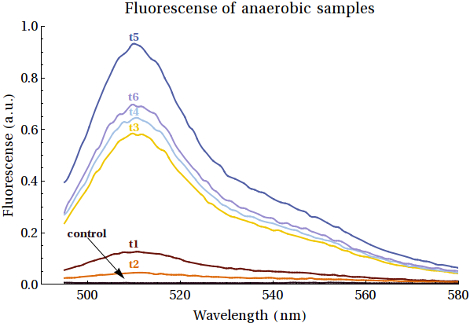
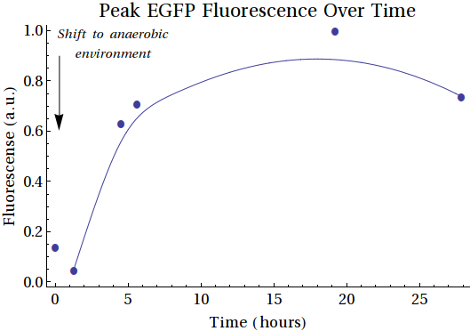
In , the second sample shows a decrease in intensity. This can be caused by the switch from aerobic to anaerobic metabolism so that the EGFP that was produced can be degraded until the bacteria are fully switched to anaerobic metabolism. Then the peaks increase, caused by higher concentrations of EGFP produced anaerobically by the bacteria. Another reason for this could be that the bacteria continued to grow and that the produced EGFP is background expression. The intensity of the last sample showed decreased intensity with respects to the peak of around 18-19 hours. This can also be caused by degradation of the produced proteins.
Discussion and Conclusions
SDS gel analysis of the unpurified samples from the XL1-Blue culture indicate that there are several proteins showing increased expression when the samples are left in anaerobic conditions for longer periods of time. Here the bands of interest were at the height of 45-50 kDa and around 30 kDa. After purifying by the His-Tag, the SDS gel did not contain the clear bands which it had on the unpurified gel, but there are bands at the same height (around 45-50 kDa) and bands around 29 kDa, which do show a slight increase in intensity, even if the relative intensity is marginal. Fluorescence measurements of the purified samples indicate that there is indeed EGFP expression and that the intensity increases when the cultures were exposed to the anaerobic environment. Here we have to place the comment that last measurement was lower than that of 10 hours before the end of the experiment. This could be caused by degradation of the proteins. Scattering was excluded by taking other excitation wavelengths that resulted in the same emission spectra. We can conclude that EGFP is expressed under the regulation of oxygen concentration, even though the concentrations are rather low resulting in low intensity bands on the purified SDS gel and a high gain for the fluorescence measurements. The low concentrations were to be expected however as the EGFP was not being over expressed and the samples taken form the BioReactor were a mere 20mL.
For the SDS gel of the unpurified MG1655 samples we saw some bands that indicate an increase of protein expression. These bands also show up on the purified samples SDS gel. The bands are at the same height as the bands on the unpurified gels, so they correspond. The fluorescence measurements for the purified MG1655 samples showed the correct emission spectra for EGFP. The spectra for the samples that were longer exposed did not have an increased intensity. Scattering was excluded by taking other excitation wavelengths, which resulted in the same emission spectra.
Overall we can conclude that the FNR promoter does work and EGFP is produced anaerobically. We do however recommend the XL-1-Blue bacterial strain for the expression of proteins under influence of the FNR promoter over the MG1655 E.coli strain.
References