"
"
Team:TU-Eindhoven/TimeKill
From 2013.igem.org


Contents |
Time-kill Behavior
By investigating into the time-kill behavior of bacteria, we will be able to predict when the bacteria die out and therefore able to decide the dose and frequency of administration. In this part we used the model proposed by Roland R.Regoes regoesModelRoland R.Regoes et al., Pharmacodynamic Functions: a Multiparameter Approach to the Design of Antibiotic Treatment Regimens. Antimicrobial Agents and Chemetherapy 48, 3670-3676 (2004).
Bacteria Growth in Tumor
It has been validated that bacteria grow enormously in tumor zone than the other human tissues bacteriaDistMinoru Fujimori, Bifidobacterium longum as a gene delivery system for cancer gene therapy. Gene Therapy and Molecular Biology 6, 195-200 (2001). From their study, the bacteria growth rate in tumor zone is estimated.
Time-kill Model
Following the model of Reagoes regoesModel, the following equation set are implemented in the model: $$ \eqalignno{ \Psi(\alpha) &= \Psi_{max} - \frac{(\Psi_{max}-\Psi_{min})(\alpha/zMIC)^{\kappa}}{(\alpha/zMIC)^{\kappa}-\Psi_{min}/\Psi_{max}}\\ \frac{dx}{x} &= \Psi(\alpha(t))dt }$$
where:
- $\Psi_{max}$ is the maximum growth rate in the absense of the drug
- $\Psi_{min}$ is the maximum die-out rate in the high concentration of the drug. It is present as a negative rate
- $\alpha$ is the antibiotic concentration
- $zMIC$ is the MIC value under which the net growth rate of bacteria is zero
- $\kappa$ is the Hill coefficient and measures the steepness of the curve.
Data Acquisition
| Data Name | Data Value | Source |
|---|---|---|
| $\Psi_{max}$, maximum growth rate of bacteria | 0.207 | the study from Fujimori bacteriaDist |
| $\Psi_{min}$, maximum die-out rate of bacteria | -6 | the study from Speciale GCVanalogA. Speciale et al., Minimal inhibitory concentrations and time-kill determination of moxifloxacin against aerobic and anaerobic isolates. International Journal of Antimicrobial Agents 19, 111-118 (2002) |
| $zMIC$, minimal inhibitory concentration | 0.03 | the study from Speciale GCVanalog |
| $\kappa$, the hill coefficient | 1 | the study from Speciale GCVanalog |
Result
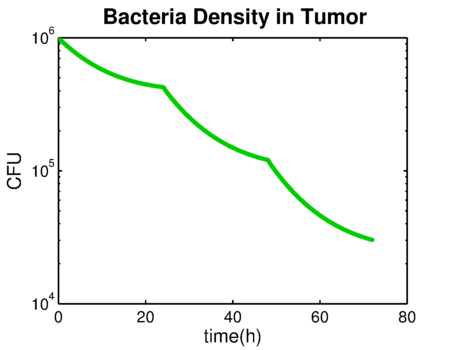
Taking the result of PBPK model as the input of time-kill function(). The GCV is administered once a day for 5mg/L intravenously.

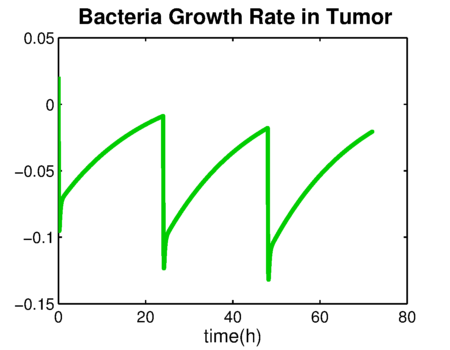
The bacteria growth rate is shown in . The negative value means that the number of bacteria is decreasing. The integration of bacteria growth rate is the time-kill curve in .
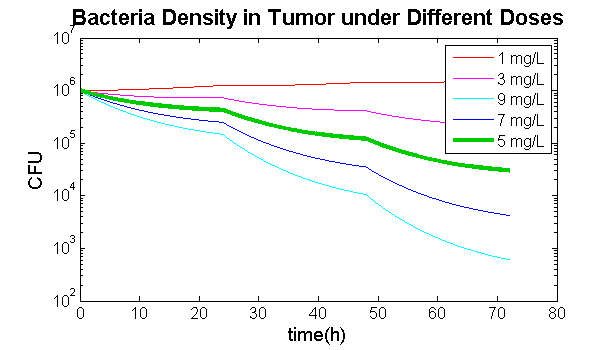
The comparison between different concentrations every day is in below. When the concentration is 1 mg/L, the bacteria continue to grow. When the concentration is 9 mg/L, the bacteria die out too fast. It shows that 5 mg/L is a proper concentration.
References
The source code of all models can be found here.