 "
"
Team:TecMonterrey/methods.html&action=edit
From 2013.igem.org


Methods
General Protocols
Transformation and Confirmation
The Escherichia coli strains used for our experiments were TOP10 and BL21 (DE3). DNA expression cassettes were confirmed by restriction enzyme digestion with EcoRI-HF (NEB) and agarose electrophoresis.
Induction
50 mL tubes were inoculated with each of the transformed BL21 (DE3) strains and incubated overnight in LB medium with the proper antibiotic (100ug/mL of ampicillin, 50 µg/mL of kanamycin, 35 µg/mL of chloramphenicol or 15 µg/mL of tetracycline) at 37°C and 250 rpm. After 12 hours of incubation, 250 mL flasks with 50 mL of LB medium with antibiotic were inoculated until 0.1 O.D.600nm (Genesys 10UV scanning, Thermo scientific) with the proper strain. The flasks were then incubated at 37°C and 250 rpm until they reached to an O.D.600nm between 0.4 and 0.6.
Cells were pelleted (IEC CL40R centrifuge, Thermo scientific) at 4°C and 4,000 g for 10 minutes, the medium was discarded and 50 mL of fresh medium were added and supplemented antibiotic and 0.1 mM IPTG and/or 1% L-arabinose. Cells were then incubated at 27°C and 250 rpm for 8 hours.
Cell Rupture
Cells were harvested by centrifugation at 4°C and 5,000 g during 10 minutes. Supernatant was discarded and the pellets were resuspended in 7 mL per gram of pellet in lysis buffer (5% v/v Tween-20 in 25 mM K2HPO4 pH 7.5).
Cells were sonicated (Branson Sonifier 150) on ice, during 3.17 minutes with 10 seconds intervals (10 seconds pulses and 10 seconds for cooling). The lysate was then centrifuged at 4°C for 15 minutes at 5,000 g.
The soluble fractions were recovered, while the insoluble fractions were suspended with 5 mL lysis buffer pH 7.2 supplemented with 8 M urea, incubated at 37°C for 1 hour and then centrifuged at 4°C and 10,000 g for 20 minutes. The supernatant containing the solubilized fraction was recovered. Both the soluble and insoluble-treated fractions were measured for protein concentration by Biuret assay (200µL of sample + 800µL of Biuret reagent incubated for 15 minutes at room temperature).
Purification
Purification was conducted according to the HisPur Ni-NTA Spin Purification Kit recommendations (Thermo Scientific, product number #88229).
Concentration
The eluents from the purification (around 9 ml) were concentrated with 3 KDa ultrafiltration tubes until only 1.5 ml remained. (Amicon Ultra-15 Centrifugal Filter Units, Catalogue number #UFC900324). After concentration, protein quantity was determined by Biuret's method.
Tricine-SDS PAGE
The Tricine-SDS PAGE was done accordingly to the protocol by (Schägger, H., 2006), on a Miniprotean 3 cell (BIO-RAD).
Western Blot
The Tricine-SDS PAGE gel was then blotted into a PVDF membrane according to the protocol mentioned in the “Mini Trans Blot" manual (BIO-RAD) and the suggested transfer buffer (25 mM Tris, pH 8.3, 192 mM glycine) during 1 hour at 100 Volts. The Western blot was done accordingly to the Pierce® Fast Western Blot Kit, ECL Substrate protocol (Thermo Scientific Catalogue Number #35050). Using as primary antibody an Anti-polyHistidine Peroxidase Conjugated antibody (Sigma Catalog number #A7058).
Therapeutic Proteins Methods
Transformation and Confirmation
The transformation and confirmation protocol were followed as established in the General protocols section. The strains were transformed with the expression cassettes:
Tat-Apoptin

TRAIL

Tat-Apoptin-HlyA

TRAIL-HlyA

The transformations were confirmed by selective growth of colonies in plates with Ampicillin (100ug/ml) Furthermore the colonies were confirmed by restriction enzyme digestion with EcoRI-HF (NEB) and electrophoresis.
Induction, Cell Rupture, Purification, Concentration, Tricine-SDS PAGE and Western Blot
The induction, cell rupture, purification, concentration, Tricine-SDS PAGE and Western Blot protocols were performed as specified in the General protocols section with no modifications.
CitotoxicityMTT Assay
The MTT assay (3-(4,5-dimethylthiazol-2-yl)-2,5-diphenyltetrazolium bromid, is based on the conversion of the reagent MTT into formazan crystals by viable mammal cells, due to the activity of a specific enzyme located in the mitochondrion. By exploiting this enzymatic activity of dehydrogenase enzymes, the assay can indirectly measure the cell viability of a cell culture through its metabolic activity. This method is one of the most used to measure cytotoxic activity of drugs, extracts and compounds on different cell lines (Meerloo, J. v., Kaspers, G. J., & Cloos, J., 2011).
The assay conditions used in the experiment may influence the results and must be considered during the analysis of data. The age of cell lines, the passage number and requisites of the medium may be important factors that can affect the results. Due to variation on the requirements and growth rates of each cell line, it is difficult to establish specific guidelines for the execution of this experiment; however, cells are usually cultivated at a cell density of 5,000-10,000 cells per well (this density should be enough to reach an optimum density in 48-72 hours). The presence of phenol red may affect seriously the result, and for this reason it is highly recommended to culture the cells in a phenol red free medium (Vybrant® MTT Cell Proliferation Assay Kit, 2002).
The assay is divided in different procedures:
- 96 well cell culture plate preparation.
- Sample addition to 96 well cell culture plate.
- Cell viability measurement.
- Data analysis.
- 96 well cell culture plate preparation.
During this first part of the assay, cells are transferred from a culture dish to a 96 well cell culture plate. - Exponentially grown cells were trypsinized according to (Trypsinization of adherent cells, 2002).
- The cells were suspended in D-MEM/10% SBF medium until it reached a cell density of 5x10⁵ cells/ml.
- For each well, 100µl were plated (50,000 cells) on a 96 well microplate according to the layout shown in Appendix 1.
- The cells were incubated for 24 hours at 37oC and 5% C02.
- Sample addition to culture plate.
After 24 hours of incubation of the cell culture microplate, the sample (extract or isolated compound) to be evaluated is added to the culture plate. - Solutions of the samples (TRAIL and Tat-Apoptin) at different concentrations were prepared by diluting in D-MEM/10%SBF medium.
* For each concentration, prepare 450 µl. - The medium from the microplate was discarded and the cells were washed twice with PBS pH 7.4
- Samples were added to the wells according to the layout shown in Appendix 1.
* For the sample control and blank wells, only was added 100 µl of D-MEM/10%SBF medium. - Cell cultures were homogenized with soft “eight shaped movements" on the surface of the hood.
- The microplate was incubated for 48 hours at 37 oC and 5% C02.
- Cell viability measurement.
After 48 hours of incubation with the extract or compound to be evaluated, cell viability is measured with the MTT reagent. - 20 µL of MTT reagent were added to each one of the 96 wells.
- Culture plates were placed back into the culture chamber at 37oC and 5% CO2 for 1 hour.
- Absorbance was read at 570 nm.
*To ensure that the protocol was performed correctly, make sure that the wells have an absorbance between 0.9‹Abs‹1. - Cell culture medium and culture plate were disposed of in the proper containers.
- Data analysis
-
For each sample concentration, the following calculation was made:

Where:

n= 3
a= Sample concentration replicates
m= 18
b= Cells replicates
z=
c= Blank replicates - Once the cell viability was obtained for each concentration, the data was plotted by comparing concentration vs. cell viability.
*The adjustment of the data can be made with different regression models: linear, quadratic, exponential, etc. depending on the data obtained. - With a regression model, the concentration of sample for which it is reached 50% of cell viability (IC50) was obtained.
Secretion System Methods
For the secretion module, our team took two different approaches. The first one made use of Escherichia coli BL21 (DE3) co-transformed with a GFP fused to a HlyA secretion peptide in its C terminus and another construct containing the proteins needed for secretion HlyB and HlyD; as a negative control another E. coli BL2 (DE3) was co-transformed with a non-tagged GFP and the same construct containing the proteins needed for secretion HlyB and HlyD in order to measure and compare fluorescence from the contents outside the cell, and those inside (Supernatant and soluble fractions). For a second approach we co-transformed E. coli BL21 (DE3) with a construct containing TAT-Apoptin tagged with both a Histidine6x tag and the secretion signal HlyA with another construct containing the proteins needed for secretion HlyB and HlyD; then we con-transformed E. coli BL21 (DE3) with a construct containing TRAIL tagged with both a Histidine6x tag and the secretion signal HlyA with the same construct containing HlyB and HlyD. Finally we did a Western Blot assay in order to determine and compare presence of TAT-Apoptin-HlyA and TRAIL-HlyA in the supernatant and soluble fractions of the cell cultures.
Co-Transformation and Confirmation
The E. coli strains (TOP10 or BL21 (DE3)) previously transformed with the construct containing HlyB and HlyD were re-transformed with GFP-HlyA, TAT-Apoptin-HlyA and TRAIL-HlyA, producing the following strains:
GFP-HlyA+Secretion System


GFP+Secretion System

TRAIL-HlyA+Secretion System
TAT-Apoptin-HlyA+Secretion System
The transformations were confirmed by selective growth of colonies in plates with both Kanamycin (50ug/ml) and Ampicillin (100ug/ml) since the secretion construct contain a Kanamycin resistance gene and the GFP, TRAIL-HlyA and TAT-Apoptin-HlyA containg an ampicillin resistance gene. Furthermore the colonies were confirmed by restriction enzyme digestion with EcoRI-HF (NEB) and electrophoresis.
Induction
50 mL tubes were inoculated with each of the transformed BL21 (DE3) strains and incubated overnight in LB medium with the proper antibiotic (100ug/mL of ampicillin and 50 µg/mL of kanamycinat) 37°C and 250 rpm. After 12 hours of incubation, 250 mL flasks with 50 mL of LB medium and antibiotic were inoculated until 0.1 O.D.600nm (Genesys 10UV scanning, Thermo scientific) with the proper strain. The flasks were then incubated at 37°C and 250 rpm until they reached to an O.D.600nm 1.
Cells were pelleted (IEC CL40R centrifuge, Thermo scientific) at 4°C and 4,000 g for 10 minutes, the medium was discarded and 50 mL of fresh medium were added and supplemented with the proper antibiotic, 0.1 mM IPTG and 1% L-arabinose. Cells were then incubated at 27°C and 250 rpm for 8 hours.
Fluorescence Measurement
In the case of GFP and GFP-HlyA, supernatants and soluble fractions were analyzed for fluorescence in a Biotek Synergy HT, plate reader (Excitation 485/20, Emission 528/20, Sensitivity 20).
Cell Rupture
Cell rupture was performed as specified in the General protocols section with no modifications. The soluble fraction from the lysate and the supernatant from induction were kept at 4 °C.
Purification, Concentration
Purification was only required for the proteins with a Histidine6x tag, TRAIL-HlyA, TAT-Apoptin-HlyA, and both the supernatant and the soluble fractions were purified as specified in the General Protocols section.
Tricine-SDS-Page
Tricine-SDS PAGE was performed as specified in the General Protocols section with no modifications.
Western Blot
Only those proteins with a histidine6x tag were blotted as specified in the General Protocols section with no modifications.
Internalization of TAT-GFP Protein into Eukaryotic Cells
This experiment aims to prove that the Tat peptide, a protein transduction domain (PDT) from the human immunodeficiency virus (HIV), is capable of deliver proteins into eukaryotic cells. To achieve this, the carrier Tat peptide and the transported protein (green fluorescent protein, GFP) were associated by genetic construction leading to a fusion protein expressing the PTD at its N-terminus followed by a His-Tag sequence. Taking advantage of the characteristics of the GFP, the protocol described by (Silhol, M. et al, 2002) was followed with some modifications.
Transformation and Confirmation
The transformation and confirmation protocol were followed as established in the General Protocols section. The strains were transformed with the expression cassettes:
- HG: His GFP
- TG: Tat-GFP
Induction, Cell Rupture, Purification and Concentration
The induction, cell rupture, purification and concentration protocols were performed as specified in the General protocols section with no modifications.
Internalization Assay
- Exponentially growing cells (NIH-T3 and CACO-2 cell lines) were plated on 24-well microplate (5x10⁵ cells per well) and cultured overnight at 37°C. *Three wells were left without cells to use as blank.
- The medium was discarded and the cells were washed twice with PBS pH 7.4
- The cells were incubated 1 hour at 37°C with 500 µL of 1-10µg/mL of Tat-GFP dissolved in serum-free medium according to the following layout.
*In the control group we used 1µg/mL GFP alone dissolved in serum-free medium.

*CL=cell line, both cell lines used in this experiment were plated as showed above. - After incubation, medium was removed and stored for further analysis, and the cells were washed three times with PBS pH 7.4
- Cells were trypsinized according to (Trypsinization of adherent cells, 2002) and pelleted by centrifugation at 14,000 g for 10 minutes.
- Medium was discarded by decantation and the cells were suspended in 100µL of lysis buffer (1% v/v Triton-X100 in 10mM KCl) and incubated in ice for 1 hour with a gently shake every 15 minutes.
- Protein concentration was measured by Biuret method (200uL of sample + 800uL of Biuret reagent incubated for 15 minutes at room temperature).
- Analyze cell lysates by Tricine-SDS PAGE and Western blot (specific for His-tagged proteins) according to the protocol specified in the General protocols section.
With the supernatant stored from the fifth step, a second test was performed to quantify the amount of Tat-GFP protein that enters in each cell. The samples were plated in a 96-well microplate according to the following layout:

The microplate was read in the Synergy HT KC4 BioTek fluorescent microplate reader. The emission wavelength was set to 525nm and the excitation wavelength to 485 nm.
Internalization Assay. Version II
- A 21mL culture of CHO-S cells (7.86x10⁵ cells/mL) was divided into three 15mL tubes.
- The cells were pelleted by centrifugation at 5,000 rpm for 5 minutes.
- The medium was discarded and the cells were washed twice with PBS pH 7.4
- Cells were incubated for 1 hour at 37°C with:
- Tube 1) 1mL of 1.3 µg / mL of TG dissolved in serum free medium.
- Tube 2) 1 ml of 1.3 µg / mL of HG dissolved in serum free medium.
- Tube 3) 1 ml of serum-free medium (control).
- After incubation, the cells were pelleted by centrifugation at 5,000 rpm for 5 minutes and the medium was removed and stored for further analysis. The cells were washed three times with PBS pH 7.4
- The cells were lysed using the All Prep® DNA/RNA/Protein mini kit.
- The cell lysates and the supernatants were analyzed by Tricine-SDS PAGE and Western blot (specific for His-tagged proteins) according to the protocol specified in the General protocols section.
Hypoxic Promoters Characterization Protocol
This module aims to observe the induction of promoters under anoxic and aerobic conditions, to prove their functionality.
Transformation and Confirmation
The transformation and confirmation protocol were followed as established in the General protocols section. The strains were transformed with the expression cassettes:
- pFG: FNR promoter GFP
- pnG: nirB promoter GFP
- pHG: HIP-1 promoter GFP
Promoter Characterization (pHG)
- Six groups of two Corning® 50mL tubes were inoculated with pHG cells, each one in aerobic (tube with a swab) and anoxic (totally closed) conditions.
- Each one of the six groups was grown for different periods of time (4h, 8h, 24h, 48h, 72h and 96h) at 37°C and 250 rpm.
- After each assigned period of incubation, the cells were harvested and lysed according to the cell rupture protocol (General protocols section).
- The protein concentration of the soluble fraction was measured by Biuret method (200µL of sample + 800µL of Biuret reagent incubated for 15 minutes at room temperature).
- The samples were plated in a 96-well microplate according to the following layout to determine the fluorescence:

- The microplate was read in the Synergy HT KC4 BioTek fluorescent microplate reader. The emission wavelength was 525nm and the excitation wavelength was 485 nm.
Bioreactor protocol (pFG & pnG)
This protocol aims to establish the oxygen concentration in which each of the two promoters induce expression.
- BL21 (DE3) Escherichia coli transformed cells with a GFP coding sequence controlled by a hypoxia inducible promoter, were inoculated in 40 ml LB broth with 100ug/ml of ampicillin and grown overnight at 37°C and 250 rpm.
- A bioreactor (Sartorius Biostat ® A plus) with 500 ml of LB broth was inoculated with the overnight culture till 0.1 O.D.600nm and closed to prevent air entry.
* The bioreactor was set at 250 rpm. The concentration of oxygen in the liquid was monitored until it got a maximum percentage, this number was established as the maximum concentration of oxygen (100%) that could dissolve in the liquid at the agitation rate indicated above. - The culture was grown for six hours.
- A sample of 15 ml of culture was taken every hour monitoring the relative percentage of oxygen.
- Cells were harvested and lysed according to the cell rupture protocol (General protocols section).
- The concentration of protein was calculated with Biuret method (200µL of sample + 800µL of Biuret reagent incubated for 15 minutes at room temperature).
- Fluorescence was measured in a 96 well microplate fluorescence lector (Synergy HT KC4 BioTek) according to the following layout.
* The emission wavelength was set to 525nm and the excitation wavelength to 485 nm.
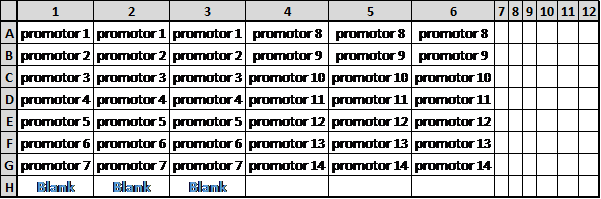
* Promotor can be defined as pFG or pnG.
References:
- Meerloo, J. v., Kaspers, G. J., & Cloos, J. (2011). Cell Sensitivity Assays: The MTT Assay. Methods in Molecular Biology, 731, 237-245.
- Trypsinization of adherent cells. (2002). The cell center. Johns Hopkins University, 1, 2.
- Vybrant® MTT Cell Proliferation Assay Kit. (2002, March 27). Life Technologies Protocols. Retrieved May 14, 2013, from es-mx.invitrogen.com/site/mx/es/home/References/protocols/cell-culture/mtt-assay-protocol/vybrant-mtt-cell-proliferation-assay-kit.html
- Silhol, M., et al. (2002). Different Mechanisms For Cellular Internalization Of The HIV-1 Tat-derived Cell Penetrating Peptide and Recombinant Proteins Fused to Tat. European Journal of Biochemistry, 269(2), 494-501.
- Trypsinization of adherent cells. (2002). The cell center. Johns Hopkins University, 1, 2.
- HisPur Ni-NTA Spin Purification Kit. (n.d.). Thermo scientific. Retrieved September 27, 2013, from http://www.piercenet.com/instructions/2162206.pdf
- Pierce® Fast Western Blot Kit, ECL Substrate. (n.d.). Thermo scientific. Retrieved September 27, 2013, from http://www.piercenet.com/instructions/2162133.pdf
- Schägger, H. (2006). Tricine–SDS-PAGE. Nature protocols, 1(1), 16-22.