"
"
Team:Tsinghua-A/md
From 2013.igem.org
Overview
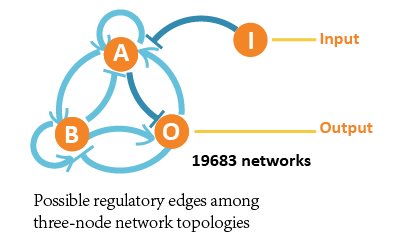
The expression of interacting genes depends on the structure of gene regulatory networks (GRN). In order to figure out optimal biological networks that can function reliably when faced with fluctuation of DNA template amount (copy number), it is important to do some simulations in advance to narrow the screening scope and theoretically discuss certain functional regulatory motifs that are significant in showing adaptation. Therefore, it would be easier for us to search for and verify adaptive and robust networks in wet lab. In our project, we abstractly analyzed gene regulatory network topologies and computed all possible three-node network structures by enumeration. We modeled, calculated, tested and made comparisons, and finally screened 2 core optimal network structures out of 19683 network structures, which show great adaptation to DNA copy number. In order to verify the correctness of our screening result, we introduced an optimal testing case and simulated. Based on our screening results, we analyzed and concluded 9 key motifs that may be essential to adaptation. We respectively simulated these motifs and tried to explain their characters with mathematical proof. Finally we figured out that these key motifs can be combined to obtain better effects.
Construction of Networks And Mathematical Description -- ODE Equations
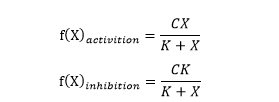
We based on the Michealis-Menten Equation and Hill Equation to describe the kinetics of gene regulatory networks. The M-M Equation and Hill Equation describe the relationship between the production rate of products and the concentration of substrate.
M-M Equations of activation (monotone-increasing) and inhibition (monotone-decreasing) are defined as:
 Hill Equations of activation (monotone-increasing) and inhibition (monotone-decreasing) are defined as:
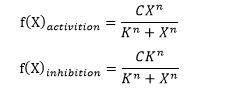 (C is a constant, K is called half maximal effective concentration and n is called hill coefficient.)
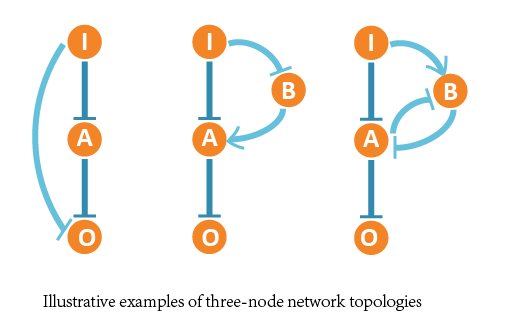
In our project, we aimed at all three-node network structures, and each contains 4 nodes (1 input node, 2 regulatory nodes and 1 output node) and vast possible regulatory edges among them.
(C is a constant, K is called half maximal effective concentration and n is called hill coefficient.)
In our project, we aimed at all three-node network structures, and each contains 4 nodes (1 input node, 2 regulatory nodes and 1 output node) and vast possible regulatory edges among them.
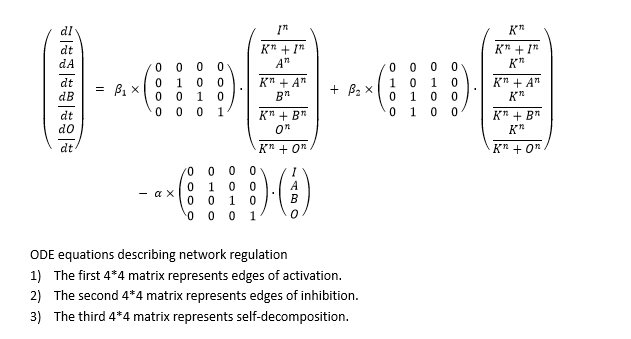
 So we formed ODE equation sets to describe the mutual relationships and form networks. The ODE equation sets involve two 4*4 matrices to respectively bring in the activating effect and inhibitive effect, and a column vector for self-decomposition.
 In our wet lab part, we synthetized network and constructed plasmids transferred into Hela cells, and we made some adjustment in our design for a better realization in experiment:
We assumed that input (I) is not regulated by the network and remains constant.
We fixed two certain edges (I inhibits A, A inhibits O), because when constructing the system, the components to function as inducers are quite few. So we tend to use 2 repressors to substitute it.
We limited the maximum number of regulatory nodes to 2 to restrict the problem to an acceptable scale.
We chose relative parameters close to the actual experiments in our simulation. According to previous research, we guaranteed that most parameters are within the already confirmed range, such as reaction rate.
In our wet lab part, we synthetized network and constructed plasmids transferred into Hela cells, and we made some adjustment in our design for a better realization in experiment:
We assumed that input (I) is not regulated by the network and remains constant.
We fixed two certain edges (I inhibits A, A inhibits O), because when constructing the system, the components to function as inducers are quite few. So we tend to use 2 repressors to substitute it.
We limited the maximum number of regulatory nodes to 2 to restrict the problem to an acceptable scale.
We chose relative parameters close to the actual experiments in our simulation. According to previous research, we guaranteed that most parameters are within the already confirmed range, such as reaction rate.
Basic Function Analysis -- Massive Parallel Data Processing
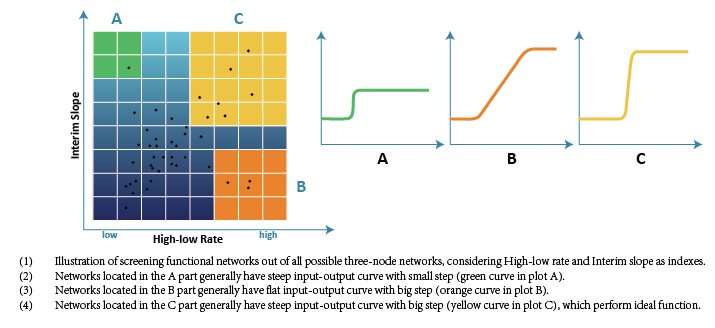
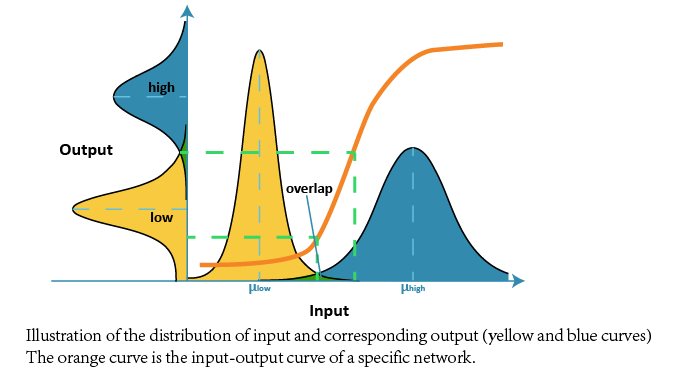
The ideal network in our project must be sensitive to the input signal and be able to distinguish the low input and high input from each other. So we expected that the target structure should have a low-input-low-output and high-input-high-output character. Besides, it should avoid ambiguous interim region between low input and high input.
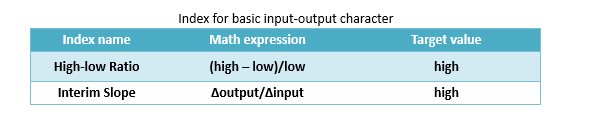
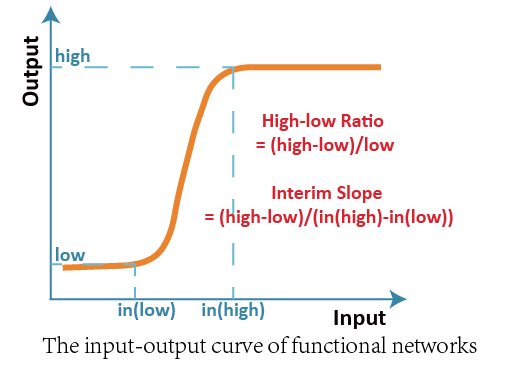 We firstly raised two basic indexes, High-low Ratio and Interim Slope to evaluate the performance of all three-node network structures. To each structure, we scanned the value of input ranging from 1 to 1000 and recorded the corresponding output.
 Then we enumerated all possible network structures and illustrated the filtering result in a 2D map. The X-axis represents High-low Ratio and the Y-axis represents Interim Slope, and there are 19683 three-node structures illustrated as docs in grids in the map.
According to our target, only networks with high High-low Ratio and high Interim Slope can achieve the required function. In other words, only networks located in the top-right corner of the map are acceptable.
Then we enumerated all possible network structures and illustrated the filtering result in a 2D map. The X-axis represents High-low Ratio and the Y-axis represents Interim Slope, and there are 19683 three-node structures illustrated as docs in grids in the map.
According to our target, only networks with high High-low Ratio and high Interim Slope can achieve the required function. In other words, only networks located in the top-right corner of the map are acceptable.
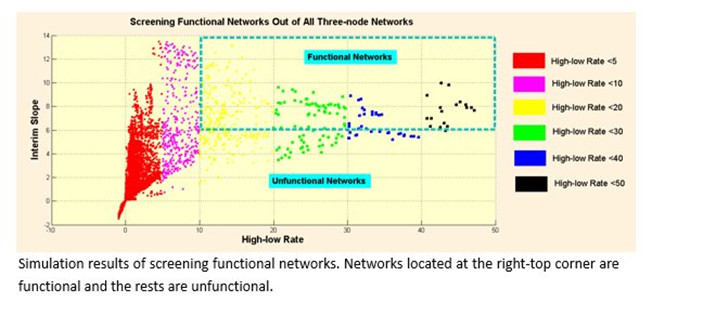 Finally we screened 476 three-node network structures out of 19683 network structures in total, which can achieve the high High-low Ratio and high Interim Slope.
The whole process involved massive calculation and parallel data processing. Especially, it requires serious computing power to solve all the ODE equations of 19683 networks and computer cluster is a powerful tool. Computer cluster connects a group of incompact computers which collaborate together to offer stronger processor power and larger space. We finished the first round of screening with the help of High Performance Computing Cluster (HPCC) in Tsinghua University.
Finally we screened 476 three-node network structures out of 19683 network structures in total, which can achieve the high High-low Ratio and high Interim Slope.
The whole process involved massive calculation and parallel data processing. Especially, it requires serious computing power to solve all the ODE equations of 19683 networks and computer cluster is a powerful tool. Computer cluster connects a group of incompact computers which collaborate together to offer stronger processor power and larger space. We finished the first round of screening with the help of High Performance Computing Cluster (HPCC) in Tsinghua University.
Adaptation to Copy Number -- Decision Based on Probability Distribution
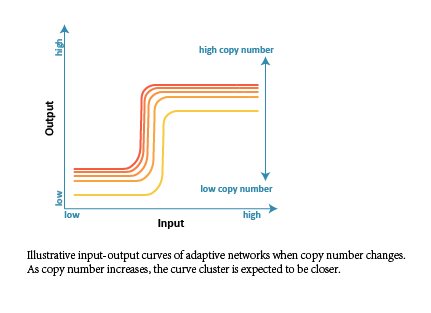
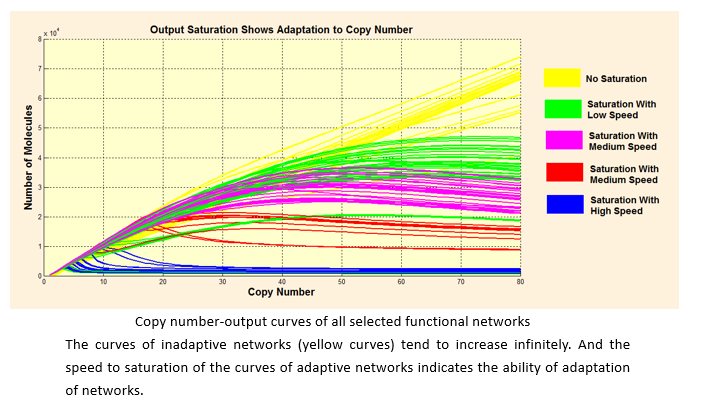
In order to obtain an ideal and robust network which is adaptive to DNA template abundance (copy number), we firstly did parameter scan analysis and made comparisons among all the selected 476 structures intuitively. We changed the range of reaction rate to represent the change of copy number (proportional relationship), and expected to get a cluster of input-output curves (when copy number changes). Besides, we analyzed the correlativity between copy number and output, and expected the curve to be saturated.
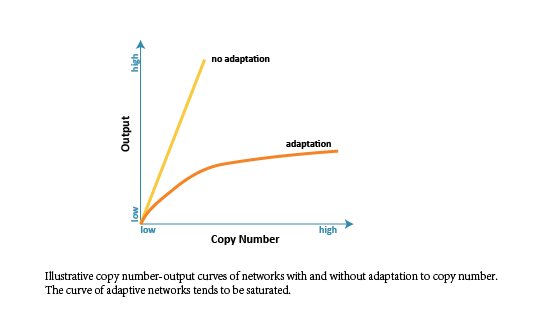 Since the target network structure is supposed to robustly distinguish different cells with either low or high endogenous input signal, there needs to be a saturated tendency to copy number. In other words, the output shouldn’t infinitely increase when the value of copy number increases, especially when the input is low. Otherwise, the network would wrongly regard the low-input kind of cell as the high-input kind when copy number is at high level.
According to our simulation, we selected 111 network structures that tend to be saturated out of 476 structures.
Since the target network structure is supposed to robustly distinguish different cells with either low or high endogenous input signal, there needs to be a saturated tendency to copy number. In other words, the output shouldn’t infinitely increase when the value of copy number increases, especially when the input is low. Otherwise, the network would wrongly regard the low-input kind of cell as the high-input kind when copy number is at high level.
According to our simulation, we selected 111 network structures that tend to be saturated out of 476 structures.
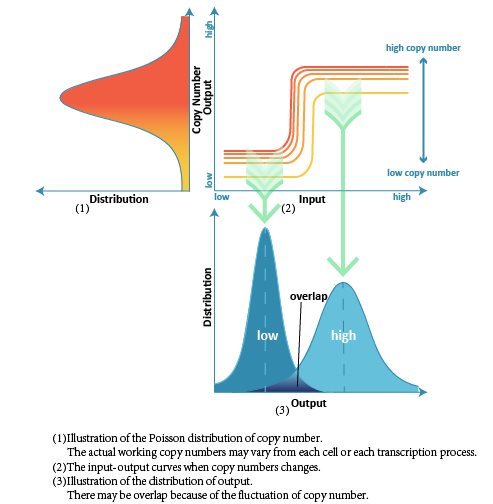
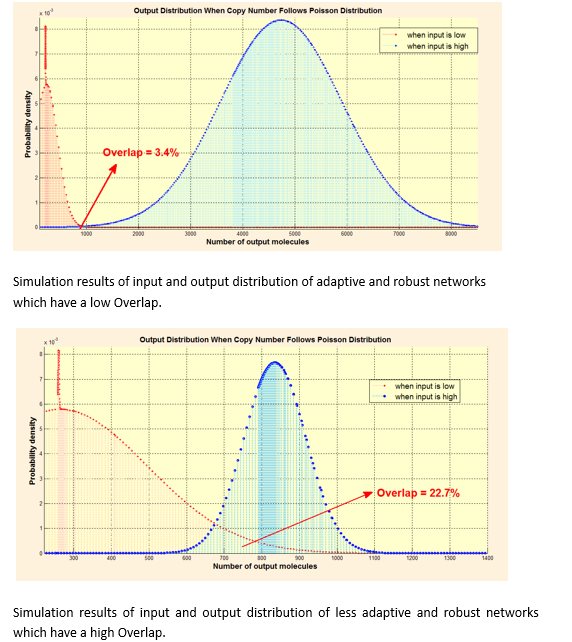
 Considering that the actual number of DNA templates that may be transferred into cells is not certain but rather follows a certain distribution in probability, we assumed that the copy number follows Poisson distribution. Then we studied each kind of distribution output follows when inputs are low and high respectively. For a better quantized comparison among the 111 structures, we raised Overlap (the covering part of two output distribution) as index, and hoped to get the optimal network with lowest Overlap.
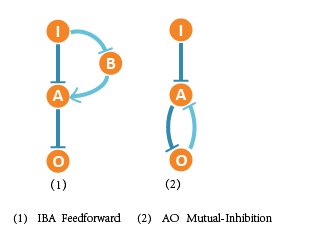
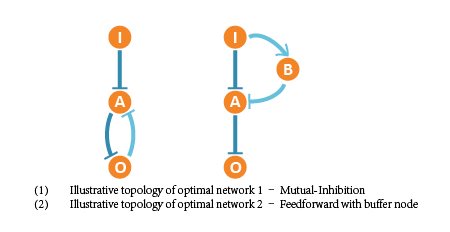
 Finally we figured out 2 optimal network structures, and the corresponding network structures contain following core topologies.
 Compared with unsaturated networks, the 2 optimal network performance well when copy number follows Poisson distribution.
 Because the target network is expect to be functional in distinguishing different cells, we designed a simulated screening test (sorter case) to verify our results above.
In this optimal test, we offered 1000 cell A with low amount of endogenous microRNA (low input) and 1000 cell B with high amount of endogenous microRNA (high input). And both of them followed Gaussian distribution. Then we packed the network as a black box sorter which only receives these different cells and tries to distinguish them correctly. We then counted the number of the sorting results, compared with correct decisions and calculated the Accuracy Rate. The low overlap of optimal networks indicate adaption to DNA copy number.
Because the target network is expect to be functional in distinguishing different cells, we designed a simulated screening test (sorter case) to verify our results above.
In this optimal test, we offered 1000 cell A with low amount of endogenous microRNA (low input) and 1000 cell B with high amount of endogenous microRNA (high input). And both of them followed Gaussian distribution. Then we packed the network as a black box sorter which only receives these different cells and tries to distinguish them correctly. We then counted the number of the sorting results, compared with correct decisions and calculated the Accuracy Rate. The low overlap of optimal networks indicate adaption to DNA copy number.
Further Analysis -- Functional Motifs
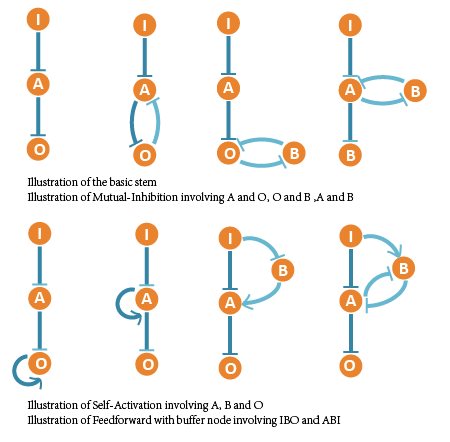
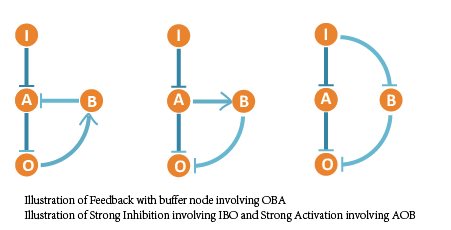
After the verification, we made some attempts to summarize the core motifs of these selected optimal networks that are to the benefits of adaptation. Moreover, we wished to figure out the significant characters of these motifs and a general rule of constructing adaptive networks.
We noticed that the optimal network contains some basic regulatory modules besides the 3 core topologies we have screened out. Most of the rather functional and robust networks are combinations of these regulatory modules. So we listed them and discussed their effect intensity to saturation and adaptation with further simulation.
 We ranked all 111 networks that show adaptation to copy number and classified them into 10 groups. Each group represents networks containing certain core topology structures – motifs above. So we arranged the core motifs according to their appearing frequency in robust and adaptive networks.
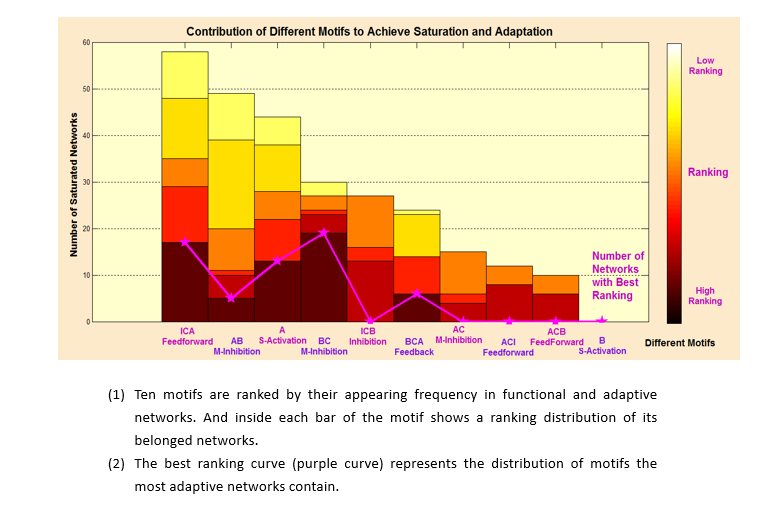 We found that more than half of the 111 adaptive networks contain the core motif of IBA Feedforward, and very high portion of networks with best ranking also contain this motif. Both clues indicate that IBA Feedforward is an optimal network. Beside, AO Mutual-Inhibition also exists in most best-ranking networks, which shows that AO Mutual-Inhibition contributes to adaptation to DNA copy number.