 "
"
Team:UCSF/Modeling
From 2013.igem.org
| Line 231: | Line 231: | ||
src="https://static.igem.org/mediawiki/2013/6/69/Modeling_SSPlot-2.png"></center></div> | src="https://static.igem.org/mediawiki/2013/6/69/Modeling_SSPlot-2.png"></center></div> | ||
| + | <div id="description" style = "width:950px; height:125px" align="justify"> | ||
| + | <font face="calibri" size = "4"> | ||
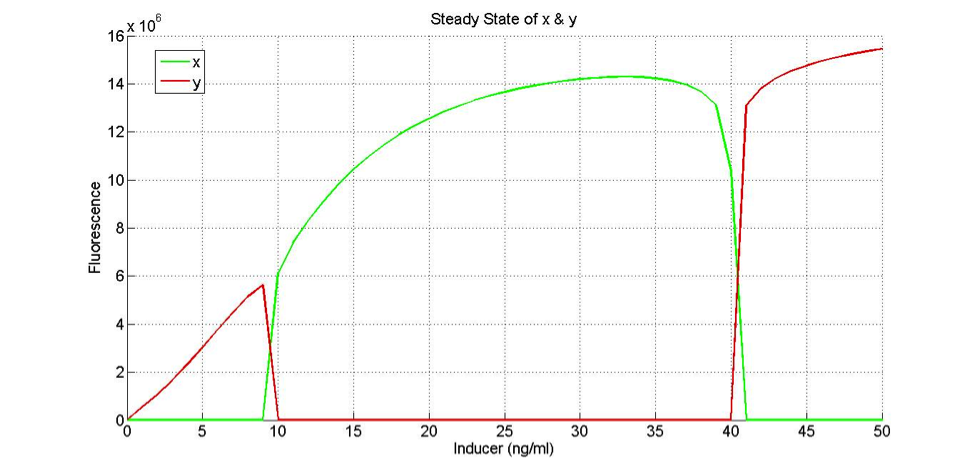
| + | It is similar to the first graph in that the switch between GFP and RFP is sharp. However, RFP is being expressed in both low and high concentrations of inducer, while GFP is being expressed in medium concentrations. | ||
| + | <br><br> | ||
| + | <b>How does the model look with our actual “low” and “high” promoters?</b> <br> | ||
| - | + | If the only change in the low and high functions (FH and FL) is the K values (which determine the sensitivity of the promoters), then we don’t get our desired behavior | |
| - | + | ||
</div> | </div> | ||
</html> | </html> | ||
Revision as of 03:32, 28 September 2013


The primary goal of the modeling portion for the synthetic circuit project is to create a model that will help us figure out the right parameters, given our assumptions, which will generate the desired result. The model can help us test out different promoters and repression strengths in the computer without wasting time trying to do all of that in the lab. The circuit is designed to produce different outputs according to different levels of inducer by utilizing the CRISPRi system. In lower concentrations of inducer, the guide RNA (gRNA) will be made to repress RFP. In higher concentrations of inducer, another gRNA will be made to repress GFP. Since our circuit should express GFP at lower inducer concentrations and RFP at high inducer concentrations, we should expect the graph to look something like the one below:


ASSUMPTIONS: While creating the model for our system, we made five assumptions in order to simplify some of the aspects of the model:
1) protein degradation is linear;
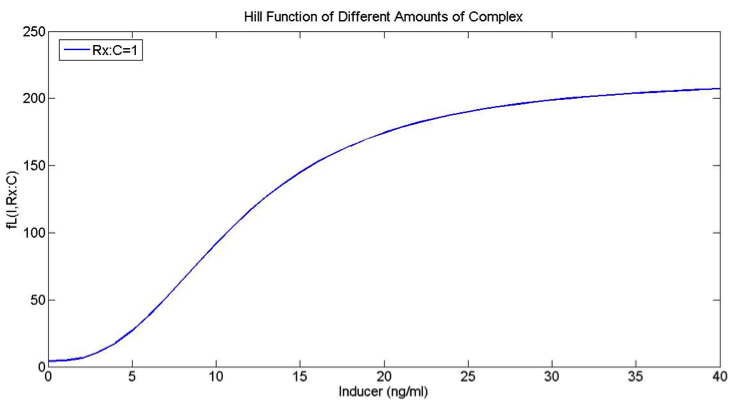
2) protein production is based on a hill function and also depends on inducer concentration;
3) repression is governed by a hill function and depends on the concentration of dCas9 and gRNA complex;
4) that the binding and unbinding of dCas9 and gRNA complex happens much faster than the production/degradation of gRNA and fluorescent proteins (the complex is at Quasi Steady State).
5) everything diffuses quickly throughout the cell so that our differential equations depends on the concentration at any given time.
VARIABLES:

EQUATIONS:
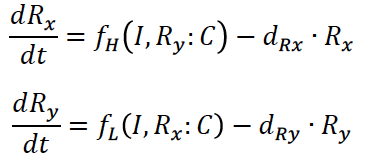
For fluorescent proteins


Protein Production Equations Depend on Inducer & Repressor Complex:


These next two equations describe the binding and unbinding of the gRNA and dCas9 complex:
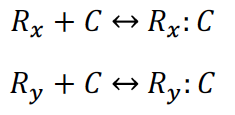
Repressor (gRNA) & Repressor/dCas9 Complex:

gRNAs:
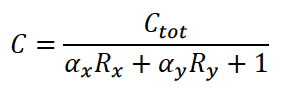
Amount of dCas9 Available in the System:
The equations for the gRNAs depend on the amount of the gRNAs that is produced, the degradation rate, and also the rate at which the gRNA complexes with dCas9.
The available amount of dCas9 depends on the amount of the two different complexes and also the amount of free dCas9.
This model has many parameters, so in order for it to be more useful, we need to reduce the number of parameters that are undetermined. To accomplish this, we gathered some values from literature and also did experiments to find other parameters.
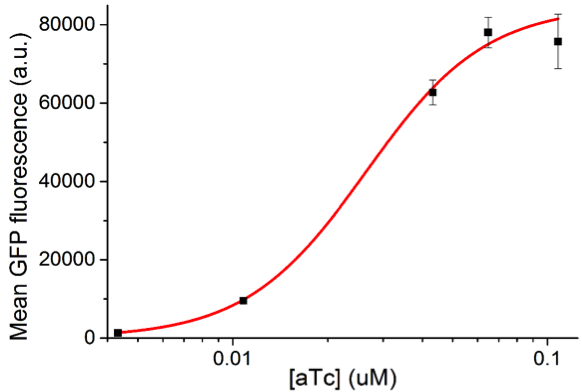
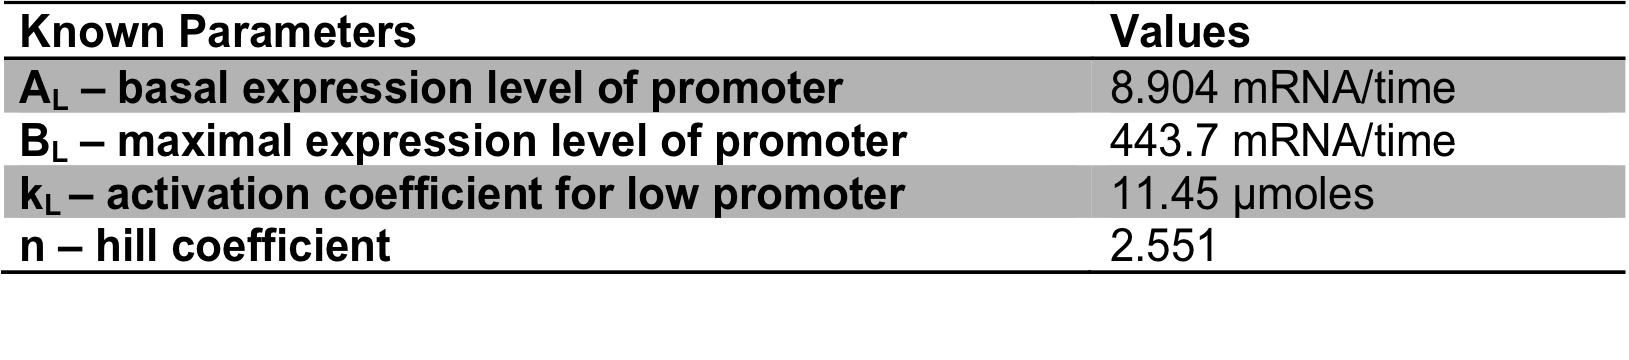
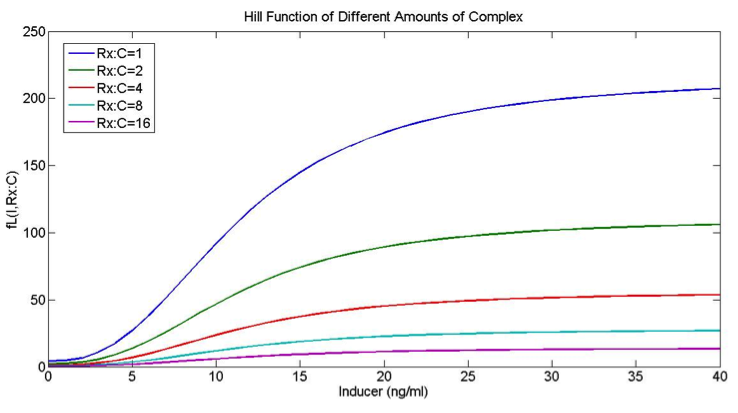
How does the system change when the hill coefficient is manipulated? In this first plot, the hill coefficients for both the low and the high function are the same number: 2.551. This number is the one we determined from our experimental data.
nL = 2.551
nH = 2.551
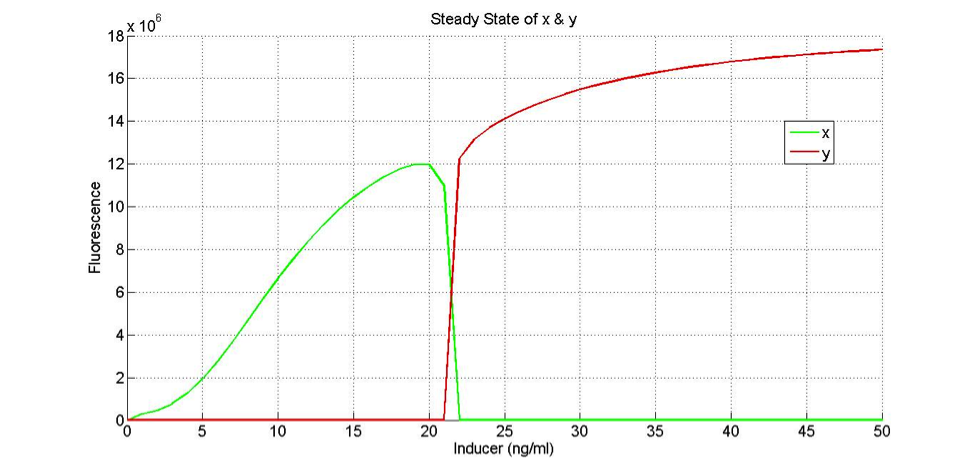
nL = 2.551
nH = 1.551
How does the model look with our actual “low” and “high” promoters?
If the only change in the low and high functions (FH and FL) is the K values (which determine the sensitivity of the promoters), then we don’t get our desired behavior