"
"
Team:UESTC Life
From 2013.igem.org
(Difference between revisions)
| Line 321: | Line 321: | ||
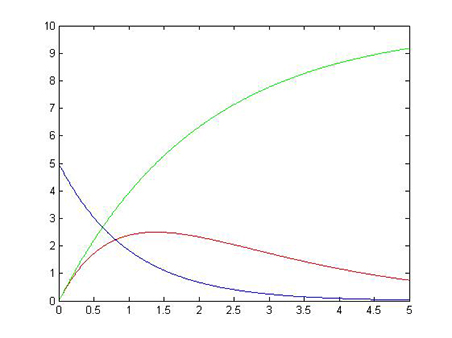
<h1>First Model</h1> | <h1>First Model</h1> | ||
<img src="https://static.igem.org/mediawiki/2013/7/7b/UestclifeUntitled.jpg" alt="" /> | <img src="https://static.igem.org/mediawiki/2013/7/7b/UestclifeUntitled.jpg" alt="" /> | ||
| - | <p style="overflow-y:auto;height:100px">A graph shows how the experimental concentration | + | <p style="overflow-y:auto;height:100px">A graph shows how the experimental concentration changed with time goes by, and then comparing the theoretical curve with the curve gotten from experiment |
</p> | </p> | ||
<a href="https://2013.igem.org/Team:UESTC_Life/Modeling#First_Model" class="demo">More</a> | <a href="https://2013.igem.org/Team:UESTC_Life/Modeling#First_Model" class="demo">More</a> | ||
Revision as of 15:15, 27 September 2013


![[home]](https://static.igem.org/mediawiki/igem.org/3/31/Uestclifehome.png)
![[project]](https://static.igem.org/mediawiki/2013/9/9a/Uestclifeproject.png)
![[Result and Discution]](https://static.igem.org/mediawiki/2013/5/50/Uestcliferesult.png)
![[Modeling]](https://static.igem.org/mediawiki/2013/2/21/Uestclifemodeling.png)
![[team]](https://static.igem.org/mediawiki/2013/c/c1/Uestclifeteam.png)
![[Attribution and Contribution]](https://static.igem.org/mediawiki/2013/a/a2/Uestclifeac.png)
![[Human Pratice]](https://static.igem.org/mediawiki/2013/1/1a/Stclifehuman.png)
![[protocol]](https://static.igem.org/mediawiki/2013/8/8f/Uestclifeprotocol.png)
![[notebook]](https://static.igem.org/mediawiki/2013/6/63/Uestclifenotebook.png)
![[safety]](https://static.igem.org/mediawiki/2013/2/2d/Uestclifesafety.png)
Loading pages...