 "
"
Team:uOttawa/modeling
From 2013.igem.org
| (30 intermediate revisions not shown) | |||
| Line 73: | Line 73: | ||
<img id="three" src="https://static.igem.org/mediawiki/2013/f/f4/Three.png" height="75" width="75" style="top:450px; margin-left:400px; position:absolute; display:none; overflow:hidden;"></img> | <img id="three" src="https://static.igem.org/mediawiki/2013/f/f4/Three.png" height="75" width="75" style="top:450px; margin-left:400px; position:absolute; display:none; overflow:hidden;"></img> | ||
<button id="spikeY" onClick="fadeYs();drawY()" style ="top:450px; height:75px; width:350px; margin-left:480px; background-color:white; border:2px solid green; position:absolute; font-size:30px; position:absolute; cursor:pointer; display:none; overflow:hidden; " align="right"> Click to show repression by Y!</button> | <button id="spikeY" onClick="fadeYs();drawY()" style ="top:450px; height:75px; width:350px; margin-left:480px; background-color:white; border:2px solid green; position:absolute; font-size:30px; position:absolute; cursor:pointer; display:none; overflow:hidden; " align="right"> Click to show repression by Y!</button> | ||
| - | <button id="restartButton" onClick=" | + | <button id="restartButton" onClick="history.go(0)" style="top:440px; height:85px; width:300px; margin-left:200px; display:none; position:absolute; font-size:25px; background-color:white; border:2px solid blue; cursor:pointer;">Restart!</button> |
</div> | </div> | ||
| Line 92: | Line 92: | ||
<p style="margin-left:5em">Transfer rates of proteins between the cytosol and the nuclei to calculate transfer rates by size of each protein.</p> | <p style="margin-left:5em">Transfer rates of proteins between the cytosol and the nuclei to calculate transfer rates by size of each protein.</p> | ||
<br> | <br> | ||
| - | <p>The | + | <h2>Acknowledgements</h2> |
| + | <p>The differential equations model for the system and implementation in MATLAB were done by <a href="https://2013.igem.org/Team:Waterloo#/Team/MathModelling">Paul Reginato</a> from the University of Waterloo iGEM team. This was only possible as a result of the great collaboration between the University of Waterloo iGEM team and the uOttawa iGEM teams <a href="https://2013.igem.org/Team:Waterloo#/Lab/Ottawa">learn more</a>. Parameterization and analysis of the model to show pulse and fold change detection were done by Nicolas Tremblay from the University of Ottawa iGEM team with extensive guidance of <a href="http://www.linkedin.com/profile/view?id=192529967&authType=NAME_SEARCH&authToken=ONu-&locale=en_US&srchid=2830032911382628929808&srchindex=18&srchtotal=19&trk=vsrp_people_res_name&trkInfo=VSRPsearchId%3A2830032911382628929808%2CVSRPtargetId%3A192529967%2CVSRPcmpt%3Aprimary"> Daniel Charlebois</a> advisor for the uOttawa iGEM team. | ||
<br> | <br> | ||
| + | <h2>Equations</h2> | ||
| + | <p>The four rate equations for the production of mRNA over time of GEV (1.1), X (rtTA) (2.1), Y (LacI) (3.1) and Z (sfGFP) (4.1) in the nucleus are shown below. </p> | ||
<br> | <br> | ||
| - | + | <div style="padding-right:5%;padding-left:5%;margin-left:auto; margin-right:auto;"><img src="https://static.igem.org/mediawiki/2013/0/0e/Set1.png"></img></div> | |
| - | + | ||
| - | + | ||
| - | + | ||
| - | + | ||
| - | <div style="padding-right:5%;padding-left:5%;margin-left:auto; margin-right:auto;"><img src="https://static.igem.org/mediawiki/2013/0/ | + | |
<button onmousedown="slidedown('legendmRNA')"onclick="slideup('legendmRNA')" style="font-size:18px; font-family:Helvetica; maging-left:auto; margin-right:auto; width:auto; cursor:pointer;" align="left">Click for legend</button> | <button onmousedown="slidedown('legendmRNA')"onclick="slideup('legendmRNA')" style="font-size:18px; font-family:Helvetica; maging-left:auto; margin-right:auto; width:auto; cursor:pointer;" align="left">Click for legend</button> | ||
| Line 111: | Line 109: | ||
<li type="disc"><b>MRP7</b> is the constitutive transcription rate that does not change. Replicates the role of a toxin in the system.</li> | <li type="disc"><b>MRP7</b> is the constitutive transcription rate that does not change. Replicates the role of a toxin in the system.</li> | ||
<li type="disc"><b>Trs<sub>GEV mRNA</sub></b> is the ratio of the amount of GEV mRNA that will be transfered to the cytosol to be translated into protein. This value is set to 1.</li> | <li type="disc"><b>Trs<sub>GEV mRNA</sub></b> is the ratio of the amount of GEV mRNA that will be transfered to the cytosol to be translated into protein. This value is set to 1.</li> | ||
| - | |||
</ol> | </ol> | ||
2.1 Variation of rtTA mRNA according to time. | 2.1 Variation of rtTA mRNA according to time. | ||
| Line 130: | Line 127: | ||
<ol> | <ol> | ||
<li type="disc"><b>psfGFP</b> is the fully induced transcription rate of this mRNA lenght.</li> | <li type="disc"><b>psfGFP</b> is the fully induced transcription rate of this mRNA lenght.</li> | ||
| - | <li type="disc"><b>K<sub> | + | <li type="disc"><b>K<sub>rtTA</sub></b> is the affinity of the rtTA bound to the psfGFP promoter</li> |
| - | <li type="disc"><b> | + | <li type="disc"><b>rtTA<sub>Bound</sub></b> is the Amount of activated rtTA by ATc</li> |
<li type="disc"><b>n</b> is the cooperativity of the molecule to the promoter</li> | <li type="disc"><b>n</b> is the cooperativity of the molecule to the promoter</li> | ||
<li type="disc"><b>LacI<sub>free</sub></b> is the amount of LacI available to repress the activation sfGFP</li> | <li type="disc"><b>LacI<sub>free</sub></b> is the amount of LacI available to repress the activation sfGFP</li> | ||
| Line 148: | Line 145: | ||
| - | <div style="padding-right:5%;padding-left:5%;margin-left:auto; margin-right:auto;"><img src="https://static.igem.org/mediawiki/2013/ | + | <div style="padding-right:5%;padding-left:5%;margin-left:auto; margin-right:auto;"><img src="https://static.igem.org/mediawiki/2013/0/0a/Set2.png"></img></div> |
<br> | <br> | ||
<button onmousedown="slidedown('legendmRNA2')"onclick="slideup('legendmRNA2')" style="font-size:18px; font-family:Helvetica; maging-left:auto; margin-right:auto; width:auto;" align="left">Click for legend</button> | <button onmousedown="slidedown('legendmRNA2')"onclick="slideup('legendmRNA2')" style="font-size:18px; font-family:Helvetica; maging-left:auto; margin-right:auto; width:auto;" align="left">Click for legend</button> | ||
| Line 154: | Line 151: | ||
<br> | <br> | ||
<div id="legendmRNA2" style="height:300px;overflow:auto;width:auto;position:relative;display:none;margin-left:50px;font-size:12px;"> | <div id="legendmRNA2" style="height:300px;overflow:auto;width:auto;position:relative;display:none;margin-left:50px;font-size:12px;"> | ||
| - | + | 2.1 Variation of GEV mRNA according to time. | |
<ol> | <ol> | ||
<li type="disc"><b>Trs<sub>GEV mRNA</sub></b> is the ratio of the amount of GEV mRNA that was transfered to the cytosol. This value is set to 1.</li> | <li type="disc"><b>Trs<sub>GEV mRNA</sub></b> is the ratio of the amount of GEV mRNA that was transfered to the cytosol. This value is set to 1.</li> | ||
<li type="disc"><b>GEV<sub>mRNA</sub></b> is the amount of mRNA transcribed in the nucleus.</li> | <li type="disc"><b>GEV<sub>mRNA</sub></b> is the amount of mRNA transcribed in the nucleus.</li> | ||
<li type="disc"><b>Deg<sub>GEV mRNA</sub></b> the average degradation rate of an mRNA molecule in a cell.</li> | <li type="disc"><b>Deg<sub>GEV mRNA</sub></b> the average degradation rate of an mRNA molecule in a cell.</li> | ||
| - | |||
<li type="disc"><b>Cyt<sub>GEV mRNA</sub></b> amount of GEV mRNA in the cytosol.</li> | <li type="disc"><b>Cyt<sub>GEV mRNA</sub></b> amount of GEV mRNA in the cytosol.</li> | ||
</ol> | </ol> | ||
| Line 188: | Line 184: | ||
<p>Computing the variation and amounts of mRNA in the cytosol over time then allowed us to compute the variation of protein translated. The equations of translation shown below in equations 1.3, 2.3, 3.3, 4.3 represent the variation of protein in the cytosol over time. The translational rates were calculated based on the average translation rate of a ribosome (9.5 base pair per second <sup>12</sup>). Here, we assume that the quantity of ribosome is not a limiting factor and that there are no translational regulations involved in the model. The degradation rates are taken from the average degradation rate of protein in yeast<sup>14</sup>.</p> | <p>Computing the variation and amounts of mRNA in the cytosol over time then allowed us to compute the variation of protein translated. The equations of translation shown below in equations 1.3, 2.3, 3.3, 4.3 represent the variation of protein in the cytosol over time. The translational rates were calculated based on the average translation rate of a ribosome (9.5 base pair per second <sup>12</sup>). Here, we assume that the quantity of ribosome is not a limiting factor and that there are no translational regulations involved in the model. The degradation rates are taken from the average degradation rate of protein in yeast<sup>14</sup>.</p> | ||
| - | <div style="padding-right:10%; padding-left:10%;margin-left:auto; margin-right:auto;"><img src="https://static.igem.org/mediawiki/2013/ | + | <br> |
| - | + | <div style="padding-right:10%; padding-left:10%;margin-left:auto; margin-right:auto;"><img src="https://static.igem.org/mediawiki/2013/3/34/Set3.png"></img></div> | |
| + | <br> | ||
<button onmousedown="slidedown('legendProtein')"onclick="slideup('legendProtein')" style="font-size:18px; font-family:Helvetica; maging-left:auto; margin-right:auto; width:auto; cursor:pointer;" align="left">Click for legend</button> | <button onmousedown="slidedown('legendProtein')"onclick="slideup('legendProtein')" style="font-size:18px; font-family:Helvetica; maging-left:auto; margin-right:auto; width:auto; cursor:pointer;" align="left">Click for legend</button> | ||
<br> | <br> | ||
| Line 207: | Line 204: | ||
<li type="disc"><b>Transf</b> transfer rate of the protein from the cytosol back into the nuclues. Extrapolated from known data and varies based on protein size. Equation 4.4 does not have this component because sfGFP only needs to be observed and does not have an effect on transcription of other genes.</li> | <li type="disc"><b>Transf</b> transfer rate of the protein from the cytosol back into the nuclues. Extrapolated from known data and varies based on protein size. Equation 4.4 does not have this component because sfGFP only needs to be observed and does not have an effect on transcription of other genes.</li> | ||
<li type="disc"><b>deg<sub>protein</sub></b> the average rate of degradation of protein. 3.5 molecules/hour in the cell.</li> | <li type="disc"><b>deg<sub>protein</sub></b> the average rate of degradation of protein. 3.5 molecules/hour in the cell.</li> | ||
| - | |||
<li type="disc">The amounts of protein are represented by their name<sub>Cyt</sub></li> | <li type="disc">The amounts of protein are represented by their name<sub>Cyt</sub></li> | ||
</ol> | </ol> | ||
| Line 216: | Line 212: | ||
| - | <p>Once the | + | <p>Once the amount of protein calculated, we assumed that they would diffuse at an average rate through the nuclear pore to then affect the transcription of the other genes in the system. The calculations leading to the transfer rates are described in the parameter section under transf. Equations 1.4, 2.4 and 3.4 represent the variation of proteins present in the nucleus over time.</p> |
<br> | <br> | ||
| - | <div style="padding-right:10%; padding-left:10%;margin-left:auto; margin-right:auto;"><img src="https://static.igem.org/mediawiki/2013/ | + | <div style="padding-right:10%; padding-left:10%;margin-left:auto; margin-right:auto;"><img src="https://static.igem.org/mediawiki/2013/7/78/Set4.png"></img></div> |
<br> | <br> | ||
<button onmousedown="slidedown('legendProteinN')"onclick="slideup('legendProteinN')" style="font-size:18px; font-family:Helvetica; maging-left:auto; margin-right:auto; width:auto; cursor:pointer;" align="left">Click for legend</button> | <button onmousedown="slidedown('legendProteinN')"onclick="slideup('legendProteinN')" style="font-size:18px; font-family:Helvetica; maging-left:auto; margin-right:auto; width:auto; cursor:pointer;" align="left">Click for legend</button> | ||
| Line 233: | Line 229: | ||
3.4 .Variation of sfGFP in the nucleus over time. | 3.4 .Variation of sfGFP in the nucleus over time. | ||
<br> | <br> | ||
| - | <b>Legend for | + | <b>Legend for variables that apply for all 4 equations</b> |
<ol> | <ol> | ||
<li type="disc"><b>Transf</b> transfer rate of the protein from the cytosol back into the nuclues. Extrapolated from known data and varies based on protein size.</li> | <li type="disc"><b>Transf</b> transfer rate of the protein from the cytosol back into the nuclues. Extrapolated from known data and varies based on protein size.</li> | ||
<li type="disc">The amounts of protein are represented by their name<sub>Cyt</sub></li> | <li type="disc">The amounts of protein are represented by their name<sub>Cyt</sub></li> | ||
<li type="disc"><b>deg<sub>protein</sub></b> the average rate of degradation of protein. 3.5 molecules/hour in the cell<sup>14</sup>.</li> | <li type="disc"><b>deg<sub>protein</sub></b> the average rate of degradation of protein. 3.5 molecules/hour in the cell<sup>14</sup>.</li> | ||
| - | |||
<li type="disc">The amounts of protein in the nuclues are represented by their name<sub>Nuc</sub></li> | <li type="disc">The amounts of protein in the nuclues are represented by their name<sub>Nuc</sub></li> | ||
| Line 251: | Line 246: | ||
<p>To have better control on the feed-forward loop system, LacI was regulated with IPTG. Changing the amount of ATC regulated the amount of active rtTA. And the Amount of GEV available to activate production of rtTA is controlled with ß-estradiol. The following equations used to compute the amount of each compound are shown below. These numbers are imputed in the mRNA equations and vary accordingly with the amount of each transcription factors expressed in the ODE system.</p> | <p>To have better control on the feed-forward loop system, LacI was regulated with IPTG. Changing the amount of ATC regulated the amount of active rtTA. And the Amount of GEV available to activate production of rtTA is controlled with ß-estradiol. The following equations used to compute the amount of each compound are shown below. These numbers are imputed in the mRNA equations and vary accordingly with the amount of each transcription factors expressed in the ODE system.</p> | ||
| - | <div style="padding-left:5%; padding-right:5%; margin-left:auto; margin-right:auto;"><img src="https://static.igem.org/mediawiki/2013/6/6f/ControlEquations.png"></img></div | + | <div style="text-align: center; padding-left:5%; padding-right:5%; margin-left:auto; margin-right:auto;"><img src="https://static.igem.org/mediawiki/2013/6/6f/ControlEquations.png" width="450px"></img></div |
<br> | <br> | ||
| Line 271: | Line 266: | ||
<p>Some parameters were found in the literature. Others were derived from other known constants as explained below.</p> | <p>Some parameters were found in the literature. Others were derived from other known constants as explained below.</p> | ||
<p><b>Transcription rate</b><p> | <p><b>Transcription rate</b><p> | ||
| - | <p>The transcription rate was calculated using the known rate of 2kb per | + | <p>The transcription rate was calculated using the known rate of 2kb per minute<sup>6</sup> which translates to 33.3 nucleotides per second. This rate was then divided by the amount of nucleotides in one mRNA strand. The values are in the parameter table.</p> |
<p><b>Translation rate</b><p> | <p><b>Translation rate</b><p> | ||
<p>The translation rate was calculated using the known rate of 9.5 amino acid per second<sup>12</sup>. This rate was then divided by the amount of amino acids per protein. The values are in the parameter table.</p> | <p>The translation rate was calculated using the known rate of 9.5 amino acid per second<sup>12</sup>. This rate was then divided by the amount of amino acids per protein. The values are in the parameter table.</p> | ||
<p><b>Transfer rate of protein from the cytosol to the nucleus</b><p> | <p><b>Transfer rate of protein from the cytosol to the nucleus</b><p> | ||
| - | <p>The rate of transfer from the cytosol to the nucleus was extrapolated from the formula rate = 0.01*(5000-size of protein in Dalton)-50. This is the multiplied by 119 or the average number of nuclear pores in yeast<sup>7</sup>. The first equation was determined by assuming that transfer rate of protein 5000 Da takes 0 seconds and a 17000 Da protein takes 120 seconds<sup>11</sup>.</p> | + | <p>The rate of transfer from the cytosol to the nucleus was extrapolated from the formula rate = 0.01*(5000-size of protein in Dalton)-50. This is the multiplied by 119 or the average number of nuclear pores in yeast<sup>7</sup>. The first equation was determined by assuming that transfer rate of protein 5000 Da takes 0 seconds (its size being insignificant ) and a 17000 Da protein takes 120 seconds <sup><a href="http://www.ncbi.nlm.nih.gov/books/NBK26932/">11</a></sup>.</p> |
<br> | <br> | ||
<br> | <br> | ||
| Line 345: | Line 340: | ||
solid windowtext .5pt;mso-border-right-alt:solid windowtext .5pt;padding: | solid windowtext .5pt;mso-border-right-alt:solid windowtext .5pt;padding: | ||
0cm 5.4pt 0cm 5.4pt'> | 0cm 5.4pt 0cm 5.4pt'> | ||
| - | <p class=MsoNormal><span lang=EN-US>Translation rates ( | + | <p class=MsoNormal><span lang=EN-US>Translation rates (protein/min)</span></p> |
</td> | </td> | ||
<td width=85 style='width:3.0cm;border-top:none;border-left:none;border-bottom: | <td width=85 style='width:3.0cm;border-top:none;border-left:none;border-bottom: | ||
| Line 351: | Line 346: | ||
solid windowtext .5pt;mso-border-left-alt:solid windowtext .5pt;mso-border-alt: | solid windowtext .5pt;mso-border-left-alt:solid windowtext .5pt;mso-border-alt: | ||
solid windowtext .5pt;padding:0cm 5.4pt 0cm 5.4pt'> | solid windowtext .5pt;padding:0cm 5.4pt 0cm 5.4pt'> | ||
| - | <p class=MsoNormal align=center style='text-align:center'><span lang=EN-US> | + | <p class=MsoNormal align=center style='text-align:center'><span lang=EN-US>1.25</span></p> |
</td> | </td> | ||
<td width=85 style='width:3.0cm;border-top:none;border-left:none;border-bottom: | <td width=85 style='width:3.0cm;border-top:none;border-left:none;border-bottom: | ||
| Line 357: | Line 352: | ||
solid windowtext .5pt;mso-border-left-alt:solid windowtext .5pt;mso-border-alt: | solid windowtext .5pt;mso-border-left-alt:solid windowtext .5pt;mso-border-alt: | ||
solid windowtext .5pt;padding:0cm 5.4pt 0cm 5.4pt'> | solid windowtext .5pt;padding:0cm 5.4pt 0cm 5.4pt'> | ||
| - | <p class=MsoNormal align=center style='text-align:center'><span lang=EN-US>0. | + | <p class=MsoNormal align=center style='text-align:center'><span lang=EN-US>0.901</span></p> |
</td> | </td> | ||
<td width=85 style='width:3.0cm;border-top:none;border-left:none;border-bottom: | <td width=85 style='width:3.0cm;border-top:none;border-left:none;border-bottom: | ||
| Line 363: | Line 358: | ||
solid windowtext .5pt;mso-border-left-alt:solid windowtext .5pt;mso-border-alt: | solid windowtext .5pt;mso-border-left-alt:solid windowtext .5pt;mso-border-alt: | ||
solid windowtext .5pt;padding:0cm 5.4pt 0cm 5.4pt'> | solid windowtext .5pt;padding:0cm 5.4pt 0cm 5.4pt'> | ||
| - | <p class=MsoNormal align=center style='text-align:center'><span lang=EN-US>0. | + | <p class=MsoNormal align=center style='text-align:center'><span lang=EN-US>0.959</span></p> |
</td> | </td> | ||
<td width=85 style='width:3.0cm;border-top:none;border-left:none;border-bottom: | <td width=85 style='width:3.0cm;border-top:none;border-left:none;border-bottom: | ||
| Line 369: | Line 364: | ||
solid windowtext .5pt;mso-border-left-alt:solid windowtext .5pt;mso-border-alt: | solid windowtext .5pt;mso-border-left-alt:solid windowtext .5pt;mso-border-alt: | ||
solid windowtext .5pt;padding:0cm 5.4pt 0cm 5.4pt'> | solid windowtext .5pt;padding:0cm 5.4pt 0cm 5.4pt'> | ||
| - | <p class=MsoNormal align=center style='text-align:center'><span lang=EN-US> | + | <p class=MsoNormal align=center style='text-align:center'><span lang=EN-US>2.395</span></p> |
</td> | </td> | ||
<td width=85 style='width:3.0cm;border-top:none;border-left:none;border-bottom: | <td width=85 style='width:3.0cm;border-top:none;border-left:none;border-bottom: | ||
| Line 454: | Line 449: | ||
solid windowtext .5pt;mso-border-left-alt:solid windowtext .5pt;mso-border-alt: | solid windowtext .5pt;mso-border-left-alt:solid windowtext .5pt;mso-border-alt: | ||
solid windowtext .5pt;padding:0cm 5.4pt 0cm 5.4pt'> | solid windowtext .5pt;padding:0cm 5.4pt 0cm 5.4pt'> | ||
| - | <p class=MsoNormal align=center style='text-align:center'><span lang=EN-US>10^-6<sup>13</sup></span></p> | + | <p class=MsoNormal align=center style='text-align:center'><span lang=EN-US>10^-6 <sup> <a href"http://www.pnas.org/content/early/2009/03/10/0809901106>13</a></sup></span></p> |
</td> | </td> | ||
<td width=85 style='width:3.0cm;border-top:none;border-left:none;border-bottom: | <td width=85 style='width:3.0cm;border-top:none;border-left:none;border-bottom: | ||
| Line 460: | Line 455: | ||
solid windowtext .5pt;mso-border-left-alt:solid windowtext .5pt;mso-border-alt: | solid windowtext .5pt;mso-border-left-alt:solid windowtext .5pt;mso-border-alt: | ||
solid windowtext .5pt;padding:0cm 5.4pt 0cm 5.4pt'> | solid windowtext .5pt;padding:0cm 5.4pt 0cm 5.4pt'> | ||
| - | <p class=MsoNormal align=center style='text-align:center'><span lang=EN-US> | + | <p class=MsoNormal align=center style='text-align:center'><span lang=EN-US>10^-6 <sup> <a href="http://www.pnas.org/content/early/2009/03/10/0809901106">13</a></sup></span></p> |
</td> | </td> | ||
<td width=85 style='width:3.0cm;border-top:none;border-left:none;border-bottom: | <td width=85 style='width:3.0cm;border-top:none;border-left:none;border-bottom: | ||
| Line 466: | Line 461: | ||
solid windowtext .5pt;mso-border-left-alt:solid windowtext .5pt;mso-border-alt: | solid windowtext .5pt;mso-border-left-alt:solid windowtext .5pt;mso-border-alt: | ||
solid windowtext .5pt;padding:0cm 5.4pt 0cm 5.4pt'> | solid windowtext .5pt;padding:0cm 5.4pt 0cm 5.4pt'> | ||
| - | <p class=MsoNormal align=center style='text-align:center'><span lang=EN-US>10^-10 <sup>1</sup></span></p> | + | <p class=MsoNormal align=center style='text-align:center'><span lang=EN-US>10^-10 <sup><a href="http://www.weizmann.ac.il/mcb/UriAlon/Papers/Kalisky-cost-benefit.pdf">1</a></sup></span></p> |
</td> | </td> | ||
<td width=85 style='width:3.0cm;border-top:none;border-left:none;border-bottom: | <td width=85 style='width:3.0cm;border-top:none;border-left:none;border-bottom: | ||
| Line 478: | Line 473: | ||
solid windowtext .5pt;mso-border-left-alt:solid windowtext .5pt;mso-border-alt: | solid windowtext .5pt;mso-border-left-alt:solid windowtext .5pt;mso-border-alt: | ||
solid windowtext .5pt;padding:0cm 5.4pt 0cm 5.4pt'> | solid windowtext .5pt;padding:0cm 5.4pt 0cm 5.4pt'> | ||
| - | <p class=MsoNormal align=center style='text-align:center'><span lang=EN-US> | + | <p class=MsoNormal align=center style='text-align:center'><span lang=EN-US>6.0*10^-6 <sup> <a href="http://pubs.acs.org/doi/abs/10.1021/jp308930c?journalCode=jpcbfk">3</a></sup></span></p> |
</td> | </td> | ||
<td width=85 style='width:3.0cm;border-top:none;border-left:none;border-bottom: | <td width=85 style='width:3.0cm;border-top:none;border-left:none;border-bottom: | ||
| Line 484: | Line 479: | ||
solid windowtext .5pt;mso-border-left-alt:solid windowtext .5pt;mso-border-alt: | solid windowtext .5pt;mso-border-left-alt:solid windowtext .5pt;mso-border-alt: | ||
solid windowtext .5pt;padding:0cm 5.4pt 0cm 5.4pt'> | solid windowtext .5pt;padding:0cm 5.4pt 0cm 5.4pt'> | ||
| - | <p class=MsoNormal align=center style='text-align:center'><span lang=EN-US>10^-9<sup>4</sup></span></p> | + | <p class=MsoNormal align=center style='text-align:center'><span lang=EN-US>10^-9<sup><a href="http://www.rcsb.org/pdb/explore/explore.do?structureId=1ORK">4</a></sup></span></p> |
</td> | </td> | ||
<td width=85 style='width:3.0cm;border:none;border-bottom:solid windowtext 1.0pt; | <td width=85 style='width:3.0cm;border:none;border-bottom:solid windowtext 1.0pt; | ||
| Line 490: | Line 485: | ||
mso-border-top-alt:solid windowtext .5pt;mso-border-left-alt:solid windowtext .5pt; | mso-border-top-alt:solid windowtext .5pt;mso-border-left-alt:solid windowtext .5pt; | ||
mso-border-bottom-alt:solid windowtext .5pt;padding:0cm 5.4pt 0cm 5.4pt'> | mso-border-bottom-alt:solid windowtext .5pt;padding:0cm 5.4pt 0cm 5.4pt'> | ||
| - | <p class=MsoNormal align=center style='text-align:center'><span lang=EN-US>1.56*10^-9<sup>13</sup></span></p> | + | <p class=MsoNormal align=center style='text-align:center'><span lang=EN-US>1.56*10^-9<sup><a href="http://www.pnas.org/content/early/2009/03/10/0809901106">13</a></sup></span></p> |
</td> | </td> | ||
</tr> | </tr> | ||
| Line 499: | Line 494: | ||
solid windowtext .5pt;mso-border-right-alt:solid windowtext .5pt;padding: | solid windowtext .5pt;mso-border-right-alt:solid windowtext .5pt;padding: | ||
0cm 5.4pt 0cm 5.4pt'> | 0cm 5.4pt 0cm 5.4pt'> | ||
| - | <p class=MsoNormal><span class=SpellE><span lang=EN-US> | + | <p class=MsoNormal><span class=SpellE><span lang=EN-US>Transcription rate (mRNA/min)</span></span><span |
| - | lang=EN-US> | + | lang=EN-US></span></p> |
</td> | </td> | ||
<td width=85 style='width:3.0cm;border-top:none;border-left:none;border-bottom: | <td width=85 style='width:3.0cm;border-top:none;border-left:none;border-bottom: | ||
| Line 506: | Line 501: | ||
solid windowtext .5pt;mso-border-left-alt:solid windowtext .5pt;mso-border-alt: | solid windowtext .5pt;mso-border-left-alt:solid windowtext .5pt;mso-border-alt: | ||
solid windowtext .5pt;padding:0cm 5.4pt 0cm 5.4pt'> | solid windowtext .5pt;padding:0cm 5.4pt 0cm 5.4pt'> | ||
| - | <p class=MsoNormal align=center style='text-align:center'><span lang=EN-US> | + | <p class=MsoNormal align=center style='text-align:center'><span lang=EN-US>1.465</span></p> |
</td> | </td> | ||
<td width=85 style='width:3.0cm;border-top:none;border-left:none;border-bottom: | <td width=85 style='width:3.0cm;border-top:none;border-left:none;border-bottom: | ||
| Line 512: | Line 507: | ||
solid windowtext .5pt;mso-border-left-alt:solid windowtext .5pt;mso-border-alt: | solid windowtext .5pt;mso-border-left-alt:solid windowtext .5pt;mso-border-alt: | ||
solid windowtext .5pt;padding:0cm 5.4pt 0cm 5.4pt'> | solid windowtext .5pt;padding:0cm 5.4pt 0cm 5.4pt'> | ||
| - | <p class=MsoNormal align=center style='text-align:center'><span lang=EN-US> | + | <p class=MsoNormal align=center style='text-align:center'><span lang=EN-US>1.055</span></p> |
</td> | </td> | ||
<td width=85 style='width:3.0cm;border-top:none;border-left:none;border-bottom: | <td width=85 style='width:3.0cm;border-top:none;border-left:none;border-bottom: | ||
| Line 518: | Line 513: | ||
solid windowtext .5pt;mso-border-left-alt:solid windowtext .5pt;mso-border-alt: | solid windowtext .5pt;mso-border-left-alt:solid windowtext .5pt;mso-border-alt: | ||
solid windowtext .5pt;padding:0cm 5.4pt 0cm 5.4pt'> | solid windowtext .5pt;padding:0cm 5.4pt 0cm 5.4pt'> | ||
| - | <p class=MsoNormal align=center style='text-align:center'><span lang=EN-US> | + | <p class=MsoNormal align=center style='text-align:center'><span lang=EN-US>1.122</span></p> |
</td> | </td> | ||
<td width=85 style='width:3.0cm;border-top:none;border-left:none;border-bottom: | <td width=85 style='width:3.0cm;border-top:none;border-left:none;border-bottom: | ||
| Line 524: | Line 519: | ||
solid windowtext .5pt;mso-border-left-alt:solid windowtext .5pt;mso-border-alt: | solid windowtext .5pt;mso-border-left-alt:solid windowtext .5pt;mso-border-alt: | ||
solid windowtext .5pt;padding:0cm 5.4pt 0cm 5.4pt'> | solid windowtext .5pt;padding:0cm 5.4pt 0cm 5.4pt'> | ||
| - | <p class=MsoNormal align=center style='text-align:center'><span lang=EN-US> | + | <p class=MsoNormal align=center style='text-align:center'><span lang=EN-US>2.801</span></p> |
</td> | </td> | ||
<td width=85 style='width:3.0cm;border-top:none;border-left:none;border-bottom: | <td width=85 style='width:3.0cm;border-top:none;border-left:none;border-bottom: | ||
| Line 557: | Line 552: | ||
solid windowtext .5pt;mso-border-left-alt:solid windowtext .5pt;mso-border-alt: | solid windowtext .5pt;mso-border-left-alt:solid windowtext .5pt;mso-border-alt: | ||
solid windowtext .5pt;padding:0cm 5.4pt 0cm 5.4pt'> | solid windowtext .5pt;padding:0cm 5.4pt 0cm 5.4pt'> | ||
| - | <p class=MsoNormal align=center style='text-align:center'><span lang=EN-US>0. | + | <p class=MsoNormal align=center style='text-align:center'><span lang=EN-US>0.00249</span></p> |
</td> | </td> | ||
<td width=85 style='width:3.0cm;border-top:none;border-left:none;border-bottom: | <td width=85 style='width:3.0cm;border-top:none;border-left:none;border-bottom: | ||
| Line 563: | Line 558: | ||
solid windowtext .5pt;mso-border-left-alt:solid windowtext .5pt;mso-border-alt: | solid windowtext .5pt;mso-border-left-alt:solid windowtext .5pt;mso-border-alt: | ||
solid windowtext .5pt;padding:0cm 5.4pt 0cm 5.4pt'> | solid windowtext .5pt;padding:0cm 5.4pt 0cm 5.4pt'> | ||
| - | <p class=MsoNormal align=center style='text-align:center'><span lang=EN-US>0. | + | <p class=MsoNormal align=center style='text-align:center'><span lang=EN-US>0.00168</span></p> |
</td> | </td> | ||
<td width=85 style='width:3.0cm;border-top:none;border-left:none;border-bottom: | <td width=85 style='width:3.0cm;border-top:none;border-left:none;border-bottom: | ||
| Line 569: | Line 564: | ||
solid windowtext .5pt;mso-border-left-alt:solid windowtext .5pt;mso-border-alt: | solid windowtext .5pt;mso-border-left-alt:solid windowtext .5pt;mso-border-alt: | ||
solid windowtext .5pt;padding:0cm 5.4pt 0cm 5.4pt'> | solid windowtext .5pt;padding:0cm 5.4pt 0cm 5.4pt'> | ||
| - | <p class=MsoNormal align=center style='text-align:center'><span lang=EN-US>0. | + | <p class=MsoNormal align=center style='text-align:center'><span lang=EN-US>0.00181</span></p> |
</td> | </td> | ||
<td width=85 style='width:3.0cm;border-top:none;border-left:none;border-bottom: | <td width=85 style='width:3.0cm;border-top:none;border-left:none;border-bottom: | ||
| Line 617: | Line 612: | ||
<div class="row pane references"> | <div class="row pane references"> | ||
<h2>References</h2> | <h2>References</h2> | ||
| - | < | + | <ul class="refList"> |
| - | <li | + | <li>1. <a target="_blank" href="http://www.weizmann.ac.il/mcb/UriAlon/Papers/Kalisky-cost-benefit.pdf">Kalisky, Tomer, Erez Dekel, and Uri Alon. "Cost–benefit Theory and Optimal Design of Gene Regulation Functions." Physical Biology 4.4 (2007): 229-45. Print.</a> K of LacI to DNA.</li> |
| - | <li | + | <li>2. <a target="_blank" href="http://www.weizmann.ac.il/mcb/UriAlon/Papers/Kalisky-cost-benefit.pdf">Kalisky, Tomer, Erez Dekel, and Uri Alon. "Cost–benefit Theory and Optimal Design of Gene Regulation Functions." Physical Biology 4.4 (2007): 229-45. Print.</a> K of IPTG to LacI.</li> |
| - | <li | + | <li>3. <a target="_blank" href="http://pubs.acs.org/doi/pdf/10.1021/jp308930c">Goodson, Kathy A. "LacI-DNA-IPTG Loops: Equilibria among Conformations by SingleMolecule FRET." The Journal of Physical Chemistry 117 (2013): 4713-722. Print.</a> K of IPTG to LacI.</li> |
| - | <li | + | <li>4. <a target="_blank" href="http://www.rcsb.org/pdb/explore/explore.do?structureId=1ORK">Orth, Peter, Dirk Schnappinger, Phaik-Eng Sum, George A. Ellestad, Wolfgang Hillen, Wolfram Saenger, and Winfried Hinrichs. "Crystal Structure of the Tet Repressor in Complex with a Novel Tetracycline, 9-(N, N-dimethylglycylamido)-6-demethyl-6-deoxy-tetracycline1." Journal of Molecular Biology 285.2 (1999): 455-61. Print.</a></li> |
| - | <li | + | <li>5. <a target="_blank" href="http://www.ncbi.nlm.nih.gov/pmc/articles/PMC373162/">Herskowitz, Ira. "Life Cycle of the Budding Yeast Saccharomyces Cerevisiae." Microbiological Reviews 53.4 (1988): 536-53. Print.</a> Time division of yeast</li> |
| - | <li | + | <li>6. <a target="_blank" href="http://www.ncbi.nlm.nih.gov/pmc/articles/PMC3154325/pdf/nihms314191.pdf">Zenklusen, Daniel, Daniel R. Larson, and Robert H. Singer. "Single-RNA Counting Reveals Alternative Modes of Gene Expression in Yeast." Nature Structural & Molecular Biology 15.12 (2008): 1263-271. Print.</a> Fully induced transcription</li> |
| - | <li | + | <li>7. <a target="_blank" href="http://www.ncbi.nlm.nih.gov/pmc/articles/PMC2111421/pdf/748.pdf">Maul, G. "Quantitative Determination of Nuclear Pore Complexes in Cycling Cells with Differing DNA Content." The Journal of Cell Biology 73.3 (1977): 748-60. Print.</a> number of pores</li> |
| - | <li | + | <li>8. <a target="_blank" href="https://2009.igem.org/Team:PKU_Beijing/Modeling/ODE">"Team:PKU Beijing/Modeling/ODE." Main Page. N.p., 26 Sept. 2009. Web. 27 Sept. 2013.</a> calculation of rate</li> |
| - | <li | + | <li>9. <a target="_blank" href="http://www.ncbi.nlm.nih.gov/pmc/articles/PMC373162/">Herskowitz, Ira. "Life Cycle of the Budding Yeast Saccharomyces Cerevisiae." Microbiological Reviews 53.4 (1988): 536-53. Print.</a> Time division of yeast</li> |
| - | <li | + | <li>10. <a target="_blank"href="http://www.nature.com/nbt/journal/v30/n7/pdf/nbt.2281.pdf">Khmelinskii, Anton. "Tandem Fluorescent Protein Timers for in Vivo Analysis of Protein Dynamics." Nature Biotechnology 30.7 (2012): 708-14. Print.</a> Half life of sfGFP</li> |
| - | <li | + | <li>11. <a target="_blank" href="http://www.ncbi.nlm.nih.gov/books/NBK26932/">Alberts, Bruce. "The Transport of Molecules Between the Nucleus and the Cytosol." Molecular Biology of the Cell. 4th ed. New York: Garland Science, 2002. 669-78. Print.</a> speed of pore</li> |
| - | <li | + | <li>12. <a target="_blank" href="http://download.cell.com/pdf/PIIS0092867413006557.pdf?intermediate=true">Shah, Premal. "Rate-Limiting Steps in Yeast Protein Translation." Cell 153.7 (2013): 1589-601. Print.</a> Rate of translation</li> |
| - | <li | + | <li>13. Approximated to adapt the model</li> |
| - | <li | + | <li>14. <a target="_blank" href="http://www.pnas.org/content/early/2009/03/10/0809901106">Nevozhay, D., R. M. Adams, K. F. Murphy, K. Josic, and G. Balazsi. "Negative Autoregulation Linearizes the Dose-response and Suppresses the Heterogeneity of Gene Expression." Proceedings of the National Academy of Sciences 106.13 (2009): 5123-128. Print. </a></li> |
| - | </ | + | </ul> |
</div> | </div> | ||
Latest revision as of 14:46, 28 October 2013


Modeling the Type-I Incoherent Feedforward Loop
The Feedforward loop can be broken down into 3 main steps
1. Toxin will stimulate production of X (rtTA).
2. X (rtTA) stimulates production of both Z (sfGFP) and Y (LacI).
3. Sufficient repression from Y terminates Z (sfGFP) production.
You can take a better look at the system by clicking on the button below!


Equations involved in modeling the biological system
The mathematical model was developed using basic rate formulas of activation and repression as shown in the system of equations above. We then expanded them to include the different parameters required for our model.
These additions are as follows
IPTG concentration to calculate the amount of Y (LacI) repressing Z (sfGFP).
ATC concentration to calculate the amount of X (rtTA) available to bind Y promoter and Z promoter.
Transfer rates of proteins between the cytosol and the nuclei to calculate transfer rates by size of each protein.
Acknowledgements
The differential equations model for the system and implementation in MATLAB were done by Paul Reginato from the University of Waterloo iGEM team. This was only possible as a result of the great collaboration between the University of Waterloo iGEM team and the uOttawa iGEM teams learn more. Parameterization and analysis of the model to show pulse and fold change detection were done by Nicolas Tremblay from the University of Ottawa iGEM team with extensive guidance of Daniel Charlebois advisor for the uOttawa iGEM team.
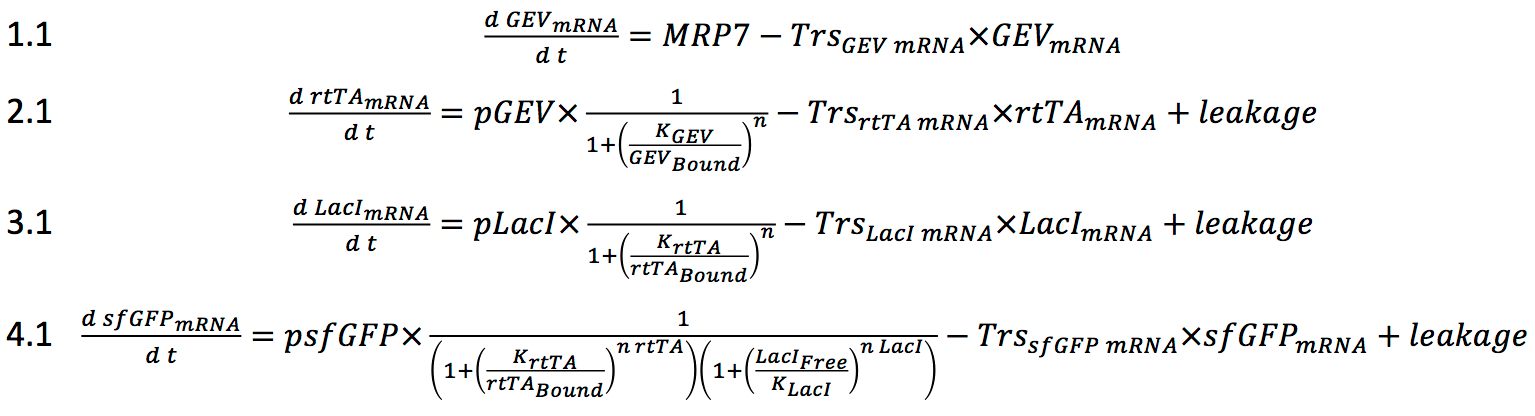
Equations
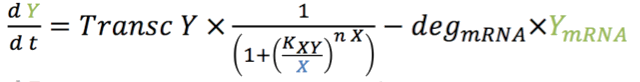
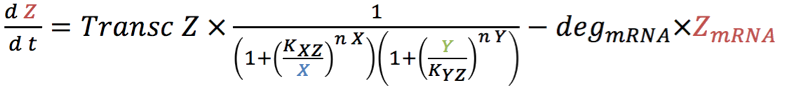
The four rate equations for the production of mRNA over time of GEV (1.1), X (rtTA) (2.1), Y (LacI) (3.1) and Z (sfGFP) (4.1) in the nucleus are shown below.
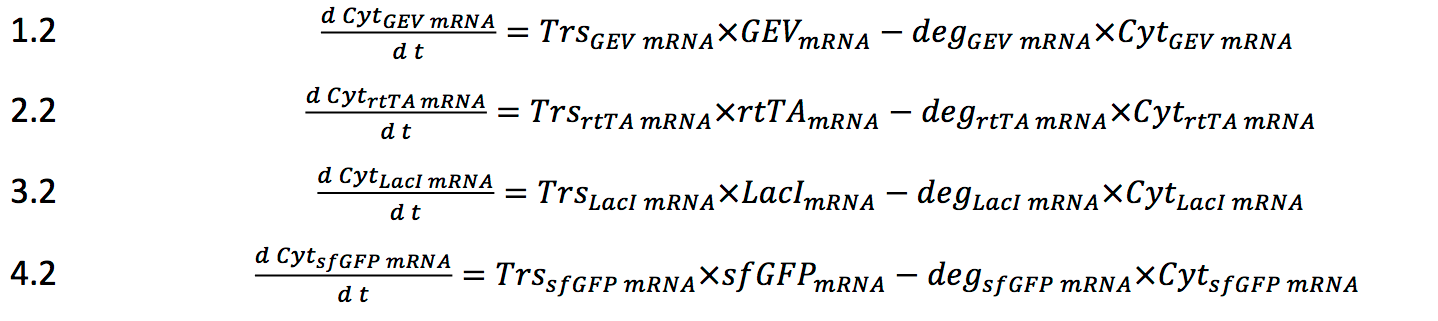
The first sets of equations were used to describe the amount of mRNA transcribed. These equations also took into consideration that the mRNA would be transported out of the nuclei. In the model, we assumed that all of the mRNA molecules would be exported to the cytosol. The differential equations representing the variation in mRNA in the cytosol are represented below in equations 1.2, 2.2, 3.2 and 4.2.
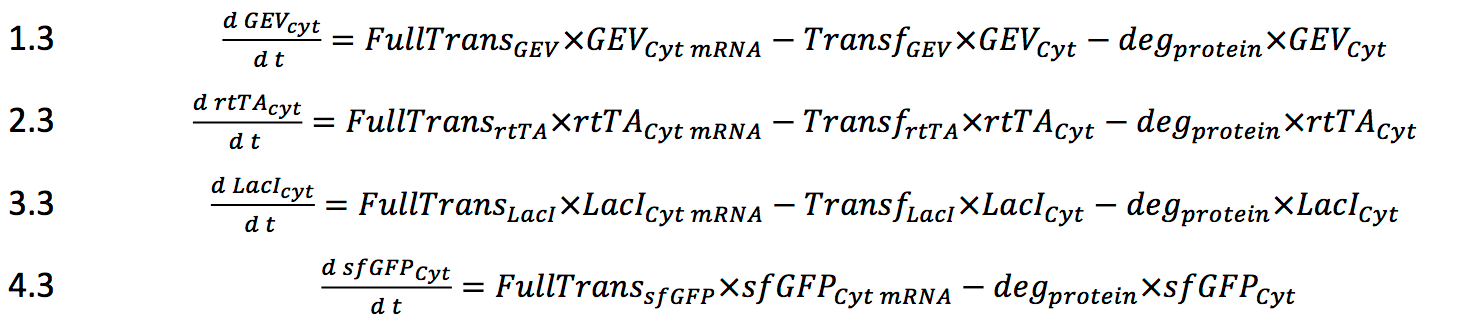
Computing the variation and amounts of mRNA in the cytosol over time then allowed us to compute the variation of protein translated. The equations of translation shown below in equations 1.3, 2.3, 3.3, 4.3 represent the variation of protein in the cytosol over time. The translational rates were calculated based on the average translation rate of a ribosome (9.5 base pair per second 12). Here, we assume that the quantity of ribosome is not a limiting factor and that there are no translational regulations involved in the model. The degradation rates are taken from the average degradation rate of protein in yeast14.
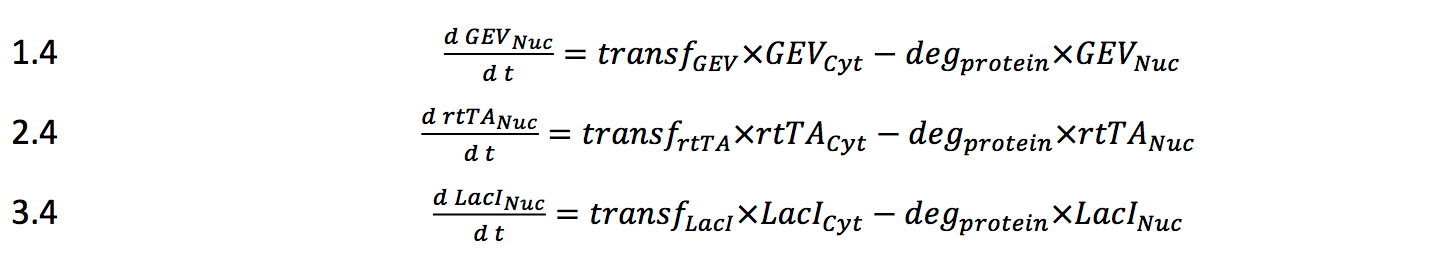
Once the amount of protein calculated, we assumed that they would diffuse at an average rate through the nuclear pore to then affect the transcription of the other genes in the system. The calculations leading to the transfer rates are described in the parameter section under transf. Equations 1.4, 2.4 and 3.4 represent the variation of proteins present in the nucleus over time.
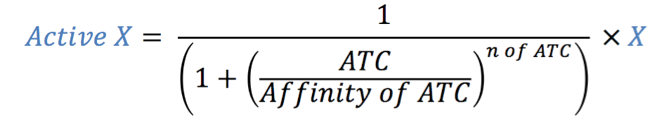
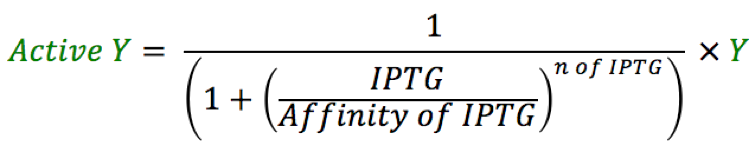
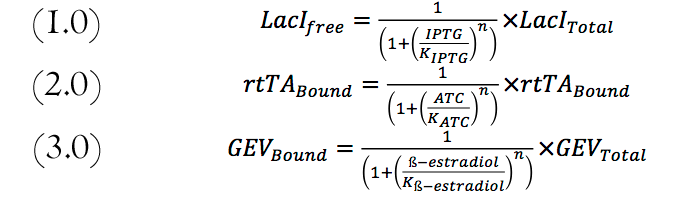
To have better control on the feed-forward loop system, LacI was regulated with IPTG. Changing the amount of ATC regulated the amount of active rtTA. And the Amount of GEV available to activate production of rtTA is controlled with ß-estradiol. The following equations used to compute the amount of each compound are shown below. These numbers are imputed in the mRNA equations and vary accordingly with the amount of each transcription factors expressed in the ODE system.
Parameters
Some parameters were found in the literature. Others were derived from other known constants as explained below.
Transcription rate
The transcription rate was calculated using the known rate of 2kb per minute6 which translates to 33.3 nucleotides per second. This rate was then divided by the amount of nucleotides in one mRNA strand. The values are in the parameter table.
Translation rate
The translation rate was calculated using the known rate of 9.5 amino acid per second12. This rate was then divided by the amount of amino acids per protein. The values are in the parameter table.
Transfer rate of protein from the cytosol to the nucleus
The rate of transfer from the cytosol to the nucleus was extrapolated from the formula rate = 0.01*(5000-size of protein in Dalton)-50. This is the multiplied by 119 or the average number of nuclear pores in yeast7. The first equation was determined by assuming that transfer rate of protein 5000 Da takes 0 seconds (its size being insignificant ) and a 17000 Da protein takes 120 seconds 11.
|
|
GEV |
rtTA |
LacI |
sfGFP |
IPTG |
ß-estradiol |
ATC |
|
Translation rates (protein/min) |
1.25 |
0.901 |
0.959 |
2.395 |
|
|
|
|
n (Hill coefficient) |
1 |
2 |
2 |
- |
2 |
1 |
1 |
|
K |
10^-6 13 |
10^-6 13 |
10^-10 1 |
- |
6.0*10^-6 3 |
10^-94 |
1.56*10^-913 |
|
Transcription rate (mRNA/min) |
1.465 |
1.055 |
1.122 |
2.801 |
|
|
|
|
Transf |
0.00249 |
0.00168 |
0.00181 |
|
|
|
|
|
Leakage |
1.5 molecule/hour for one promoter |
||||||
References
- 1. Kalisky, Tomer, Erez Dekel, and Uri Alon. "Cost–benefit Theory and Optimal Design of Gene Regulation Functions." Physical Biology 4.4 (2007): 229-45. Print. K of LacI to DNA.
- 2. Kalisky, Tomer, Erez Dekel, and Uri Alon. "Cost–benefit Theory and Optimal Design of Gene Regulation Functions." Physical Biology 4.4 (2007): 229-45. Print. K of IPTG to LacI.
- 3. Goodson, Kathy A. "LacI-DNA-IPTG Loops: Equilibria among Conformations by SingleMolecule FRET." The Journal of Physical Chemistry 117 (2013): 4713-722. Print. K of IPTG to LacI.
- 4. Orth, Peter, Dirk Schnappinger, Phaik-Eng Sum, George A. Ellestad, Wolfgang Hillen, Wolfram Saenger, and Winfried Hinrichs. "Crystal Structure of the Tet Repressor in Complex with a Novel Tetracycline, 9-(N, N-dimethylglycylamido)-6-demethyl-6-deoxy-tetracycline1." Journal of Molecular Biology 285.2 (1999): 455-61. Print.
- 5. Herskowitz, Ira. "Life Cycle of the Budding Yeast Saccharomyces Cerevisiae." Microbiological Reviews 53.4 (1988): 536-53. Print. Time division of yeast
- 6. Zenklusen, Daniel, Daniel R. Larson, and Robert H. Singer. "Single-RNA Counting Reveals Alternative Modes of Gene Expression in Yeast." Nature Structural & Molecular Biology 15.12 (2008): 1263-271. Print. Fully induced transcription
- 7. Maul, G. "Quantitative Determination of Nuclear Pore Complexes in Cycling Cells with Differing DNA Content." The Journal of Cell Biology 73.3 (1977): 748-60. Print. number of pores
- 8. "Team:PKU Beijing/Modeling/ODE." Main Page. N.p., 26 Sept. 2009. Web. 27 Sept. 2013. calculation of rate
- 9. Herskowitz, Ira. "Life Cycle of the Budding Yeast Saccharomyces Cerevisiae." Microbiological Reviews 53.4 (1988): 536-53. Print. Time division of yeast
- 10. Khmelinskii, Anton. "Tandem Fluorescent Protein Timers for in Vivo Analysis of Protein Dynamics." Nature Biotechnology 30.7 (2012): 708-14. Print. Half life of sfGFP
- 11. Alberts, Bruce. "The Transport of Molecules Between the Nucleus and the Cytosol." Molecular Biology of the Cell. 4th ed. New York: Garland Science, 2002. 669-78. Print. speed of pore
- 12. Shah, Premal. "Rate-Limiting Steps in Yeast Protein Translation." Cell 153.7 (2013): 1589-601. Print. Rate of translation
- 13. Approximated to adapt the model
- 14. Nevozhay, D., R. M. Adams, K. F. Murphy, K. Josic, and G. Balazsi. "Negative Autoregulation Linearizes the Dose-response and Suppresses the Heterogeneity of Gene Expression." Proceedings of the National Academy of Sciences 106.13 (2009): 5123-128. Print.