 "
"
Team:uOttawa/modeling
From 2013.igem.org
(Created page with "{{ Template:uOttawa_Header }} <html> <div class="row island"></div> <div class="row text-center island"> <a class="paneLink selected" href=".overview">Overview</a> <a clas...") |
|||
| Line 73: | Line 73: | ||
<img id="three" src="https://static.igem.org/mediawiki/2013/f/f4/Three.png" height="75" width="75" style="top:450px; margin-left:400px; position:absolute; display:none; overflow:hidden;"></img> | <img id="three" src="https://static.igem.org/mediawiki/2013/f/f4/Three.png" height="75" width="75" style="top:450px; margin-left:400px; position:absolute; display:none; overflow:hidden;"></img> | ||
<button id="spikeY" onClick="fadeYs();drawY()" style ="top:450px; height:75px; width:350px; margin-left:480px; background-color:white; border:2px solid green; position:absolute; font-size:30px; position:absolute; cursor:pointer; display:none; overflow:hidden; " align="right"> Click to show repression by Y!</button> | <button id="spikeY" onClick="fadeYs();drawY()" style ="top:450px; height:75px; width:350px; margin-left:480px; background-color:white; border:2px solid green; position:absolute; font-size:30px; position:absolute; cursor:pointer; display:none; overflow:hidden; " align="right"> Click to show repression by Y!</button> | ||
| - | <button id="restartButton" onClick="document.location.reload(true)" style="top: | + | <button id="restartButton" onClick="document.location.reload(true)" style="top:400px; height:85px; width:300px; margin-left:200px; display:none; position:absolute; font-size:25px; background-color:white; border:2px solid blue; cursor:pointer;">Restart!</button> |
</div> | </div> | ||
Revision as of 04:48, 27 September 2013


Modeling the Type-I Incoherent Feedforward Loop
The Feedforward loop can be broken down into 3 main steps
1. Toxin will stimulate production of X (rtTA).
2. X (rtTA) stimulates production of both Z (sfGFP) and Y (LacI).
3. Sufficient repression from Y terminates Z (sfGFP) production.
You can take a better look at the system by clicking on the button below!


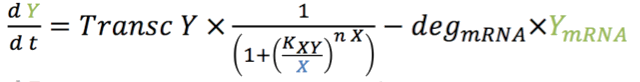
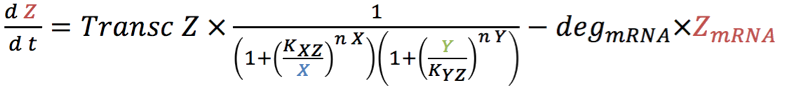


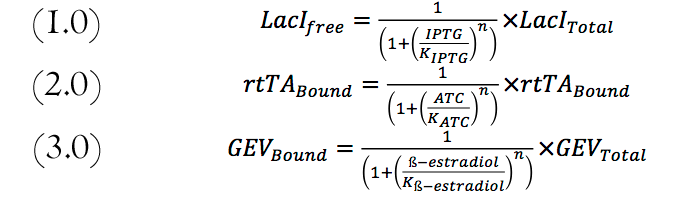
Equations involved in modeling the biological system
The mathematical model was developed using basic rate formulas of activation and repression as shown in the system of equations above. We then expanded them to include the different parameters required for our model.
These additions are as follows
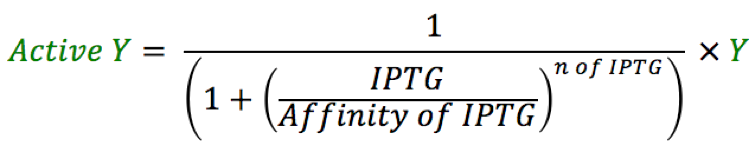
IPTG concentration to calculate the amount of Y (LacI) repressing Z (sfGFP).
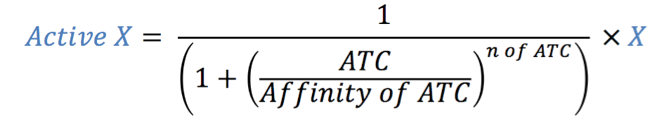
ATC concentration to calculate the amount of X (rtTA) available to bind Y promoter and Z promoter.
Transfer rates of proteins between the cytosol and the nuclei to calculate transfer rates by size of each protein.
The four rate equations for the production of mRNA over time of GEV (1.1), X (rtTA) (2.1), Y (LacI) (3.1) and Z (sfGFP) (4.1) in the nucleus are show below.

The first sets of equations were used to describe the amount of mRNA transcribed. These equations also took into consideration that the mRNA would be transported out of the nuclei. In the model, we assumed that all of the mRNA molecules would be exported to the cytosol. The differential equations representing the variation in mRNA in the cytosol are represented below in equations 1.2, 2.2, 3.2 and 4.2.

Computing the variation and amounts of mRNA in the cytosol over time then allowed us to compute the variation of protein translated. The equations of translation shown below in equations 1.3, 2.3, 3.3, 4.3 represent the variation of protein in the cytosol over time. The translational rates were calculated based on the average translation rate of a ribosome (9.5 base pair per second 12). Here, we assume that the quantity of ribosome is not a limiting factor and that there are no translational regulations involved in the model. The degradation rates are taken from the average degradation rate of protein in yeast14.

Once the amounts of protein calculated, we assumed that they would diffuse at an average rate through the nuclear pore to then affect the transcription of the other genes in the system. The calculations leading to the transfer rates are described in the parameter section under transf. Equations 1.4, 2.4, 3.4 and 4.4 represent the variation of protein present in the nucleus over time.

To have better control on the feed-forward loop system, LacI was regulated with IPTG. Changing the amount of ATC regulated the amount of active rtTA. And the Amount of GEV available to activate production of rtTA is controlled with ß-estradiol. The following equations used to compute the amount of each compound are shown below. These numbers are imputed in the mRNA equations and vary accordingly with the amount of each transcription factors expressed in the ODE system.
Parameters
Some parameters were found in the literature. Others were derived from other known constants as explained below.
Transcription rate
The transcription rate was calculated using the known rate of 2kb per minutes6 which translates to 33.3 nucleotides per second. This rate was then divided by the amount of nucleotides in one mRNA strand. The values are in the parameter table.
Translation rate
The translation rate was calculated using the known rate of 9.5 amino acid per second12. This rate was then divided by the amount of amino acids per protein. The values are in the parameter table.
Transfer rate of protein from the cytosol to the nucleus
The rate of transfer from the cytosol to the nucleus was extrapolated from the formula rate = 0.01*(5000-size of protein in Dalton)-50. This is the multiplied by 119 or the average number of nuclear pores in yeast7. The first equation was determined by assuming that transfer rate of protein 5000 Da takes 0 seconds and a 17000 Da protein takes 120 seconds11.
|
|
GEV |
rtTA |
LacI |
sfGFP |
IPTG |
ß-estradiol |
ATC |
|
Translation rates (mRNA/s) |
0.02088 |
0.01503 |
0.01599 |
0.03991 |
|
|
|
|
n (Hill coefficient) |
1 |
2 |
2 |
- |
2 |
1 |
1 |
|
K |
10^-613 |
5*10^-413 |
10^-10 1 |
- |
5*10^-63 |
10^-94 |
1.56*10^-913 |
|
FullTrans (molecules/second) |
0.02442 |
0.01758 |
0.01870 |
0.04668 |
|
|
|
|
Transf |
0.297 |
0.19993 |
0.2150 |
|
|
|
|
|
Leakage |
1.5 molecule/hour for one promoter |
||||||
References
- http://bionumbers.hms.harvard.edu/bionumber.aspx?&id=100741&ver=0 K of LacI to DNA.
- http://bionumbers.hms.harvard.edu/bionumber.aspx?&id=100743&ver=0&trm=laci K of IPTG to LacI.
- http://pubs.acs.org/doi/pdf/10.1021/jp308930c K of IPTG to LacI.
- http://www.rcsb.org/pdb/explore/explore.do?structureId=1ORK
- http://www.ncbi.nlm.nih.gov/pmc/articles/PMC373162/ Time division of yeast
- http://www.ncbi.nlm.nih.gov/pmc/articles/PMC3154325/pdf/nihms314191.pdf Fully induced transcription
- http://bionumbers.hms.harvard.edu/bionumber.aspx?&id=101395&ver=1&trm=pore%20yeast number of pores
- https://2009.igem.org/Team:PKU_Beijing/Modeling/ODE calculation of rate
- http://www.ncbi.nlm.nih.gov/pmc/articles/PMC373162/ Time division of yeast
- http://www.nature.com/nbt/journal/v30/n7/pdf/nbt.2281.pdf Half life of sfGFP
- http://www.ncbi.nlm.nih.gov/books/NBK26932/ speed of pore
- http://download.cell.com/pdf/PIIS0092867413006557.pdf?intermediate=true Rate of translation
- Approximated to adapt the model
- Dmitry Nevozhaya, Rhys M. Adamsa, Kevin F. Murphyb, Kresˇimir Josic, and Ga bor Bala zsia, Negative autoregulation linearizes the dose–response and suppresses the heterogeneity of gene expression, www.pnas.org/cgi/doi/10.1073/pnas.0809901106