 "
"
Team:HZAU-China/Modeling/Gray logistic
From 2013.igem.org
| Line 133: | Line 133: | ||
<p style="font-size:16px;font-family:arial, sans-serif;">Using the matrix equation in linear algebra we could determine the parameters α and β .<a><img width="200" src="https://static.igem.org/mediawiki/igem.org/9/9e/7.png"></a>,<a><img width="250" src="https://static.igem.org/mediawiki/igem.org/6/60/8.png">,</a><a><img width="250" src="https://static.igem.org/mediawiki/igem.org/7/7a/9.png"></a></p> | <p style="font-size:16px;font-family:arial, sans-serif;">Using the matrix equation in linear algebra we could determine the parameters α and β .<a><img width="200" src="https://static.igem.org/mediawiki/igem.org/9/9e/7.png"></a>,<a><img width="250" src="https://static.igem.org/mediawiki/igem.org/6/60/8.png">,</a><a><img width="250" src="https://static.igem.org/mediawiki/igem.org/7/7a/9.png"></a></p> | ||
| - | <p style="text-align:center;"><a><img width=" | + | <p style="text-align:center;"><a><img width="600" src="https://static.igem.org/mediawiki/2013/f/f5/90.png" ></a></br></p> |
<p style="font-size:16px;font-family:arial, sans-serif;">From the result ,we know the value of posterior-variance is 0.1931.The posterior-variance is lower than 0.35 so that the model precision is excellent.</p> | <p style="font-size:16px;font-family:arial, sans-serif;">From the result ,we know the value of posterior-variance is 0.1931.The posterior-variance is lower than 0.35 so that the model precision is excellent.</p> | ||
| - | <p style="font-size:16px;font-family:arial, sans-serif;">In a conclution,Our engineering bacterium growth curve is in the dog's blood is<a><img width=" | + | <p style="font-size:16px;font-family:arial, sans-serif;">In a conclution,Our engineering bacterium growth curve is in the dog's blood is<a><img width="270" src="https://static.igem.org/mediawiki/igem.org/5/58/10.png"></a>;is the logarithm of the CFU of Bacillus subtilis.</p> |
</div> | </div> | ||
Revision as of 13:26, 25 September 2013
Aim:
To know the growth curve in the dog’s blood
Steps:
1.Do experiment to measure the number of bacteria;
2.Establish the gray logistic model to simulate the growth of bacteria;
3.Determine the parameter through the experiment;
4.Test the predicted results.
Results:
The gray logistic model gets the good forecasting result.And the model precision is excellent.
Background:
The color of blood is so deep that it is not fit to measure the OD value to determine the growth of bacteria in the blood.Then we choose dilution-plate method to detect the number of total bacteria. So we coated a large number of plates.The logistic model of population can well predict the increase of population.
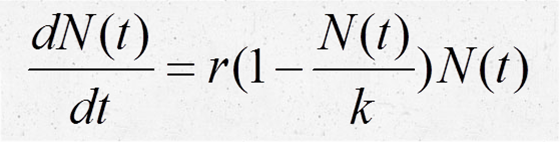
Establish the logistic model:
In the environment of the blood,the number of bacteria have a maximum value K.And when the number of bacteria approach K,the growth rate is next to nil.Then the population growth equation is as follows:
The solution of the equation is :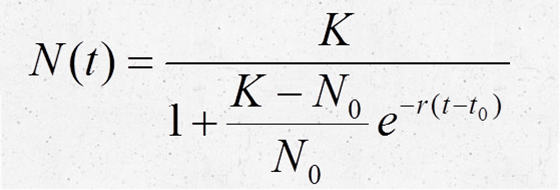
N0 is the number of bacterial population.r is population growth rate.To make it convenient to calculate,we simplify the equation ;A,B and r are unknown parameters. is the logarithm of the CFU of Bacillus subtilis.
Using the gray system theory to determine the parameters:
To determine the parameters of the equation,we use the gray system theory.The equation can be rewritten: ;
; ;
; ;
;
Using the matrix equation in linear algebra we could determine the parameters α and β . ,
, ,
,

From the result ,we know the value of posterior-variance is 0.1931.The posterior-variance is lower than 0.35 so that the model precision is excellent.
In a conclution,Our engineering bacterium growth curve is in the dog's blood is ;is the logarithm of the CFU of Bacillus subtilis.