 "
"
Team:HZAU-China/Modeling/Gray logistic
From 2013.igem.org
| Line 33: | Line 33: | ||
ul.menu:after{content:"";display:block;height:0;clear:both;visibility:hidden;} | ul.menu:after{content:"";display:block;height:0;clear:both;visibility:hidden;} | ||
ul.menu, | ul.menu, | ||
| - | ul.menu ul {padding:0;margin:0;list-style:none;position:;width:220px;background:# | + | ul.menu ul {padding:0;margin:0;list-style:none;position:;width:220px;background:#d3f18c;font-family:arial, sans-serif;} |
ul.menu {z-index:100;padding:10px;margin:0 auto;} | ul.menu {z-index:100;padding:10px;margin:0 auto;} | ||
ul.menu ul {z-index:50; | ul.menu ul {z-index:50; | ||
| Line 45: | Line 45: | ||
ul.menu > li {margin-top:2px;font-size:12px;} | ul.menu > li {margin-top:2px;font-size:12px;} | ||
ul.menu > li a {font:normal 16px/29px arial, sans-serif;color:#fff;text-decoration:none;} | ul.menu > li a {font:normal 16px/29px arial, sans-serif;color:#fff;text-decoration:none;} | ||
| - | ul.menu label.open {display:block;background:# | + | ul.menu label.open {display:block;background:#517b1f no-repeat 170px 12px;line-height:30px;position:relative;z- |
| - | + | ||
index:100;font:normal 12px/30px arial, sans-serif;color:#fff;border-radius:10px 10px 0 0;} | index:100;font:normal 12px/30px arial, sans-serif;color:#fff;border-radius:10px 10px 0 0;} | ||
| - | + | ul.menu span {display:block;background:#517b1f;line-height:30px;position:relative;z-index:100;font-size: 16px;padding-left:10px;} | |
| - | ul.menu span {display:block;background:# | + | |
ul.menu label img {position:absolute;left:0;top:0;width:100%;height:30px;} | ul.menu label img {position:absolute;left:0;top:0;width:100%;height:30px;} | ||
ul.menu ul li {margin-top:-30px; | ul.menu ul li {margin-top:-30px; | ||
| Line 58: | Line 56: | ||
transition: 0.5s; | transition: 0.5s; | ||
} | } | ||
| - | ul.menu ul li a {display:block;font:normal 16px/29px arial, sans-serif;color:#000;background:# | + | ul.menu ul li a {display:block;font:normal 16px/29px arial, sans-serif;color:#000;background:#b3e24b;} |
| - | ul.menu ul li a:hover {background:# | + | ul.menu ul li a:hover {background:#d3f18c;} |
ul.menu input {position:absolute;left:-9999px;} | ul.menu input {position:absolute;left:-9999px;} | ||
ul.menu li input:checked + label {background:#069;} | ul.menu li input:checked + label {background:#069;} | ||
| - | ul.menu li input:checked ~ ul {background:# | + | ul.menu li input:checked ~ ul {background:#b3e24b;padding-bottom:10px;} |
ul.menu li input:checked ~ ul li {margin-top:0;} | ul.menu li input:checked ~ ul li {margin-top:0;} | ||
ul.menu label.close {display:block;width:200px;height:30px;background:transparent url("/jscss/demoimg/201208/u-arrow.gif") | ul.menu label.close {display:block;width:200px;height:30px;background:transparent url("/jscss/demoimg/201208/u-arrow.gif") | ||
Revision as of 09:38, 27 September 2013
Aim:
To know the growth curve of Bacillus subtilis in the dog’s blood.
Steps:
1. Experimentally measure the number of bacteria;
2. Establish the gray logistic model to simulate the growth of bacteria;
3. Determine the parameters through experiments;
4. Test the predicted results.
Results:
The gray logistic model gets the good forecasting result.And the model precision is excellent.
Background:
The color of blood is so deep that it is not fit to measure the OD value to determine the growth of bacteria in the blood. So we chose dilution-plate method to detect the number of total bacteria. We coated a large number of plates. If you want to know the details of the experiment, please click here. The logistic model of population can well predict the increase of population.
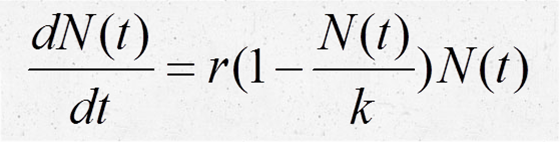
Establishing the logistic model:
In the blood environment, the number of bacteria has a maximum value K. When the bacteria number approaches K, the growth rate approaches zero. Then the population growth equation is as follows:
The solution of the equation is :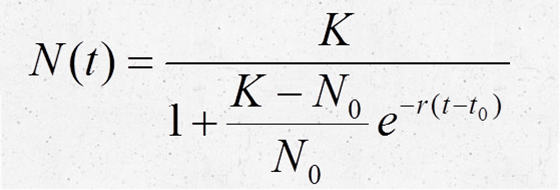
where N0 is the size of bacterial population and r, we rewrite the above equation as where A=K,
  and r are unknown parameters. N is the logarithm of the colony-forming unit of Bacillus subtilis.
Determining the parameters using the gray system theory:
To determine the parameters of the equation,we used the gray system theory. The equation can be rewritten as:
 ,
, ,
, ;
;Using the matrix equation in linear algebra we could determine the parameters α and β .
 ,
, ,
,


From the results, we know the value of posterior-variance is 0.1931, lower than 0.35, so that the model precision is excellent.
In conclution, the growth curve of our engineered bacterium in dog's blood is given by ; where N(t) is the logarithm of the CFU of Bacillus subtilis.
Reference:
1.Shiqiang Zhang, China's Population Growth Model Based on Grey System Theory and Logisitic Model[C]. 2010:4.
2.Xiaoyin Wang, Baoping Zhou 2010. Mathematical modeling and mathematical experiment. Beijing : Science press.