 "
"
Team:Imperial College/Modelling P3HBsyn
From 2013.igem.org


Contents |
Modelling: P(3HB) synthesis module
This page is about modelling the plastic-synthesising module developed in our project. The plastic that this module synthesises is the bioplastic poly-3-hydroxybutyrate, also known as P(3HB). The content below shows the process of building, designing and optimisation of the model. Also, the considerations, assumptions and limitations will be discussed.
Specifications
- Input = monomer (3HB)
- Output = polymer (P(3HB))
Deterministic model
The model was built and simulated in Simbiology, a Matlab package designed for modelling biological systems. In our model we have a compartment (labelled "E. coli_1") that represents our engineered cell. The compartment contains the reactions and species that interact with the polymer synthesis pathway.
The pathways on the right half of the cell are genetic expressions of the 3 enzymes involved in the plastic synthesis pathway. The pathways on the left represent the actual P(3HB) production pathway.


ODEs in Matlab Simbiology model
Genetic regulations and expressions
BDH2 (3-hydroxybutyrate dehydrogenase)


PhaB (Acetoacetyl-CoA reductase)and PhaC (P(3HB) synthase)


Values, sources and assumptions
| Parameter | Description | Value | Units | Sources | Assumptions |
|---|---|---|---|---|---|
| β | maximum rate of transcription | 0.032 | mM/min | Please see derivation below | Please see derivation below |
| n | Hill coefficient | 2.0 | dimensionless | ||
| K | Activation coefficient | 0.0031 | mM | ||
| d_mRNA | mRNA degradation rate | 0.1 | 1/min | ||
| d_protein | Protein degradation rate | 0.050 | 1/min | There is no active degradation pathway and that dilution is the dominant way by which the protein level decreases in a cell | |
| k2 | mRNA production rate | 4.7 | 1/min | ||
| k3 | Protein production rate | 0.039 | 1/min | ||
| [Arabinose] | Concentration of arabinose | Initial: 0.008 | mM | ||
| [mRNA] | Concentration of mRNA | - | mM | - | - |
| [BDH2] | Concentration of BDH2 | - | mM | - | - |
| [PhaB] | Concentration of PhaB | - | mM | - | - |
| [PhaC] | Concentration of PhaB | - | mM | - | - |
Derivation of the maximal expression rate,β
- Average Mw of a base pair = 660g/mol
- Average mass of a base pair = 660g/mol x 1.66x10-24 = 1.1x10⁻²¹g
- Volume of an E.coli cell = 1µm3 = 1x10-15L
- ∴Mass concentration =
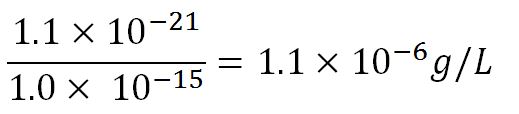
- ∴Molar concentration of 1 base pair in the volume of E.coli =
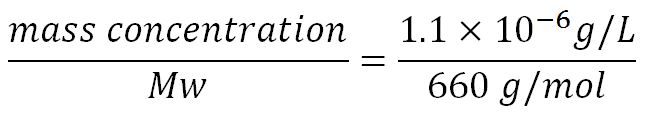 = 1.66 x10⁻⁶ mM
- ∴Mass concentration =
- BioBrick assembly plasmid pSB1C3 is a high copy number plasmid (100-300 copies per cell)
- assume 200 copies per cell
- ∴ concentration of the gene per cell = Nx200x1.66x10-6mM, where N = number of base pairs
- ∴ concentration of the gene BDH2 (N = 768) in the volume of an E.coli cell is = 0.25mM
- Transcription rate in E.coli = 80bp/s = 80x1.66x10-6mM/s = 80x1.66x10-6x60mM/min = 7.97x10⁻³mM/min
- ∴ Rate of mRNA_BDH2 production under the control of pBAD = 7.97x10⁻³÷0.25 = 0.032/min

Enzyme kinetics
BDH2 (3-hydroxybutyrate dehydrogenase)
atoAD (Acetyl-CoA:acetoacetyl-CoA transferase (α and β subunits))
phaB (Acetoacetyl-CoA reductase)
phaC (P(3HB) synthase)
Simulation results
P(3HB) production
Model-guided design and optimisation
Sensitivity analysis: species concentrations
What is sensitivity analysis and why do it?
In order to look at how we could increase the production of P(3HB) we decided to run a sensitivity analysis (also in Simbiology) to identify what species in the model P(3HB) is sensitive to, given the specific conditions with which we set the model. In other words, we calculated the time-dependent sensitivity of P(3HB) with respect to the initial conditions of other species (species formed along the synthesis pathway and enzymes involved).[http://www.mathworks.co.uk/help/simbio/ug/calculating-sensitivities.html#brbumlr|ref]
For a species x, whose concentration depends on time, it can be expressed as x(t). To calculate the sensitivity of x(t) with respect to another species y(t), the sensitivity with normalisation relative to the numerator x(t) can be calculated as:

Therefore, the underlying algorithm for this sensitivity analysis of P(3HB) is:


Scan with different levels of PhaB
The plot below is to show that increasing PhaB concentration within the engineered organism would have a positive effect on the concentration of the P(3HB) synthesised. As so many parameters within the model were taken from different sources, it would be difficult to give a simulation plot that is accurate quantitatively. It was decided to show the single cell simulation for this because the scans were carried out up to the doubling time of 20mins, hence avoided the issue of scaling-up which would have otherwise subjected the simulation to more errors. Therefore, this plot should be interpreted from a qualitative perspective and the trend should be observed.

Difference between promoter expressions after optimisation
Metabolic considerations
The metabolic model predicts the interaction of our pathway with endogenous pathways. In synthetic biology, an ideal system is fully orthogonal. However, it can be the case, such as here that coenzymes are needed for the reaction steps in a metabolic pathway. When we realised that our pathway uses a lot of Co-A, we constructed a model to see how this can be recycled and predict whether it would negatively effect the chassis. Tell that the Co-A is regenerated at the same speed as it is used and therefore there is not a huge amount of Co-A "stuck" in the pathway at any one time. (Bobby, how much Co-A is that exactly?) This informed us about that the cells should be able to bear the burden of the pathway.
Metabolic model to optimise PHB production. Tell us how you predicted that phaB is the key enzyme and justify why the increase in enzyme level will increase the amount of PHB. This informed our design and we are changing the promoter in front of the phaCAB operon. Tell that if we can predict that it would be useful to downregulate any genes in the native metabolism of E.coli.
Effect on growth and interference with metabolism
Initial concentrations of metabolites
References