"
"
Team:XMU-China/Content4
From 2013.igem.org
| (175 intermediate revisions not shown) | |||
| Line 13: | Line 13: | ||
</head> | </head> | ||
| - | <body | + | <body> |
| - | + | ||
| - | + | ||
| - | + | ||
| - | + | ||
| - | + | ||
| - | + | ||
| - | + | ||
| - | + | ||
| - | + | ||
| - | + | ||
| - | + | ||
| - | + | ||
| - | + | ||
| - | + | ||
| - | + | ||
| - | + | ||
| - | + | ||
| - | + | ||
| - | + | ||
| - | + | ||
| - | + | ||
| - | + | ||
| - | + | ||
| - | + | ||
| - | + | ||
| - | + | ||
| - | + | ||
| - | + | ||
| - | + | ||
| - | + | ||
| - | + | ||
| - | + | ||
| - | + | ||
| - | + | ||
| - | + | ||
| - | + | ||
| - | + | ||
| - | + | ||
| - | + | ||
| - | + | ||
| - | + | ||
| - | + | ||
| - | + | ||
<!-- START WRAPPER SECTION --> | <!-- START WRAPPER SECTION --> | ||
| - | <div id="wrapper"> | + | <div id="wrapper" style="margin-top: 40px"> |
<style> | <style> | ||
#wrapper {background:#fffccc} | #wrapper {background:#fffccc} | ||
| + | p {font-family:Calibri ; font-size:20px ;line-height:30px;text-align: justify;} | ||
</style> | </style> | ||
<div id="separator"> | <div id="separator"> | ||
<div class="center-block"> | <div class="center-block"> | ||
<a name="Gene_OS"></a> | <a name="Gene_OS"></a> | ||
| - | <h3>Gene | + | <h3>Gene OS: <small style="font-size:45px">Model of Synchronized Oscillator</small></h3> |
<span></span> | <span></span> | ||
</div> | </div> | ||
| Line 76: | Line 34: | ||
<div class="img-border"> | <div class="img-border"> | ||
| - | <img src="https://static.igem.org/mediawiki/2013/ | + | <img src="https://static.igem.org/mediawiki/2013/d/d2/Xmu-Image04.png" width =200px height=300px class="border alignleft" alt="Figure 1" /> |
</div> | </div> | ||
| - | + | <p>Due to the complexity of our circuit, it is easier to understand the mechanism through modeling. In addition, the suitable modeling gives the results more quickly and correctly. A good mathematic model can also help us compare the affecting strength of different factors.</p><br /> | |
| - | + | ||
| + | <h4>Software & Function Introduction<br/><br/></h4> | ||
| + | <p>Based on the DDEs, Gene OS has two main modes of simulations. The basic simulation is designed for the oscillate circuit with <i>LuxI</i>, <i>aiiA</i> and <i>LuxR</i>, while the advanced simulation adds the effect of <i>ndh</i> gene.</p> | ||
| + | <div class="clear"></div> | ||
| + | <p><small style="font-size:16px"> Figure 1 shows the first <br/> interface of the Gene OS.</small></p><p> | ||
| + | In each of modes, users can make a series of graphs through setting the different parameters. The numbers of graphs mainly depend on the different parameters and the modes.<br />The advanced simulation is expected to design for the oscillate circuit with <i>LuxI</i>, <i>aiiA</i>, <i>LuxR</i> and <i>ndh</i>, but we have not finished it. | ||
</p> | </p> | ||
<div class="clear"></div><center> | <div class="clear"></div><center> | ||
| - | <img src="https://static.igem.org/mediawiki/2013/ | + | <img src="https://static.igem.org/mediawiki/2013/2/2d/Xmus-Image005.png" width =350px height=300px class="border alignleft" alt="Figure 2" style="margin-left:70px"/> |
| - | <img src="https://static.igem.org/mediawiki/2013/ | + | <img src="https://static.igem.org/mediawiki/2013/2/2c/Xmus-Image006.png" width =350px height=300px class="border alignleft" alt="Figure 3" style="margin-left:80px"/></center> |
| - | <div class="clear"></div> | + | <div class="clear"></div> |
| - | + | <p><small style="font-size:16px"> Figure 2 shows the basic simulation user interface. Figure 3 shows the choose dialog box.</small></p> | |
| - | The meaning of each parameter can be displayed when click each parameter or right click each input box. For the people first use this software, we designed the | + | |
| - | To get an idea about the different conditions in which oscillations could occur, we created a function which allows users to enter the range in which the variables should be varied and compare their results in the results. Due to the | + | <p>This is the interface of the basic simulation where users set the parameters. We added many functions to make Gene OS more user-friendly.<br /><br /> |
| - | A white noise system was coded to simulate the noisy environment in the medium. This function makes the model closer to the actual environment. Users can set the strength by clicking “add white noise” box and inputting the decibels.<br/> | + | The meaning of each parameter can be displayed when click each parameter or right-click each input box. For the people first use this software, we designed the “One example” function which can set the parameters suitably in a single time.<br/> <br/> |
| - | A script calculates amplify and period of the oscillation is also added as an additional function. This allows our software detect and compare the characteristic of certain oscillation.<br/> | + | To get an idea about the different conditions in which oscillations could occur, we created a function which allows users to enter the range in which the variables should be varied and compare their results in the results. Due to the calculation speed, we finally apply this function in fluid flow speed and cell density, which are the most important parameters in the model. For example, people can set the cell density range from 0.1 to 0.9 with the step 0.2 by not selecting the “Fix the cell density” item.<br/> <br/> |
| - | After setting all the parameters, users can save and output these settings into a standard 2003 excel file through the file menu. Loading is also supported which makes more | + | A white noise system was coded to simulate the noisy environment in the medium. This function makes the model closer to the actual environment. Users can set the strength by clicking “add white noise” box and inputting the decibels.<br/> <br/> |
| - | Before | + | A script calculates amplify and period of the oscillation is also added as an additional function. This allows our software detect and compare the characteristic of certain oscillation.<br/><br/> |
| + | After setting all the parameters, users can save and output these settings into a standard 2003 excel file through the file menu. Loading is also supported which makes it more convenient for transmitting the parameters.<br/> <br/> | ||
| + | Before drawing the graphs, users need to choose the plot mode when range parameters exist. For example, when set the cell density the software will ask user to draw separately or put curves with different cell density together. <br/> <br/> | ||
</p> | </p> | ||
| + | <p>Then clicking the “Draw” button, the software iterates over the values and plots graphs of all combinations possible for that range of values. After calculating, at most 3 kinds of graphs can be given, (1) concentration alteration of four main protein (2) fluorescence alteration under different cell density and fluid flow speed (3) amplify and period alteration under different cell density and fluid flow speed. </p> | ||
<div class="clear"></div><center> | <div class="clear"></div><center> | ||
| - | <img src="https://static.igem.org/mediawiki/2013/ | + | <img src="https://static.igem.org/mediawiki/2013/b/b9/Xmus-Image007.png" width =300px height=300px class="border alignleft" alt="Figure 4" style="margin-left: 40px;"/> |
| - | <img src="https://static.igem.org/mediawiki/2013/ | + | <img src="https://static.igem.org/mediawiki/2013/e/e1/Xmus-Image008.png" width =550px height=300px class="border alignleft" alt="Figure 5" style="margin-left: 40px;"/></center> |
| + | <p><small style="font-size:16px"> Figure 4 & 5 show some example output of Gene OS.</small></p> | ||
<div class="clear"></div> | <div class="clear"></div> | ||
| - | + | ||
<div class="clear"></div><center> | <div class="clear"></div><center> | ||
| - | <img src="https://static.igem.org/mediawiki/2013/ | + | <img src="https://static.igem.org/mediawiki/2013/5/55/Xmus-Image009.png" width =300px height=300px class="border alignleft" alt="" /> |
| - | < | + | </center> |
| + | |||
| + | <p>To protect the software and computer, we designed an error-stop system which could stop the simulation as soon as one error was detected. This system also is called when users click “Cancel” button to stop the calculation. But different with error happened; this stop process takes about 1 min. | ||
| + | <br /><br />The calculation speed of this software depends on the complexity of the parameters. Choosing both cell density range and fluid flow range to calculate can sometimes take more than 10 minutes. It is mainly because the large numbers of nested for-loops in the script and the slowly calculation speed about MATLAB core. | ||
| + | </p> | ||
<div class="clear"></div> | <div class="clear"></div> | ||
| - | <p style="font-size: | + | <p> |
| - | + | <small style="font-size:16px">Figure 6 shows some example output of Gene OS.</small> | |
| + | <br /><br />You can download the MATLAB code <a href="https://static.igem.org/mediawiki/2013/8/8c/XMU-China_GeneOS.zip" style="Font-size:19px">here</a>.</p> | ||
| - | |||
| - | |||
</div><!-- .center-block-page --> | </div><!-- .center-block-page --> | ||
| Line 121: | Line 91: | ||
<div id="separator"> | <div id="separator"> | ||
<div class="center-block"> | <div class="center-block"> | ||
| - | <a name=" | + | <a name="ImageMe"></a> |
| - | <h3>ImageMe</h3> | + | <h3>ImageMe: <small style="font-size:45px">Microfluidic Image Analyser</ small></h3> |
| - | <span> | + | <span></span> |
</div> | </div> | ||
</div> | </div> | ||
| Line 132: | Line 102: | ||
<div class="img-border"> | <div class="img-border"> | ||
| - | <img src="https://static.igem.org/mediawiki/2013/ | + | <img src="https://static.igem.org/mediawiki/2013/6/65/Xmus-Image010.png" width =200px height=300px class="border alignleft" alt="" /> |
</div> | </div> | ||
| - | <p | + | <h4>Background<br/><br/></h4> |
| + | <p> | ||
| - | + | We usually got a great number of fluorescent images every time when we finished the 8-hour-long microfluidic experiment. However, to get the data we have to calculate each trap in each image though using the software. What’s worse, the software could only process one image each time. Obviously, a more humanized software is needed if we do not want to spend much time on the manual work.<br /><br /> | |
| + | <small style="font-size:16px">Figure 7 shows the first interface of the ImageMe.</small> | ||
| + | </p> | ||
<div class="clear"></div> | <div class="clear"></div> | ||
| - | <h4> | + | <h4>Coding in MATLAB<br/><br/></h4> |
| - | <div class="clear"></div> | + | <div class="clear"></div> |
| - | <p | + | <p> |
| - | + | As we have not found such software on the net, we decided to design our own software. Thus, we used MATLAB coding the script and designed the user interface again for easy use.<br/><br/> | |
| + | We called this one “ImageMe” which was related with our team name. The most advantage of ImageMe is that it can analyze all the traps in the all images once.<br/><br/> | ||
| + | |||
</p> | </p> | ||
| - | <img src="https://static.igem.org/mediawiki/2013/ | + | <div class="clear"></div> |
| - | <img src="https://static.igem.org/mediawiki/2013/ | + | <h4>Algorithm<br/><br/></h4> |
| - | <img src="https://static.igem.org/mediawiki/2013/ | + | <div class="clear"></div> |
| - | + | <p> | |
| + | Thanks to the powerful image processing ability of MATLAB, the main algorithm is concise and efficient. First ImageMe changes the 256-color image to gray scale image and then uses edge processing to make the edge of each trap easier to detect. This process also reduces the negative effect of the background. The final step is to calculate the total gray level using numerical integration. | ||
| + | |||
| + | </p><br /> | ||
| + | <h4>Software & function introduction<br/><br/></h4> | ||
| + | <div class="clear"></div> | ||
| + | <p>Comparing with the Gene OS, ImageMe has more concise interface arrangement and easier to use. Click “Start” to enter the main interface.<br/></p> | ||
| + | <img src="https://static.igem.org/mediawiki/2013/2/2d/Xmus-Image011.png" width =450px height=360px class="border alignleft" alt="" style="margin-left:20px"/> | ||
| + | <img src="https://static.igem.org/mediawiki/2013/a/aa/Xmus-Image012.png" width =450px height=360px class="border alignleft" alt="" style="margin-left:20px"/> | ||
| + | <p><small style="font-size:16px"> Figure 8 shows the main interface. Figure 9 shows the input dialog box.</small></p> | ||
| + | <div class="clear"></div> | ||
| + | |||
| + | <p>This is the main interface of ImageMe. Here, users can load the images by clicking the “Load” button and then choose the images. Then, ImageMe will pre-read all the images with “.jpg” suffix in this root directory. Make sure that no other .jpg images exist in the same folder. Click “Remove” button before changing the images to be analyzed.<br/><br/> | ||
| + | |||
| + | After clicking the “Begin” button, ImageMe will ask users to input two parameters (which are also the only two need to input through the whole process) to assist the analysis more correctly. The two parameters are very easy to get comparing with those in Gene OS. First one is the lines of the traps and the second one is the rows. To get correct and precise results, please do not change the view or magnification times while taking images.<br/></p> | ||
| + | <p>It is common that some images are indistinct or the edges are difficult to detect. When these situations occur to one image, ImageMe will use fuzzy calculation to analyze this one and make sure the result has the most correctness. <br/><br/> | ||
| + | The real time message will be written on the screen when some indistinct images are detected or some errors happened.<br/><br/> | ||
| + | If the analysis finished successfully, the graphs will show on the screen automatically. At most two kinds of graphs can be given, (1) fluorescence strength change in each trap (2) fluorescence strength change in each line.<br/> | ||
| + | </p> | ||
| + | <div class="clear"></div> | ||
| + | <img src="https://static.igem.org/mediawiki/2013/4/4c/Xmu-Image013.png" width =300px height=250px class="border alignleft" alt="" style="margin-left:110px"/> | ||
| + | <img src="https://static.igem.org/mediawiki/2013/2/25/Xmu-Image014.png" width =450px height=250px class="border alignleft" alt="" /> | ||
| + | <img src="https://static.igem.org/mediawiki/2013/0/09/Xmus-Image015.png" width =800px height=250px class="border alignleft" alt="" style="margin-left:100px"/><div class="clear"></div> | ||
| + | <p><small style="font-size:16px"> Figure 10 to 12 show the graphs given by ImageMe.</small></p> | ||
| + | <p> | ||
| + | An output function was added to make possible for drawing these graphs through other software. This function generates an excel file including all statistic results about every image and every trap. Thus, users can get the results very easily.</br></br> | ||
| + | The calculation speed of ImageMe depends on the complexity of the images. Too many lines and rows may lead to less correct results and take more time. However, analyze 80 example images (Figure 8, showed in the main interface) takes less than 70 seconds which is fast enough using MATLAB core. | ||
| + | </p> | ||
| + | <p>You can download the MATLAB code <a href="https://static.igem.org/mediawiki/2013/0/0e/XMU-China_ImageMe.zip" style="Font-size:19px">here</a>. A group of test images is included. | ||
| + | </p> | ||
| + | |||
</div><!-- .center-block-page --> | </div><!-- .center-block-page --> | ||
| Line 153: | Line 158: | ||
<!-- END WRAPPER --> | <!-- END WRAPPER --> | ||
| + | |||
| + | |||
| + | |||
| + | <!-- START WRAPPER SECTION --> | ||
| + | <div id="wrapper2" style="margin-top: 40px"> | ||
| + | |||
| + | <style> | ||
| + | #wrapper2 {background:#ffe6b7} | ||
| + | p {font-family:Calibri ; font-size:20px ;line-height:30px;text-align: justify;} | ||
| + | </style> | ||
| + | <div id="separator"> | ||
| + | <div class="center-block"> | ||
| + | <a name="Examples"></a> | ||
| + | <h3>Examples & Confirmation</h3> | ||
| + | <span></span> | ||
| + | </div> | ||
| + | </div> | ||
| + | |||
| + | <!-- START CONTENT --> | ||
| + | <div class="center-block-page clearfix"> | ||
| + | <h4>Gene OS: Comparing various results with different cell density</h4> | ||
| + | <p>This example illustrates the importance of the cell density by comparing various results with different cell density.<br /> | ||
| + | Cell density is been normalized so that it is greater than 0 and less than or equal to 1. Thus we vary the cell density from 0.1 to 0.9 with the step-size 0.25 and keep other parameters the same. | ||
| + | <br /></p> | ||
| + | <div class="clear"></div><center> | ||
| + | <img src="https://static.igem.org/mediawiki/2013/f/f0/XMU-China_s12.png" width =350px height=300px class="border alignleft" alt="" "/> | ||
| + | <p><br />Then, choose “Cell density” and start calculation. From the results we can see that under this specific condition too small or too big cell density all cannot lead to a steady oscillation. Only the cell density near 0.35 gives the expected curve. This is mainly because that cell in small density cannot product enough LuxR, AHL, aiiA & GFP to start the oscillation. This can be confirmed by the little fluorescence strength. While too many cells surely lead to high fluorescence strength and slow mass transfer speed which cover up the oscillation.</p> | ||
| + | <div class="clear"></div> | ||
| + | <p><small style="font-size:16px"> Figure 13 shows the whole parameters.</small></p> | ||
| + | |||
| + | <div class="clear"></div><center> | ||
| + | <img src="https://static.igem.org/mediawiki/2013/a/a7/XMU-China_s14.png" width =900px height=150px class="border alignleft" alt="Figure 3" style="margin-left:50px"/></center> | ||
| + | <div class="clear"></div> | ||
| + | <p><small style="font-size:16px"> Figure 14</small></p> | ||
| + | <img src="https://static.igem.org/mediawiki/2013/6/60/XMU-China_s13.png" width =350px height=300px class="border alignleft" alt="Figure 2" style="margin-left:140px"/> | ||
| + | <img src="https://static.igem.org/mediawiki/2013/f/fe/XMU-China_s15.png" width =350px height=300px class="border alignleft" alt="Figure 3" /></center> | ||
| + | <div class="clear"></div> | ||
| + | <p><small style="font-size:16px"> | ||
| + | Figure 15 Figure 16 | ||
| + | <br /> Figure 14 & 15 show the results given by Gene OS. Figure 16 shows the results when cell density equal to 0.35 and choose “Separate all”.</small></p> | ||
| + | <div class="clear"></div><center> | ||
| + | |||
| + | <br /><br /> | ||
| + | <h4>ImageMe: Comparing the results with manual calculation</h4> | ||
| + | <p>To confirm the accuracy of ImageMe, we compared the two group results with manual calculated data. Due to the different algorithm, the fluorescence strength is not equal, but the tendency indicated in the each graph is comparable. | ||
| + | <br /><br /> | ||
| + | First we compare them under the weak fluorescence situation. | ||
| + | </p> | ||
| + | <div class="clear"></div><center> | ||
| + | <img src="https://static.igem.org/mediawiki/2013/3/3e/XMU-China_s1.jpg" width =400px height=200px class="border alignleft" alt="Figure 2" style="margin-left:50px"/> | ||
| + | <img src="https://static.igem.org/mediawiki/2013/e/e0/XMU-China_s2.png" width =400px height=200px class="border alignleft" alt="Figure 2" style="margin-left:70px"/></center> | ||
| + | <div class="clear"></div> | ||
| + | <p><small style="font-size:16px"> Figure 17 shows the results line 1 given by ImageMe. Figure 18 shows the results of line 1 given by manual calculation.</small></p> | ||
| + | <p>From above, we can see that the general trend of each graph is both decreasing. However, ImageMe shows that the fluorescence strength of the last image is almost half of the first one while the manual calculation results only indicate a 15 percent decrease. The results are more amazing when we compare the 44th image (middle of the group) and the last one. ImageMe shows a 40 percent decrease while manual calculation results even implies a small increase in the fluorescence strength.<br />Now we compare these results with some of the images.<br /><br /></p> | ||
| + | <div class="clear"></div> | ||
| + | |||
| + | <img src="https://static.igem.org/mediawiki/2013/a/ac/XMU-China_s3.png" width =450px height=100px class="border alignleft" alt="Figure 2" /> | ||
| + | <p>Thus, from these images we can conclude that the fluorescence strength is decreasing significantly from the first one to the last. In addition, it is obviously that fluorescence strength of the last image is less than the middle one which </p><div class="clear"></div> | ||
| + | <img src="https://static.igem.org/mediawiki/2013/7/76/XMU-China_s4.png" width =450px height=100px class="border alignleft" alt="Figure 2" /> | ||
| + | <p>means a great computation error exists in the manual calculation.</p><div class="clear"></div> | ||
| + | <img src="https://static.igem.org/mediawiki/2013/0/0a/XMU-China_s5.png" width =450px height=100px class="border alignleft" alt="Figure 2" /> | ||
| + | <p><small style="font-size:16px">Figure 19 is the first image of line 1 in the group.<br />Figure 20 is the 44<sup>th</sup> image of line 1 in the group.<br />Figure 21 is the 84<sup>th</sup> (last one) image of line 1 in the group.</small></p> | ||
| + | <div class="clear"></div> | ||
| + | |||
| + | |||
| + | <br /> | ||
| + | <p>Second, we compare them under the strong fluorescence situation.</p><br /> | ||
| + | <div class="clear"></div><center> | ||
| + | <img src="https://static.igem.org/mediawiki/2013/8/8a/XMU-China_s6.png" width =400px height=200px class="border alignleft" alt="Figure 2" style="margin-left:40px"/> | ||
| + | <img src="https://static.igem.org/mediawiki/2013/e/e8/XMU-China_s7.png" width =400px height=200px class="border alignleft" alt="Figure 2" style="margin-left:70px"/> | ||
| + | <p><small style="font-size:16px"> Figure 22 shows the results of line 2 given by ImageMe. Figure 23 shows the results of line 2 given by manual calculation.</small></p> | ||
| + | <div class="clear"></div> | ||
| + | <p>In the second group, ImageMe shows a total 13 percent fluorescence strength increase while manual calculation indicates 10 percent. Comparing the 58th image (minimum of fluorescence strength) with the last one, ImageMe shows a 29 percent increase while manual calculation shows 32 percent. From the analysis, we can see the general trends of the two graphs match better than the first group.<br /><br />Now we compare these results with some of the images again. | ||
| + | <br /> | ||
| + | We choose the 54<sup>th</sup> and 58<sup>th</sup> (time 270 & 290) image because ImageMe shows a strange peak at 54<sup>th</sup> and a following valley at 58<sup>th</sup>. | ||
| + | </p> | ||
| + | <div class="clear"></div><center> | ||
| + | <img src="https://static.igem.org/mediawiki/2013/6/68/XMU-China_s8.png" width =450px height=100px class="border alignleft" alt="Figure 2" /> | ||
| + | <p>From these images we can observe that the fluorescence strength is increasing a little from the first one to the last. In addition, the fluorescence of 58<sup>th</sup> seems the weakest in the</p> | ||
| + | <div class="clear"></div> | ||
| + | <img src="https://static.igem.org/mediawiki/2013/8/89/XMU-China_s9.png" width =450px height=100px class="border alignleft" alt="Figure 2" /> | ||
| + | <p>four and the 54<sup>th</sup> obviously stronger than 58<sup>th</sup>. This result confirms ImageMe is sbetter again.<br />Therefore, ImageMe adapts the both situation while manual</p> | ||
| + | <div class="clear"></div> | ||
| + | <img src="https://static.igem.org/mediawiki/2013/8/8e/XMU-China_s10.png" width =450px height=100px class="border alignleft" alt="Figure 2" /> | ||
| + | <p>calculation has significant computation error when the total fluorescence strength is weak which means only gives reliable results under strong fluorescence.</p> | ||
| + | <div class="clear"></div> | ||
| + | <img src="https://static.igem.org/mediawiki/2013/3/38/XMU-China_s11.png" width =450px height=100px class="border alignleft" alt="Figure 2" /> | ||
| + | <p><small style="font-size:16px">Figure 24 is the first image of line 1 in the group.<br />Figure 25 is the 54<sup>th</sup> image of line 1 in the group.<br />Figure 26 is the 58<sup>th</sup> image of line 1 in the group.<br />Figure 27 is the 84<sup>th</sup> (last one) image of line 1 in the group.</small></p> | ||
| + | <div class="clear"></div> | ||
| + | |||
| + | <br /> | ||
| + | |||
| + | </div><!-- .center-block-page --> | ||
| + | |||
| + | <!-- END CONTENT --> | ||
| + | </div><!-- #wrapper --> | ||
| + | |||
| + | <!-- END WRAPPER --> | ||
| + | |||
| + | |||
| + | |||
| + | |||
| + | |||
| + | |||
| + | |||
| + | |||
| + | |||
| + | |||
| + | |||
| + | |||
| + | |||
| + | |||
| + | |||
| + | |||
| + | |||
| + | |||
<!-- START FOOTER --> | <!-- START FOOTER --> | ||
| - | |||
| - | |||
| - | |||
| - | |||
| - | |||
| - | |||
| - | |||
| - | |||
| - | |||
| - | |||
| - | |||
| - | |||
| - | |||
| - | |||
| - | |||
| - | |||
| - | |||
| - | |||
| - | |||
| - | |||
| - | |||
| - | |||
| - | |||
| - | |||
| - | |||
| - | |||
| - | |||
| - | |||
| - | |||
| - | |||
| - | |||
| - | |||
| - | |||
| - | |||
| - | |||
| - | |||
| - | |||
| - | |||
| - | |||
| - | |||
| - | |||
| - | |||
| - | + | <div class="clear"></div> | |
| - | <div id="home_s4"> | + | <div id="home_s4"><center> |
| - | + | <img src="https://static.igem.org/mediawiki/2013/c/cb/Xmusoftware_sponsor1.png" width="80px" height="80px"> | |
| - | <img src="https://static.igem.org/mediawiki/2013/1/18/Xmusoftware_sponsor2.png" width=" | + | <img src="https://static.igem.org/mediawiki/2013/1/18/Xmusoftware_sponsor2.png" width="80px" height="80px"> |
| - | + | <img src="https://static.igem.org/mediawiki/2013/6/6f/Xmu-Bg_header_mwlogo_notag.jpg" height="60px"> | |
| - | <img src="https://static.igem.org/mediawiki/2013/6/ | + | <img src="https://static.igem.org/mediawiki/2013/e/ed/Xmu-evernote.jpg" height="60px"> |
| - | <img src="https://static.igem.org/mediawiki/2013/ | + | </center></div> |
| - | + | ||
| - | + | ||
<div id="footer-menu"> | <div id="footer-menu"> | ||
<div class="center-block clearfix"> | <div class="center-block clearfix"> | ||
| Line 216: | Line 293: | ||
<li><a href="https://2013.igem.org/Team:XMU-China/Notebook">Notebook</a></li> | <li><a href="https://2013.igem.org/Team:XMU-China/Notebook">Notebook</a></li> | ||
<li><a href="https://2013.igem.org/Team:XMU-China/Software">Software</a></li> | <li><a href="https://2013.igem.org/Team:XMU-China/Software">Software</a></li> | ||
| - | <li><a href="https://2013.igem.org/Team:XMU-China/Human Practice"> | + | <li><a href="https://2013.igem.org/Team:XMU-China/Human Practice">Outreach</a></li> |
<li><a href="https://2013.igem.org/Team:XMU-China/Safety">Safety</a></li> | <li><a href="https://2013.igem.org/Team:XMU-China/Safety">Safety</a></li> | ||
| + | <li style="margin-left: 450px"><a href="https://2013.igem.org/Team:XMU-China/Team1#Attribution">Contact us</a></li> | ||
</ul> | </ul> | ||
| - | <div class="copyright">© Copyright | + | <div class="copyright" style="margin-right: -150px">© Copyright 2013.XMU-China iGEM All rights reserved.</div> |
</div><!-- .center-block --> | </div><!-- .center-block --> | ||
</div><!-- #footer-menu --> | </div><!-- #footer-menu --> | ||
<!-- END FOOTER MENU --> | <!-- END FOOTER MENU --> | ||
| - | |||
</body> | </body> | ||
</html> | </html> | ||
Latest revision as of 13:29, 26 October 2013
Due to the complexity of our circuit, it is easier to understand the mechanism through modeling. In addition, the suitable modeling gives the results more quickly and correctly. A good mathematic model can also help us compare the affecting strength of different factors.
Software & Function Introduction
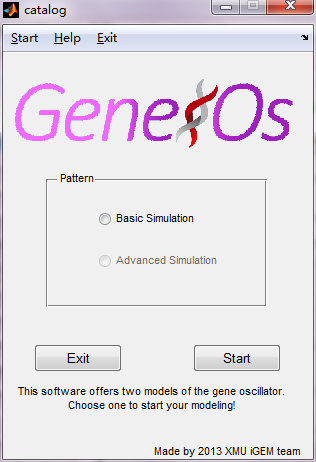
Based on the DDEs, Gene OS has two main modes of simulations. The basic simulation is designed for the oscillate circuit with LuxI, aiiA and LuxR, while the advanced simulation adds the effect of ndh gene.
Figure 1 shows the first
interface of the Gene OS.
In each of modes, users can make a series of graphs through setting the different parameters. The numbers of graphs mainly depend on the different parameters and the modes.
The advanced simulation is expected to design for the oscillate circuit with LuxI, aiiA, LuxR and ndh, but we have not finished it.
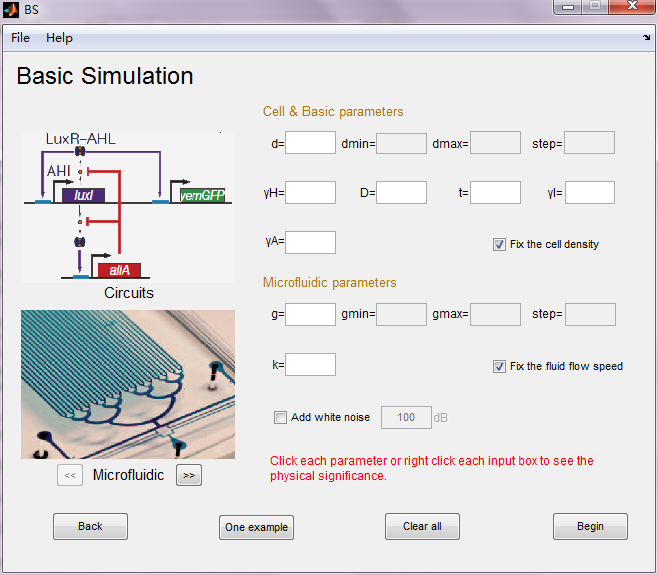
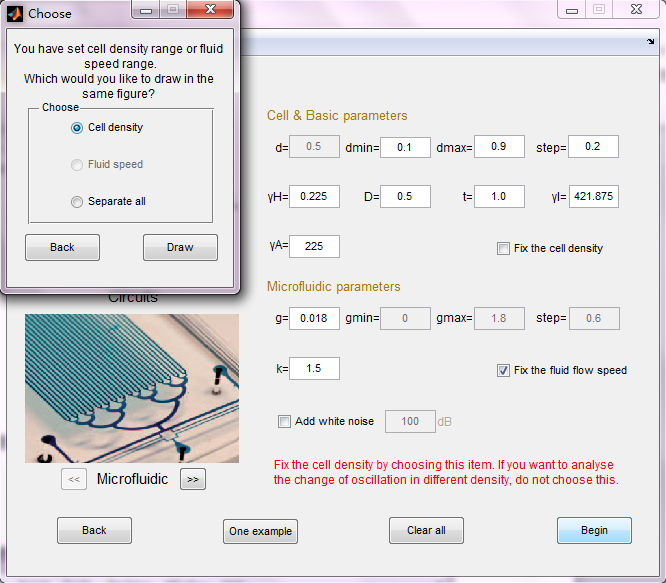
Figure 2 shows the basic simulation user interface. Figure 3 shows the choose dialog box.
This is the interface of the basic simulation where users set the parameters. We added many functions to make Gene OS more user-friendly.
The meaning of each parameter can be displayed when click each parameter or right-click each input box. For the people first use this software, we designed the “One example” function which can set the parameters suitably in a single time.
To get an idea about the different conditions in which oscillations could occur, we created a function which allows users to enter the range in which the variables should be varied and compare their results in the results. Due to the calculation speed, we finally apply this function in fluid flow speed and cell density, which are the most important parameters in the model. For example, people can set the cell density range from 0.1 to 0.9 with the step 0.2 by not selecting the “Fix the cell density” item.
A white noise system was coded to simulate the noisy environment in the medium. This function makes the model closer to the actual environment. Users can set the strength by clicking “add white noise” box and inputting the decibels.
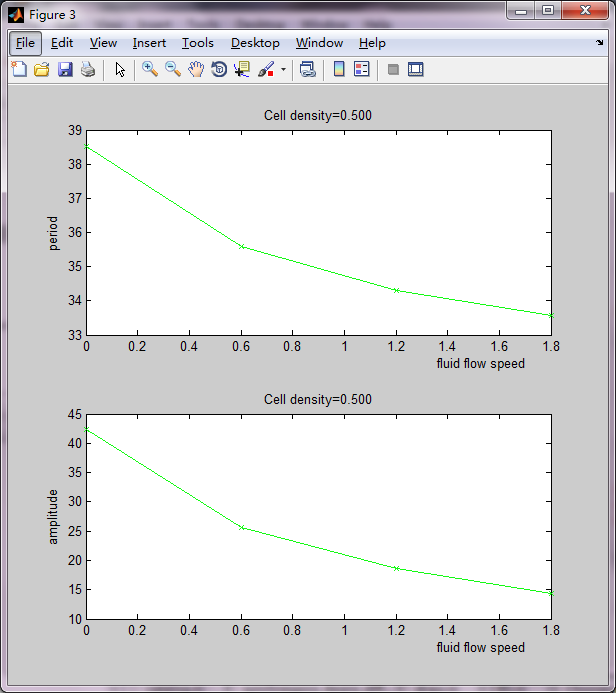
A script calculates amplify and period of the oscillation is also added as an additional function. This allows our software detect and compare the characteristic of certain oscillation.
After setting all the parameters, users can save and output these settings into a standard 2003 excel file through the file menu. Loading is also supported which makes it more convenient for transmitting the parameters.
Before drawing the graphs, users need to choose the plot mode when range parameters exist. For example, when set the cell density the software will ask user to draw separately or put curves with different cell density together.
Then clicking the “Draw” button, the software iterates over the values and plots graphs of all combinations possible for that range of values. After calculating, at most 3 kinds of graphs can be given, (1) concentration alteration of four main protein (2) fluorescence alteration under different cell density and fluid flow speed (3) amplify and period alteration under different cell density and fluid flow speed.
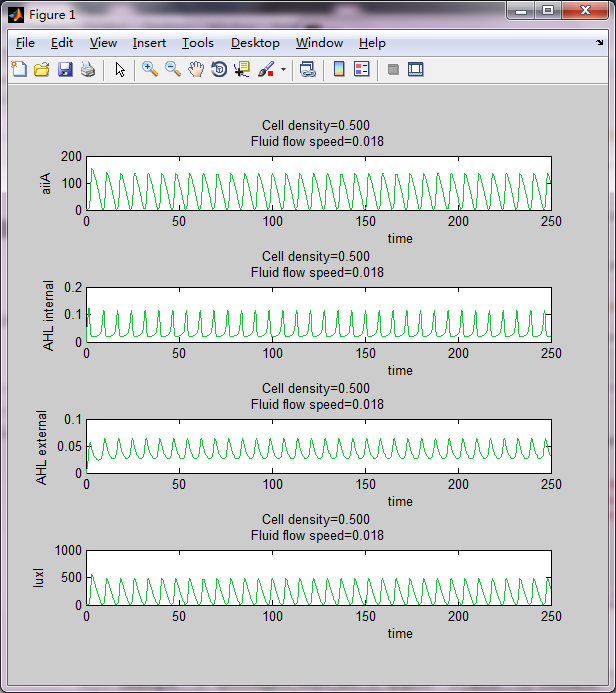
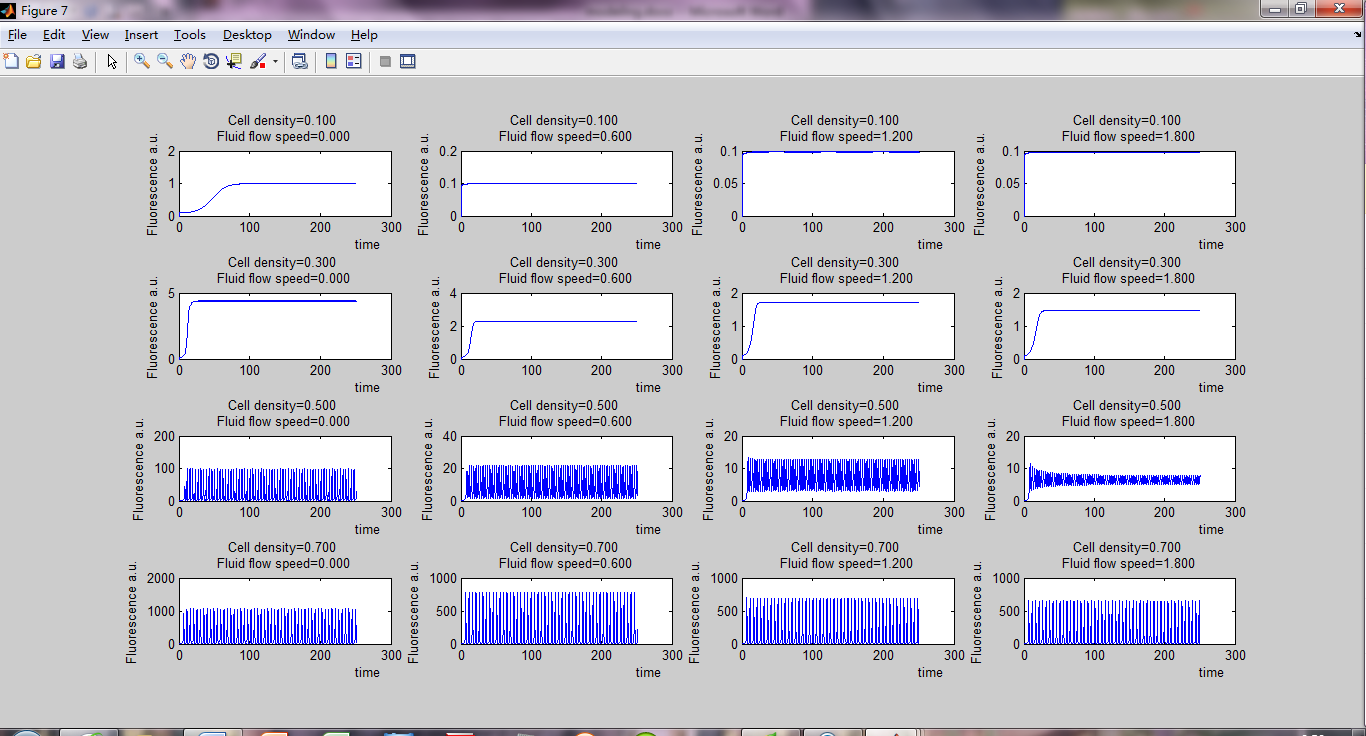
Figure 4 & 5 show some example output of Gene OS.
To protect the software and computer, we designed an error-stop system which could stop the simulation as soon as one error was detected. This system also is called when users click “Cancel” button to stop the calculation. But different with error happened; this stop process takes about 1 min.
The calculation speed of this software depends on the complexity of the parameters. Choosing both cell density range and fluid flow range to calculate can sometimes take more than 10 minutes. It is mainly because the large numbers of nested for-loops in the script and the slowly calculation speed about MATLAB core.
Figure 6 shows some example output of Gene OS.
You can download the MATLAB code here.
Background
We usually got a great number of fluorescent images every time when we finished the 8-hour-long microfluidic experiment. However, to get the data we have to calculate each trap in each image though using the software. What’s worse, the software could only process one image each time. Obviously, a more humanized software is needed if we do not want to spend much time on the manual work.
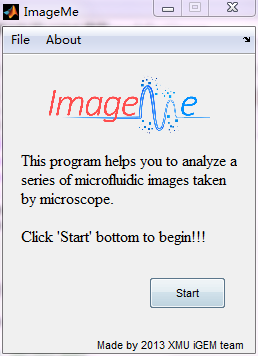
Figure 7 shows the first interface of the ImageMe.
Coding in MATLAB
As we have not found such software on the net, we decided to design our own software. Thus, we used MATLAB coding the script and designed the user interface again for easy use.
We called this one “ImageMe” which was related with our team name. The most advantage of ImageMe is that it can analyze all the traps in the all images once.
Algorithm
Thanks to the powerful image processing ability of MATLAB, the main algorithm is concise and efficient. First ImageMe changes the 256-color image to gray scale image and then uses edge processing to make the edge of each trap easier to detect. This process also reduces the negative effect of the background. The final step is to calculate the total gray level using numerical integration.
Software & function introduction
Comparing with the Gene OS, ImageMe has more concise interface arrangement and easier to use. Click “Start” to enter the main interface.
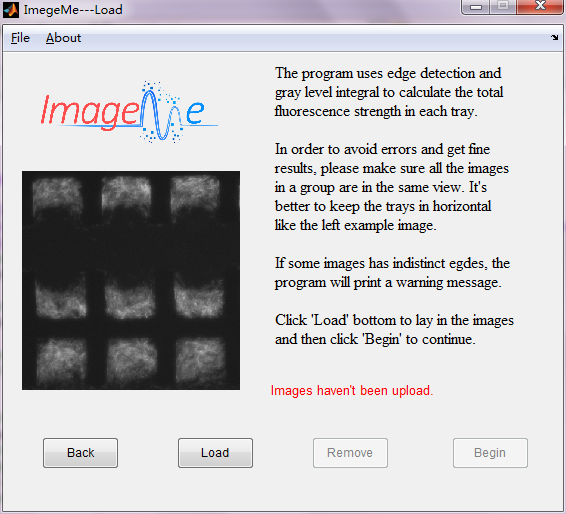
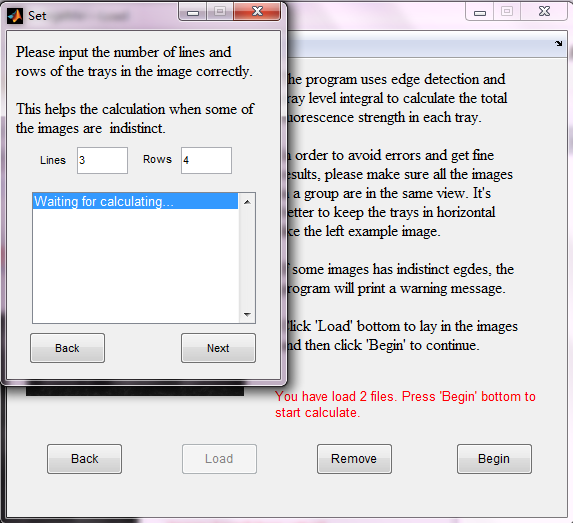
Figure 8 shows the main interface. Figure 9 shows the input dialog box.
This is the main interface of ImageMe. Here, users can load the images by clicking the “Load” button and then choose the images. Then, ImageMe will pre-read all the images with “.jpg” suffix in this root directory. Make sure that no other .jpg images exist in the same folder. Click “Remove” button before changing the images to be analyzed.
After clicking the “Begin” button, ImageMe will ask users to input two parameters (which are also the only two need to input through the whole process) to assist the analysis more correctly. The two parameters are very easy to get comparing with those in Gene OS. First one is the lines of the traps and the second one is the rows. To get correct and precise results, please do not change the view or magnification times while taking images.
It is common that some images are indistinct or the edges are difficult to detect. When these situations occur to one image, ImageMe will use fuzzy calculation to analyze this one and make sure the result has the most correctness.
The real time message will be written on the screen when some indistinct images are detected or some errors happened.
If the analysis finished successfully, the graphs will show on the screen automatically. At most two kinds of graphs can be given, (1) fluorescence strength change in each trap (2) fluorescence strength change in each line.
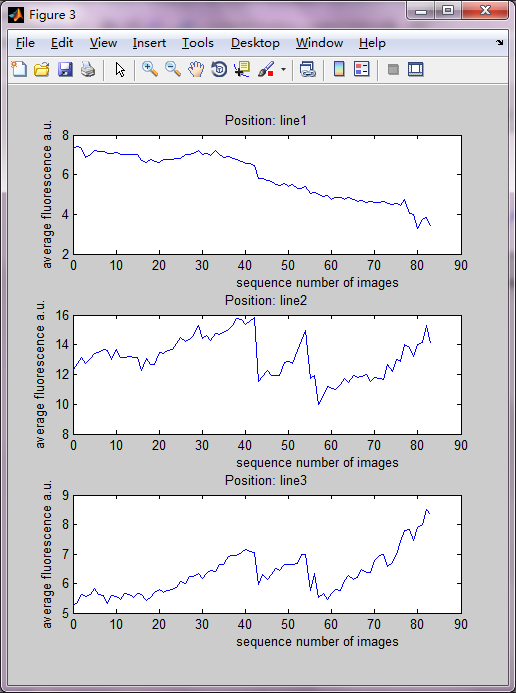
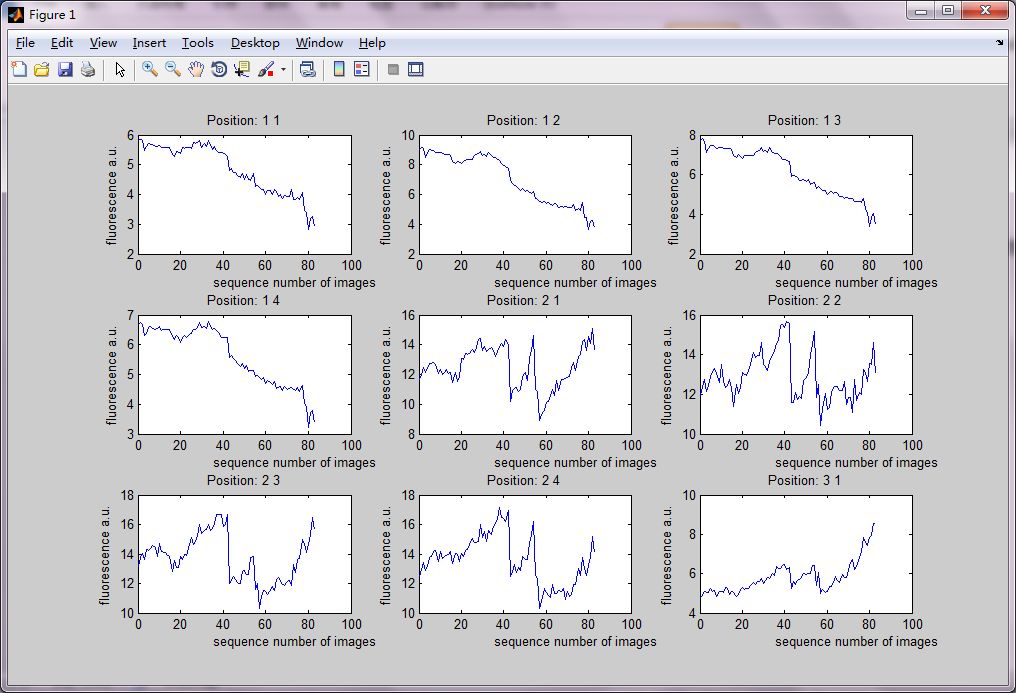
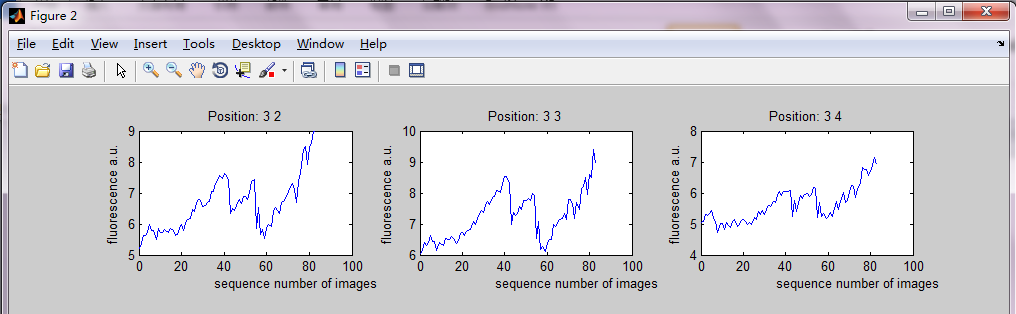
Figure 10 to 12 show the graphs given by ImageMe.
An output function was added to make possible for drawing these graphs through other software. This function generates an excel file including all statistic results about every image and every trap. Thus, users can get the results very easily. The calculation speed of ImageMe depends on the complexity of the images. Too many lines and rows may lead to less correct results and take more time. However, analyze 80 example images (Figure 8, showed in the main interface) takes less than 70 seconds which is fast enough using MATLAB core.
You can download the MATLAB code here. A group of test images is included.
Gene OS: Comparing various results with different cell density
This example illustrates the importance of the cell density by comparing various results with different cell density.
Cell density is been normalized so that it is greater than 0 and less than or equal to 1. Thus we vary the cell density from 0.1 to 0.9 with the step-size 0.25 and keep other parameters the same.
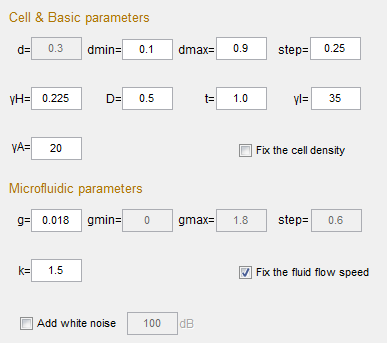
Then, choose “Cell density” and start calculation. From the results we can see that under this specific condition too small or too big cell density all cannot lead to a steady oscillation. Only the cell density near 0.35 gives the expected curve. This is mainly because that cell in small density cannot product enough LuxR, AHL, aiiA & GFP to start the oscillation. This can be confirmed by the little fluorescence strength. While too many cells surely lead to high fluorescence strength and slow mass transfer speed which cover up the oscillation.
Figure 13 shows the whole parameters.
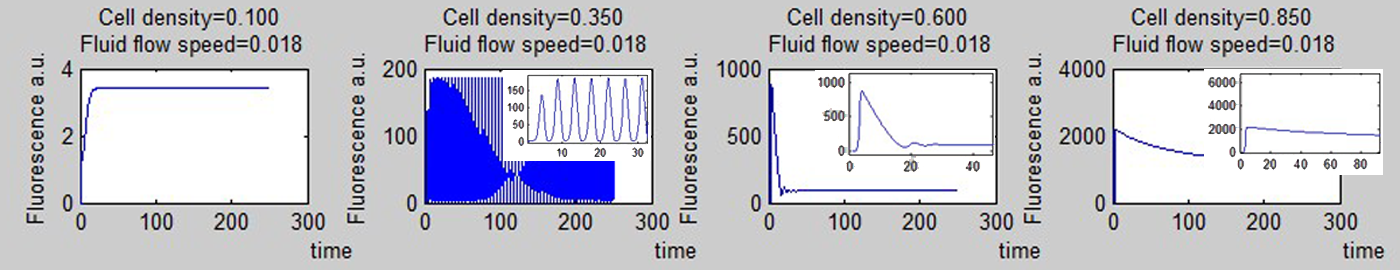
Figure 14
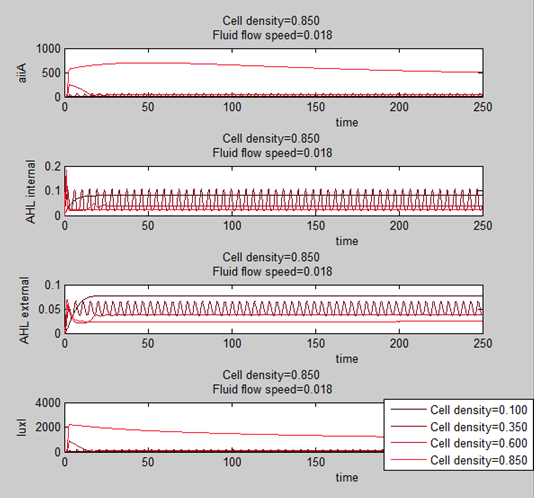
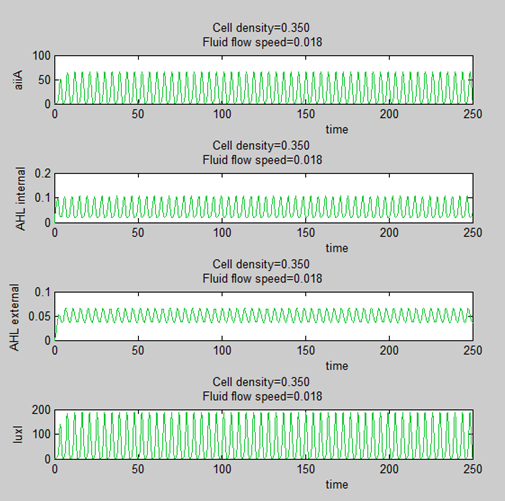
Figure 15 Figure 16
Figure 14 & 15 show the results given by Gene OS. Figure 16 shows the results when cell density equal to 0.35 and choose “Separate all”.
ImageMe: Comparing the results with manual calculation
To confirm the accuracy of ImageMe, we compared the two group results with manual calculated data. Due to the different algorithm, the fluorescence strength is not equal, but the tendency indicated in the each graph is comparable.
First we compare them under the weak fluorescence situation.
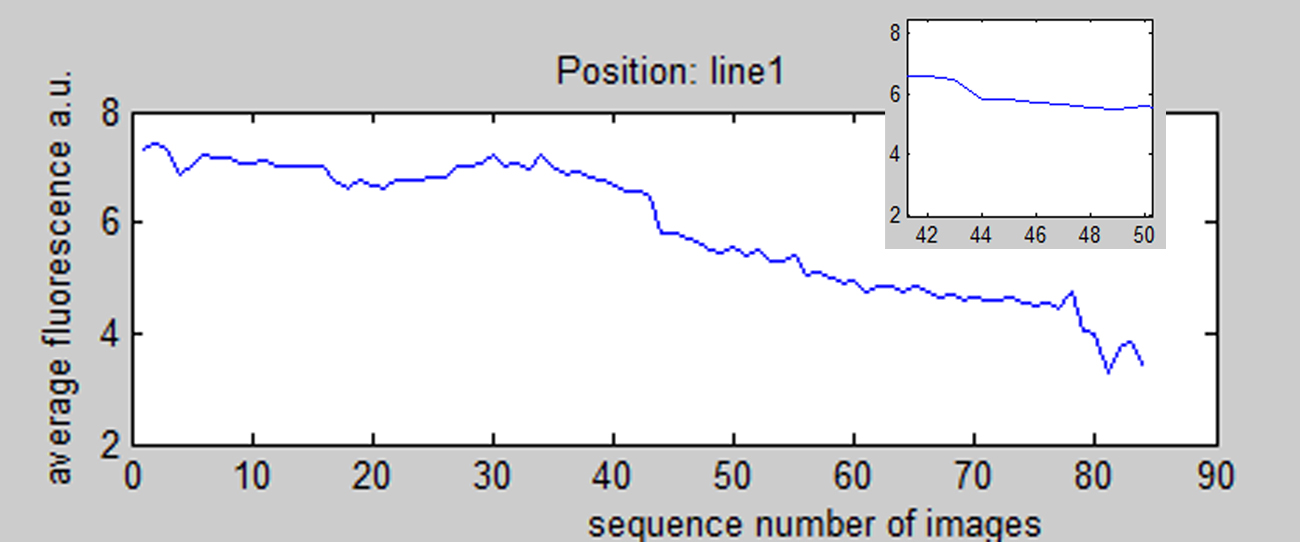
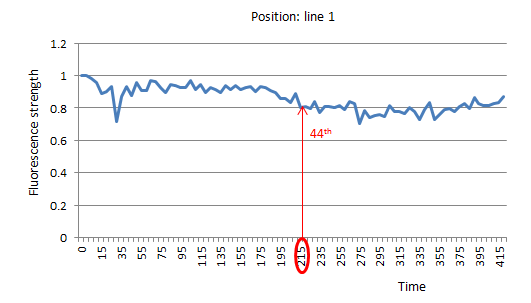
Figure 17 shows the results line 1 given by ImageMe. Figure 18 shows the results of line 1 given by manual calculation.
From above, we can see that the general trend of each graph is both decreasing. However, ImageMe shows that the fluorescence strength of the last image is almost half of the first one while the manual calculation results only indicate a 15 percent decrease. The results are more amazing when we compare the 44th image (middle of the group) and the last one. ImageMe shows a 40 percent decrease while manual calculation results even implies a small increase in the fluorescence strength.
Now we compare these results with some of the images.
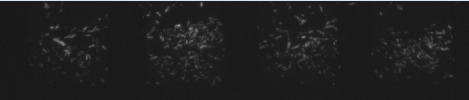
Thus, from these images we can conclude that the fluorescence strength is decreasing significantly from the first one to the last. In addition, it is obviously that fluorescence strength of the last image is less than the middle one which
means a great computation error exists in the manual calculation.

Figure 19 is the first image of line 1 in the group.
Figure 20 is the 44th image of line 1 in the group.
Figure 21 is the 84th (last one) image of line 1 in the group.
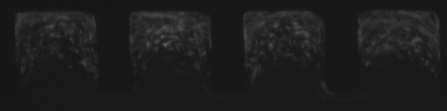
Second, we compare them under the strong fluorescence situation.

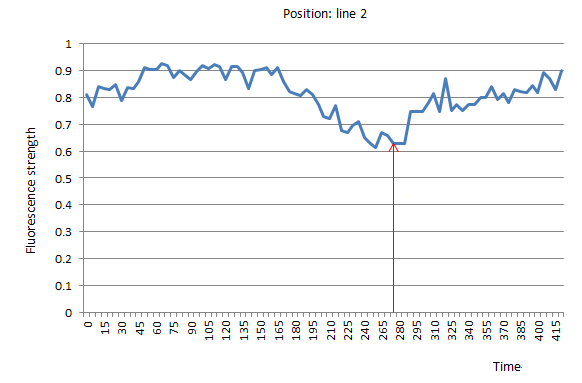
Figure 22 shows the results of line 2 given by ImageMe. Figure 23 shows the results of line 2 given by manual calculation.
In the second group, ImageMe shows a total 13 percent fluorescence strength increase while manual calculation indicates 10 percent. Comparing the 58th image (minimum of fluorescence strength) with the last one, ImageMe shows a 29 percent increase while manual calculation shows 32 percent. From the analysis, we can see the general trends of the two graphs match better than the first group.
Now we compare these results with some of the images again.
We choose the 54th and 58th (time 270 & 290) image because ImageMe shows a strange peak at 54th and a following valley at 58th.
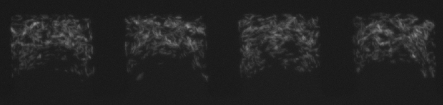
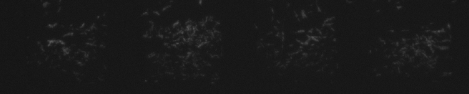
From these images we can observe that the fluorescence strength is increasing a little from the first one to the last. In addition, the fluorescence of 58th seems the weakest in the
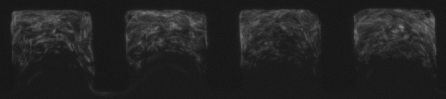
four and the 54th obviously stronger than 58th. This result confirms ImageMe is sbetter again.
Therefore, ImageMe adapts the both situation while manual
calculation has significant computation error when the total fluorescence strength is weak which means only gives reliable results under strong fluorescence.
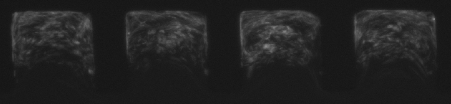
Figure 24 is the first image of line 1 in the group.
Figure 25 is the 54th image of line 1 in the group.
Figure 26 is the 58th image of line 1 in the group.
Figure 27 is the 84th (last one) image of line 1 in the group.