 "
"
Team:USTC-Software
From 2013.igem.org
| Line 72: | Line 72: | ||
<div class="contain"> | <div class="contain"> | ||
| - | |||
<div class="description_l"><img src="https://static.igem.org/mediawiki/2012/2/28/USTC-Software-images-4.png"/></div> | <div class="description_l"><img src="https://static.igem.org/mediawiki/2012/2/28/USTC-Software-images-4.png"/></div> | ||
| Line 86: | Line 85: | ||
<div class="contain"> | <div class="contain"> | ||
| - | |||
<div class="description_l"><img src="https://static.igem.org/mediawiki/2012/2/28/USTC-Software-images-4.png"/></div> | <div class="description_l"><img src="https://static.igem.org/mediawiki/2012/2/28/USTC-Software-images-4.png"/></div> | ||
Revision as of 08:08, 22 August 2013


Welcome to our wiki!
Map
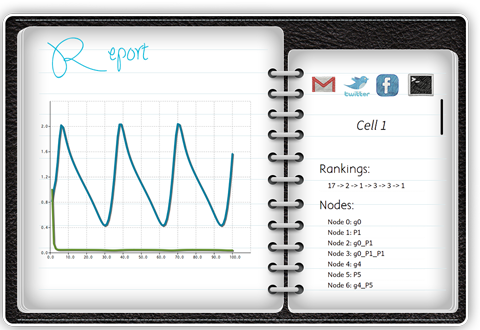
Map is a simple and easy software to visualize your experimental data. Click to import the data and you will get exactly what you want.
Map
Map is a simple and easy software to visualize your experimental data. Click to import the data and you will get exactly what you want.
Console

Console is where you manage heavy computing and complex tasks. With different buttons controlling each parameter, you can optimize the behaviors of the software. We applied evolution algorithm and machine learning techniques in the network inferences to provide the best simulation of your data.
Sand Box

SandBox displays the Genetic Regulatory Networks in a clean and interactive way, with clear connection and 3-D interaction, you will get better understanding of how genes and proteins regulating each other.
Sponsors


