Team:Heidelberg/Template/Del week19 Gibson
From 2013.igem.org
Contents |
02-09-2013
SDS-PAGE of Samples 30-08-2013
Electrophoresis
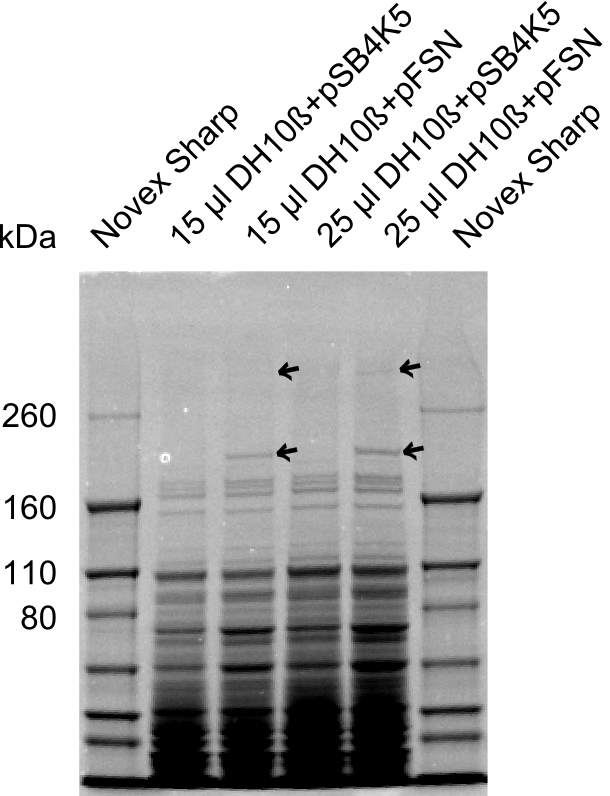
- Applied 15 µl and 25 µl of the sample DH10ß+pSB4K5 and DH10ß+pFSN 30-08-2013 on a SDS-polyacrylamide gel again.
- Let it run for 1 h at 180 V
Staining and destaining procedure
- Gel was stained in Coomassie Brilliant Blue for 1 h on shaker
- Destaining with destaining buffer (50% ddH2O, 40% Methanol, 10% Acetic acid) until bands were visible
Results:
- Bands of about 190 kDa and 350 kDa were visible in the sample DH10ß+pFSN but not DH10ß+pSB4K5. These bands correlate to the proteins DelE (192.52 kDa) and DelG (357.33 kDa). The other proteins which should be expressed by our plasmid could not be detected as there is much background of the proteins of the cells at these heights.
- Still, as the genes DelA, DelB, DelC, DelD and DelF are closer to the promotor as DelG, we suspect that these genes are expressed as well.
 "
"
