Team:Heidelberg/Templates/DelH week16
From 2013.igem.org
Contents |
12-08 - 18-08-13
Increasing Yield of DelH Fragments
PCR Conditions G0.G1/2a.W16.A
| Reagent | G0 | G0 | G0 | G1/2a | G1/2a |
|---|---|---|---|---|---|
| Expected length [Kb] | 18 | 18 | 18 | 13.083 | 13.083 |
| Named | G0 | G0 | G0 | 1 | 1 |
| Template | Picked colony | Picked colony | Picked colony | Picked colony | Picked colony |
| Primer fw 10 µM | 1 µl short2 | 1 µl short2 | 1 µl short2 | 1 µl HM07 | 1 µl HM07 |
| Primer rev 10 µM | 1 µl HM08 | 1 µl HM08 | 1 µl HM08 | 1 µl HM06 | 1 µl HM06 |
| Phusion Flash Ready Mix | 10 µl | 10 µl | 10 µl | 10 µl | 10 µl |
| ddH2O | 5 µl | 5 µl | 5 µl | 5 µl | 5 µl |
| DMSO | 1 µl | 1 µl | 1 µl | 1 µl | 1 µl |
| Cycles | Temperature [°C] | Time [s] |
|---|---|---|
| 1 | 98 | 5 |
| 30 | 98 | 1 |
| 65 | 5 | |
| 72 | 4:45 min | |
| 1 | 72 | 10 min |
| 1 | 12 | inf |
- Lid preheated at 98°C
- No hot start used
Result
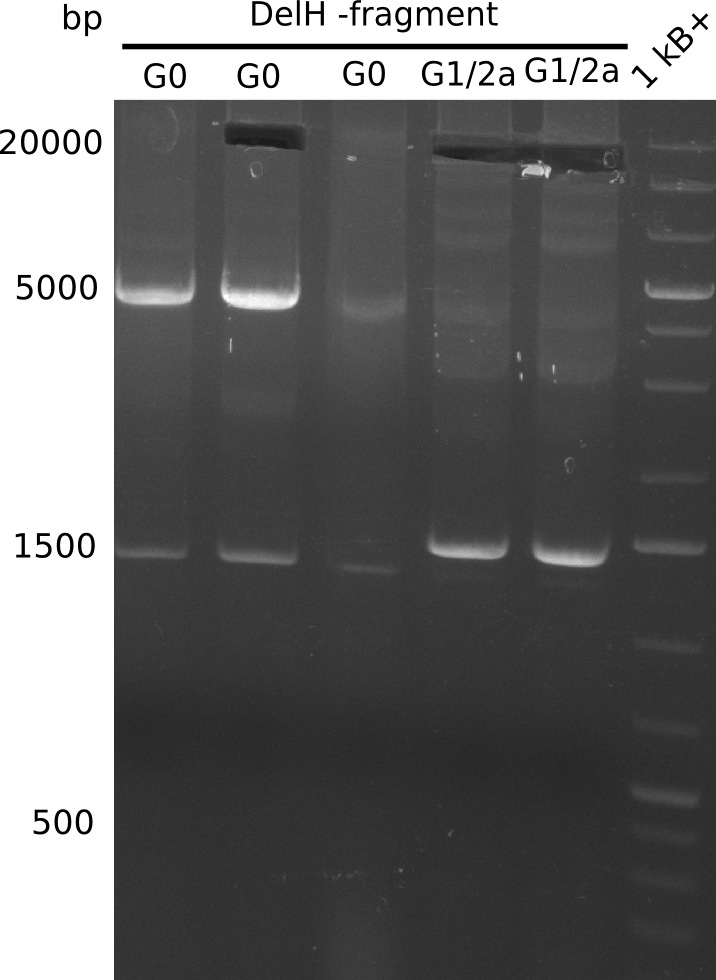
Expected bands: 18 Kb (G0), 13 Kb (G1/2a)
Gel shows expected bands.
- => They were cut and gel isolated.
Generation of Plasmid DelH 11-08
Colony-PCR CP.W16.A
| Reagent | Cells + 1 µl Gibson Assembly | Cells + 14 µl Gibson Assembly | Cells + 14 µl Gibson Assembly (ONLY Backbone) | Cells + 14 µl Gibson Assembly (ONLY Backbone) |
|---|---|---|---|---|
| Expected length [bp] | 663 | 663 | - | - |
| Named | D1 | D14 | B14(1) | B14(2) |
| Primer fw 10 µM | 2 µl VF2 | 2 µl VF2 | 2 µl VF2 | 2 µl VF2 |
| Primer rev 10 µM | 2 µl Screen_delH_rev | 2 µl Screen_delH_rev | 2 µl Screen_delH_rev | 2 µl Screen_delH_rev |
| Dream-Taq Polymerase (2x) | 10 µl | 10 µl | 10 µl | 10 µl |
| ddH2O | 6 µl | 6 µl | 6 µl | 6 µl |
| Cycles | Temperature DelH-G0 [°C] | Time [s] |
|---|---|---|
| 1 | 95 | 120 |
| 12 | 95 | 60 |
| 68 (touchdown -0.5°C) | 30 | |
| 72 | 45 | |
| 18 | 95 | 60 |
| 65 (touchdown -0.5°C) | 30 | |
| 72 | 45 | |
| 1 | 12 | inf |
Result
Expected band: 663 bp

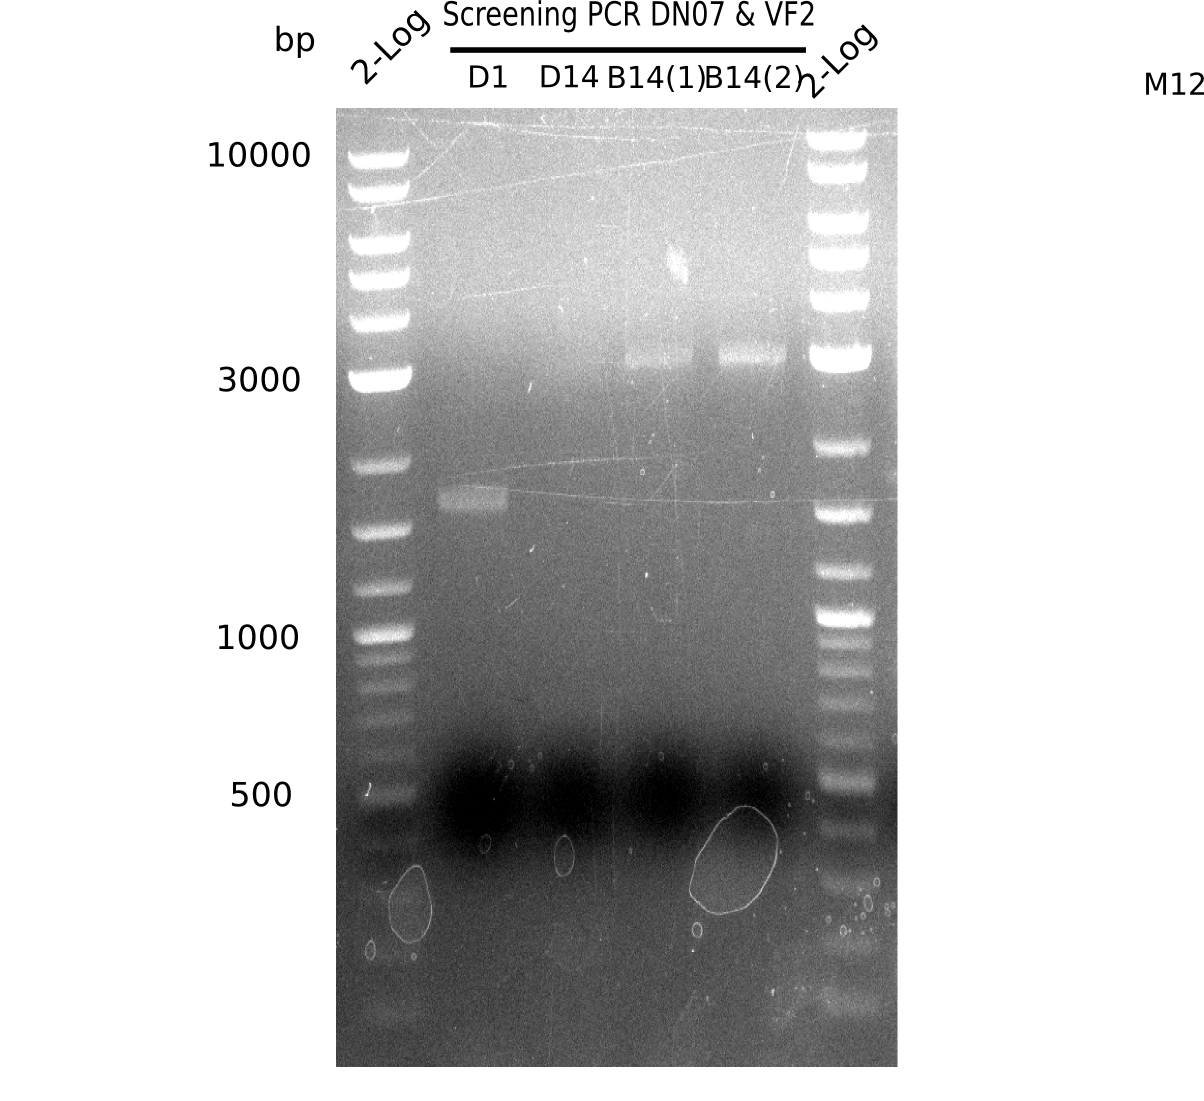
l1: 2log ladder, l2: colony PCR of 1 µl Gibson transformed,l3: colony PCR of 14 µl Gibson transformed,l4-5: 2 colony PCRs of BB - 14 µl Gibson transformed, l6: 2log ladder
none of the colonies is positive, of course the BB shows not the expected band of 663 bp (for screening). The first colony shows a band at ~1.7 kb.
None of the colonies is positive, of course the BB shows not the expected band of 663 bp (for screening). The first colony shows a band at ~1.7 kb.
- => None of the colonies harbours DelH plasmid.
Colony-PCR CP.W16.B
| Reagent | Cells + 10 µl Gibson Assembly pink | Cells + 10 µl Gibson Assembly pink | Cells + 10 µl Gibson Assembly white | Cells + 10 µl Gibson Assembly white |
|---|---|---|---|---|
| Expected length [bp] | 663 | 663 | 663 | 663 |
| Named | A | B | C | D |
| Primer fw 10 µM | 2 µl VF2 | 2 µl VF2 | 2 µl VF2 | 2 µl VF2 |
| Primer rev 10 µM | 2 µl Screen_delH_rev | 2 µl Screen_delH_rev | 2 µl Screen_delH_rev | 2 µl Screen_delH_rev |
| Dream-Taq Polymerase (2x) | 10 µl | 10 µl | 10 µl | 10 µl |
| ddH2O | 6 µl | 6 µl | 6 µl | 6 µl |
| Cycles | Temperature DelH-G0 [°C] | Time [s] |
|---|---|---|
| 1 | 95 | 120 |
| 12 | 95 | 60 |
| 68 (touchdown -0.5°C) | 30 | |
| 72 | 45 | |
| 18 | 95 | 60 |
| 65 (touchdown -0.5 °C) | 30 | |
| 72 | 45 | |
| 1 | 12 | inf |
Result
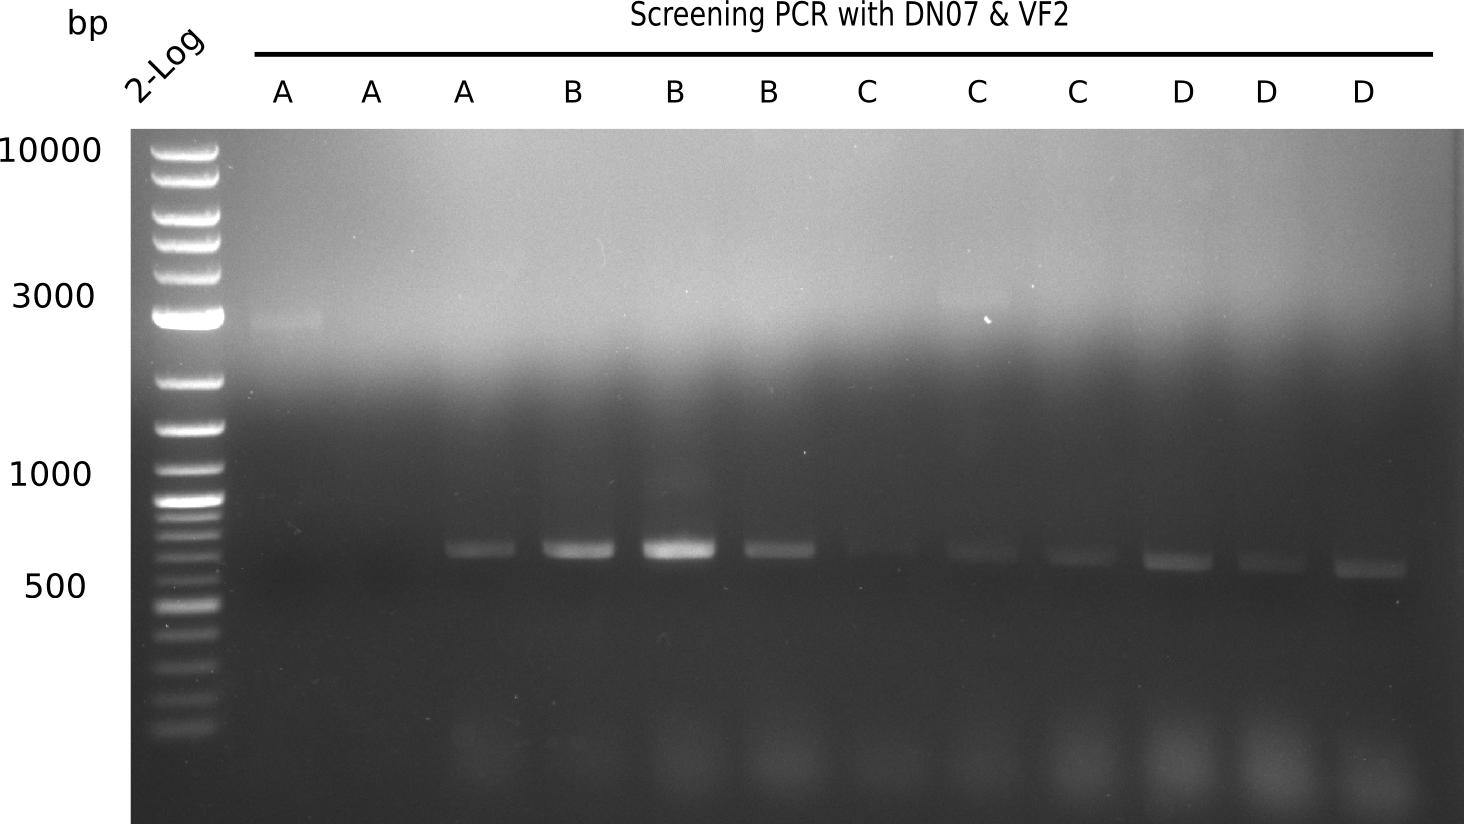
Expected band: 663 bp
Testing of Screening Primers
To test the reverse screening primer DN07 we amplify with the DreamTaqPolymerase and DN11 primer. As template, we use the complete DelH (18 Kb) and the first 3/4 of DelH (14 Kb).
| Reagent | 1 µl G0 of 23-07 | 1 µl G1/2a of 23-07 |
|---|---|---|
| Expected length [bp] | 323 | 323 |
| Named | 0 | 1 |
| Primer fw 10 µM | 2 µl DN11 | 2 µl DN11 |
| Primer rev 10 µM | 2 µl Screen_delH_rev | 2 µl Screen_delH_rev |
| Dream-Taq Polymerase (2x) | 10 µl | 10 µl |
| ddH2O | 5 µl | 5 µl |
| Cycles | Temperature DelH-G0 [°C] | Time [s] |
|---|---|---|
| 1 | 95 | 120 |
| 12 | 95 | 60 |
| 68 (touchdown -0.5°C) | 30 | |
| 72 | 30 | |
| 18 | 95 | 60 |
| 65 (touchdown -0.5°C) | 30 | |
| 72 | 30 | |
| 1 | 12 | inf |
Result
Expected length= 323 bp for positive clones
Gel shows expected bands.
- => Both PCRs were positive. Proof of functionality of DN07 screening primer and that both fragments are the expected DelH fragments.
Amplification of DelH G0
Gradient PCR Conditions G0.W16.B
To improve the PCR of the fragment with the length of 18 Kb, we run a gradient PCR between 68°C and 65°C.
| Reagent | G0 | G0 | G0 | G0 |
|---|---|---|---|---|
| Expected length [Kb] | 18 | 18 | 18 | 18 |
| Named | G0 1 | G0 2 | G0 3 | G0 4 |
| Template | Picked colony | Picked colony | Picked colony | Picked colony |
| Primer fw 10 µM | 2 µl short2 | 2 µl short2 | 2 µl short2 | 2 µl short2 |
| Primer rev 10 µM | 2 µl HM08 | 2 µl HM08 | 2 µl HM08 | 2 µl HM08 |
| Phusion Flash Ready Mix | 10 µl | 10 µl | 10 µl | 10 µl |
| ddH2O | 5 µl | 5 µl | 5 µl | 5 µl |
| DMSO | 1 µl | 1 µl | 1 µl | 1 µl |
| Cycles | Temperature DelH-G0 [°C] | Time [s] |
|---|---|---|
| 1 | 98 | 5 |
| 30 | 98 | 1 |
| 68 - 65 | 5 | |
| 72 | 4:45 min | |
| 1 | 72 | 10 min |
| 1 | 12 | inf |
- Lid preheated at 98°C
- No hot start
Result
Expected band: 18 Kb
Gel does not show expected band.
- => Further optimize PCR conditions.
PCR Conditions G0.W16.C
Because the amplification of DelH GO didn't work yesterday, we try it again with one picked colony and 1 µl of a glycerol stock at a constant annealing temperature of 65°C. 65°C was the temperature on which it worked the last time.
| Reagent | G0 | G0 |
|---|---|---|
| Expected length [Kb] | 18 | 18 |
| Named | G0 1 | G0 2 |
| Template | Picked colony SPH1 | 1 µl of glycerol stock SPH1 |
| Primer fw 10 µM | 2 µl short2 | 2 µl short2 |
| Primer rev 10 µM | 2 µl HM08 | 2 µl HM08 |
| Phusion Flash Ready Mix | 10 µl | 10 µl |
| ddH2O | 5 µl | 4 µl |
| DMSO | 1 µl | 1 µl |
| Cycles | Temperature [°C] | Time [s] |
|---|---|---|
| 1 | 98 | 5 |
| 30 | 98 | 1 |
| 65 | 5 | |
| 72 | 4:45 min | |
| 1 | 72 | 10 min |
| 1 | 12 | inf |
- Lid preheated at 98°C
- No hot start
Result
Expected band: 18 Kb
Gel shows expected band.
- => It was cut and gel extracted. Also, we will run again 3 samples with the same conditions.
PCR Conditions G0.W16.D
| Reagent | G0 | G0 | G0 |
|---|---|---|---|
| Expected length [Kb] | 18 | 18 | 18 |
| Named | G0 1 | G0 2 | G0 2 |
| Template | 1 µl of glycerol stock SPH1 | 1 µl of glycerol stock SPH1 | 1 µl of glycerol stock SPH1 |
| Primer fw 10 µM | 2 µl short2 | 2 µl short2 | 2 µl short2 |
| Primer rev 10 µM | 2 µl HM08 | 2 µl HM08 | 2 µl HM08 |
| Phusion Flash Ready Mix | 10 µl | 10 µl | 10 µl |
| ddH2O | 4 µl | 4 µl | 4 µl |
| DMSO | 1 µl | 1 µl | 1 µl |
| Cycles | Temperature DelH-G0 [°C] | Time [s] |
|---|---|---|
| 1 | 98 | 5 |
| 30 | 98 | 1 |
| 65 | 5 | |
| 72 | 4:45 min | |
| 1 | 72 | 10 min |
| 1 | 12 | inf |
- Lid preheated at 98°C
- No hot start
Result
Expected band: 18 Kb
Gel shows expected fragments.
- => They were cut and gel extracted.
Amplification of DelH G1/2a
Gradient PCR Conditions G1/2a.W16.B
To improve the PCR of the fragment with the length of 18 Kb, we run a gradient PCR between 68°C and 65°C.
| Reagent | G1/2a | G1/2a | G1/2a | G1/2a |
|---|---|---|---|---|
| Expected length [Kb] | 13.083 | 13.083 | 13.083 | 13.083 |
| Named | 1 1 | 1 2 | 1 3 | 1 4 |
| Template | Picked colony | Picked colony | Picked colony | Picked colony |
| Primer fw 10 µM | 2 µl short2 | 2 µl short2 | 2 µl short2 | 2 µl short2 |
| Primer rev 10 µM | 2 µl HM06 | 2 µl HM06 | 2 µl HM06 | 2 µl HM06 |
| Phusion Flash Ready Mix | 10 µl | 10 µl | 10 µl | 10 µl |
| ddH2O | 5 µl | 5 µl | 5 µl | 5 µl |
| DMSO | 1 µl | 1 µl | 1 µl | 1 µl |
| Cycles | Temperature [°C] | Time [s] |
|---|---|---|
| 1 | 98 | 5 |
| 30 | 98 | 1 |
| 68 - 65 | 5 | |
| 72 | 4:45 min | |
| 1 | 72 | 10 min |
| 1 | 12 | inf |
- Lid preheated at 98°C
- No hot start
Result
Expected band: 13 Kb
Gel shows expected band of G1/2a, but also additional uspecific bands.
- => Fragment was cut and gel extracted.
Generation of Plasmid DelH 17-08
Electroporation
Remaining Gibson mix from 01.08 was electroporated.
Colony-PCR CP.W16.B
5 colony per PCR tube (but in different LB Amp Eppis)
| Reagent | Electroporation from 17-08 10 µl | Electroporation from 17-08 100 µl |
|---|---|---|
| Expected length [bp] | 663 | 663 |
| Named | 1 - 2 | 3 - 12 |
| Template | 2 colonies of 10 µl | 10 colonies of 100 µl |
| Primer fw 10 µM | 1 µl VF2 | 1 µl VF2 |
| Primer rev 10 µM | 1 µl Screen_delH_rev | 1 µl Screen_delH_rev |
| Dream-Taq Polymerase (2x) | 10 µl | 10 µl |
| ddH2O | 8 µl | 8 µl |
| Cycles | Temperature [°C] | Time [s] |
|---|---|---|
| 1 | 95 | 120 |
| 12 | 95 | 60 |
| 68 (touchdown -0.5°C) | 30 | |
| 72 | 45 | |
| 18 | 95 | 60 |
| 65 (touchdown -0.5°C) | 30 | |
| 72 | 45 | |
| 1 | 12 | inf |
Result
Expected band: 663 bp

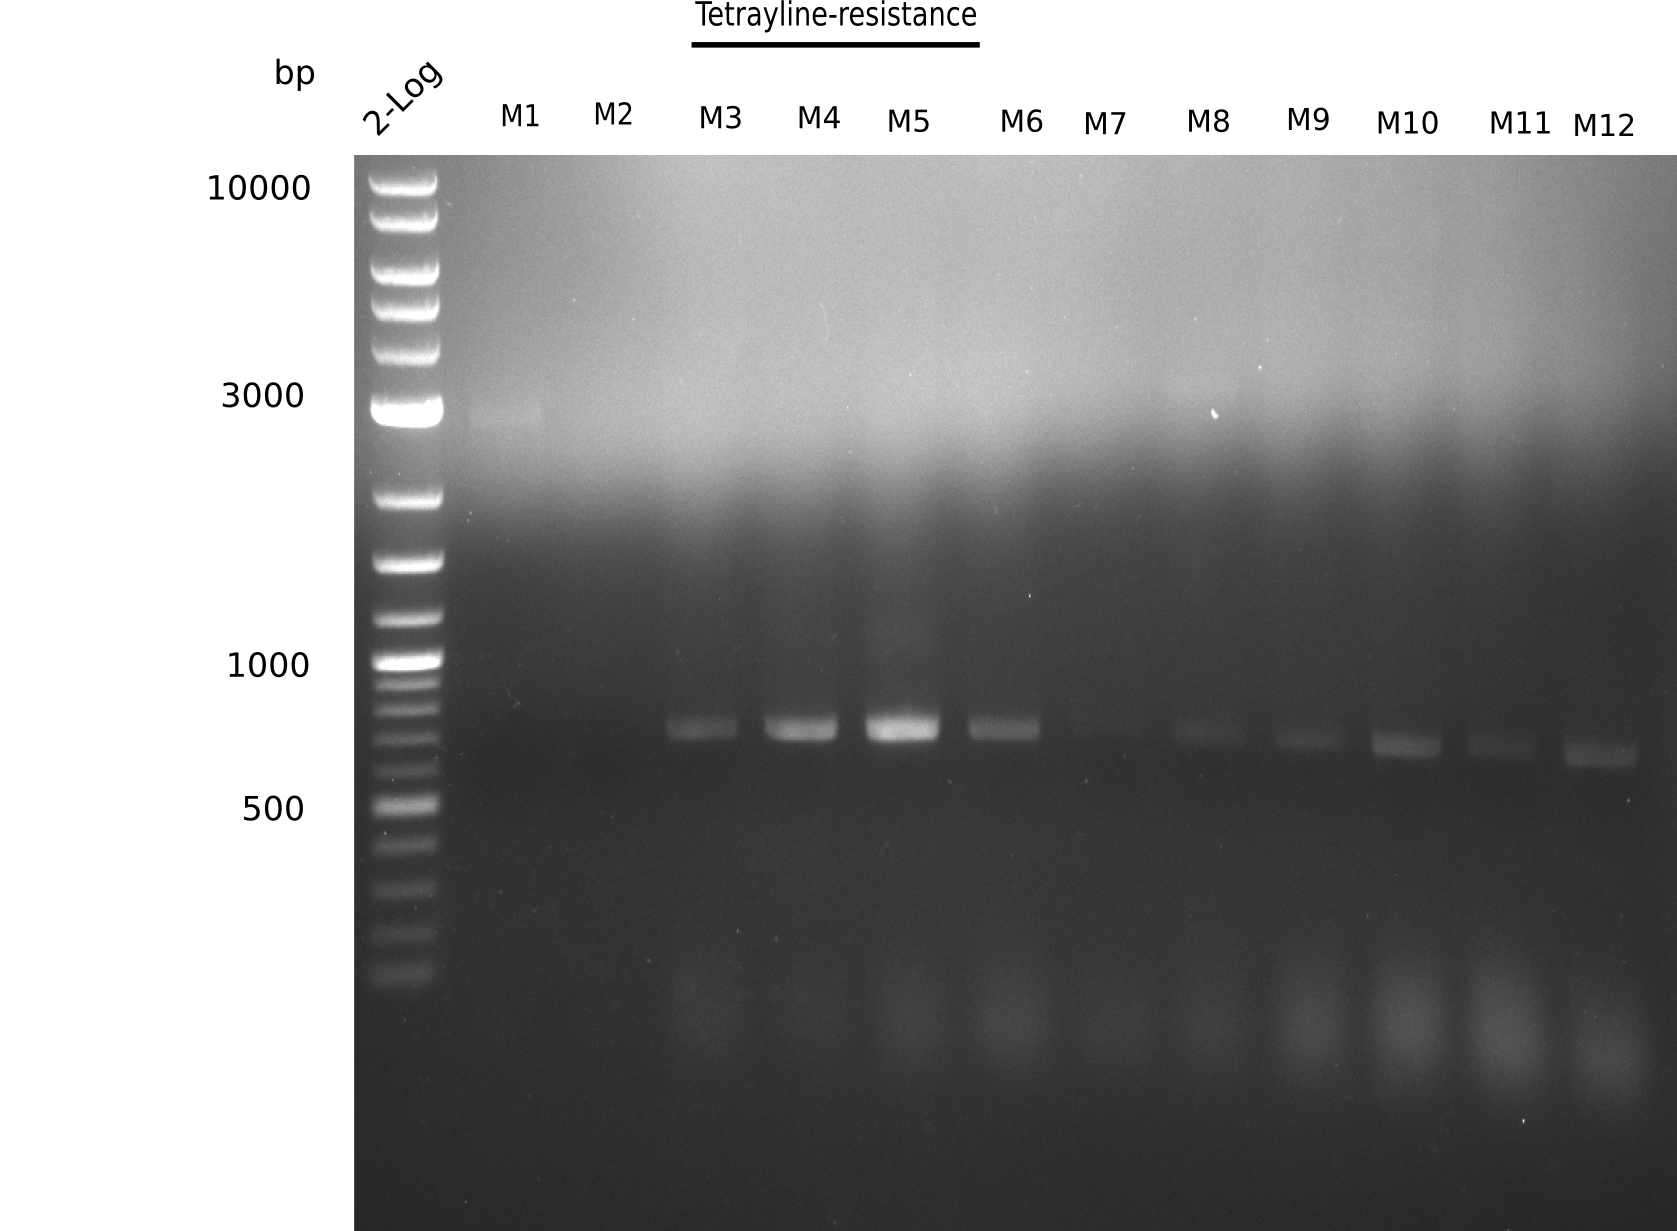
l1: 2log ladder, l2: 1, l3: 2, l4: 3, l5: 4, l6: 5, l7: 6, l8: 7, l9: 8, l10: 9, l11: 10, l12: 11, l13: 12
l4-13 show expected band = positive?
Majority of colonies show expected band.
- => Grow ON, perform mini prep and test digests as well as PCRs of fragments from isolated DNA.
 "
"


