Team:Heidelberg/Templates/DelH week2
From 2013.igem.org
Contents |
06-05 - 12-05-13
Amplification of BioBricks
Miniprep of BioBricks
- Miniprep was performed using Qiagen kit and eluted in 35 µl ddH2O.
- From 500 µl of liquid culture, a glycerol stock was prepared as described in Preparing glycerol stocks.
Result
- DNA concentration was determined using nanovue.
| Sample | Concentration [ng/µl] |
|---|---|
| pSB4K5 | 21 |
| pSB6A1 | 47 |
| lacZ | 45 |
| pSB1C3 | 23 |
Generation of Plasmid Backbones
Restriction Digest of BioBrick pSB6A1
| Component | Amount [µl] |
|---|---|
| PSB6A1 DNA | 32.5 |
| BSA (10x) | 5 |
| NEB2 buffer (10x) | 5 |
| Enzymes (EcoRI-HF and PstI) | 1.5 each |
| ddH2O | 4.5 |
Result
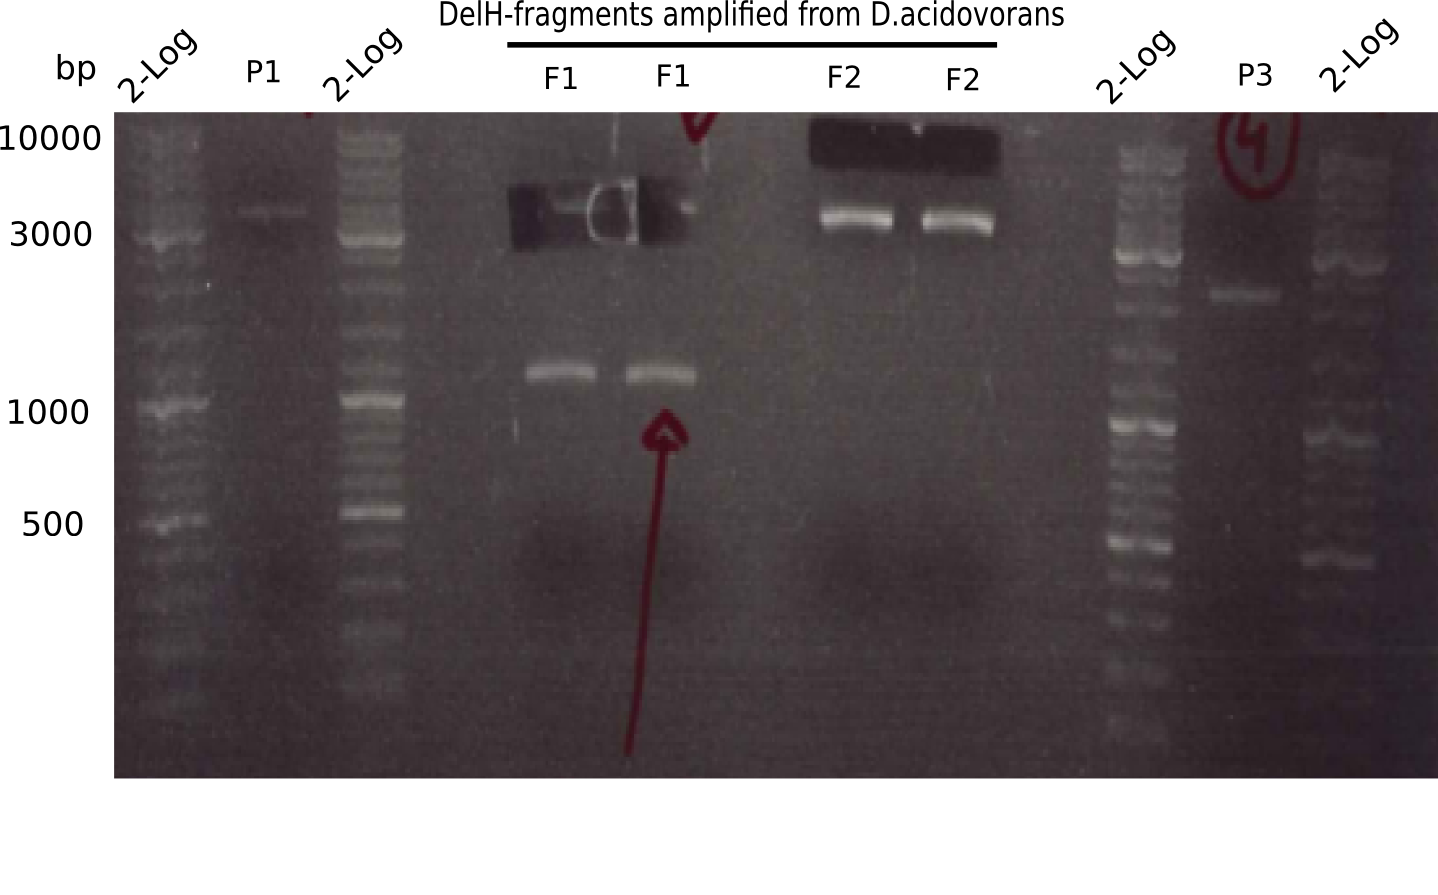
The fragments of plasmids pSB4K5 and pSB1C3 show the expected pattern.
- => BioBrick backbone was cut and gel isolated.
Generation of LacZ Fragment
Restriction Digest of BioBrick pSB1AK3 Conditions A
| Component | Amount [µl] |
|---|---|
| pSB1AK3 DNA | 32.5 |
| BSA (10x) | 5 |
| NEB3 buffer (10x) | 5 |
| Enzymes (XbaI and PstI) | 1.5 each |
| ddH2O | 4.5 |
- Incubation for 1 h at 37°C
Result
- The restriction mix was loaded onto a 1% agarose gel using 6 µl gene ruler marker.
The fragments show the expected pattern.
- => LacZ insert were cut and gel isolated.
Restriction Digest of BioBrick K173004(lacZ) Conditions B
| Component | Amount [µl] |
|---|---|
| pSB1AK3 DNA | 8.3 |
| BSA (10x) | 5 |
| NEB4 buffer (10x) | 5 |
| Enzymes (XbaI & SalI-HF) | 1.5 each |
| ddH2O | 28.7 |
- Purification was performed with Qiagen Nucleotide removal Kit and eluted in 38.5 µl ddH2O
Result
2.5 µl were measured with the Nanovue. The measurement proved the failure of miniprep.
Restriction Digest of BioBrick K173004(lacZ) Conditions C
| Component | Amount [µl] |
|---|---|
| pSB1AK3 DNA | 32.5 |
| BSA (10x) | 5 |
| NEB 3 buffer (10x) | 5 |
| Enzyme (PstI) | 1.5 |
| ddH2O | - |
Result
- =>The band was too high on gel and discarded, because we cannot be sure if it really is lacZ or the backbone of the lacZ plasmid.
Generation of AraC Fragment
Amplification of BioBricks containing I13453 and K206000
- The transformation was performed as described on 03-05 and incubated ON at 37°.
Amplification of DelH F1
PCR Conditions F1.W2.A
| Reagent | DelH F1 | DelH F1 |
|---|---|---|
| Expected length [Kb] | 10 | 10 |
| Template | 1 µl D. acidovorans glycerol stock | 1 µl D. acidovorans DNA |
| Primer 100 µM fw | 0.5 µl DelH_f1_PacI_fw | 0.5 µl DelH_f1_PacI_fw |
| Primer 100 µM rev | 0.5 µl DelH_f1_SalI_rev | 0.5 µl DelH_f1_SalI_rev |
| Phusion Master Mix (2x) | 25 µl | 25 µl |
| ddH2O | 23 µl | 23 µl |
| Cycles | Temperature [°C] | Time [s] |
|---|---|---|
| 1 | 98 | 10 |
| 16 | 98 | 1 |
| 66(↓0.5°C) | 5 | |
| 72 | 3:40 min | |
| 14 | 98 | 1 |
| 62 | 5 | |
| 72 | 3:40 min | |
| 1 | 72 | 5 min |
| 1 | 4 | inf |
Result
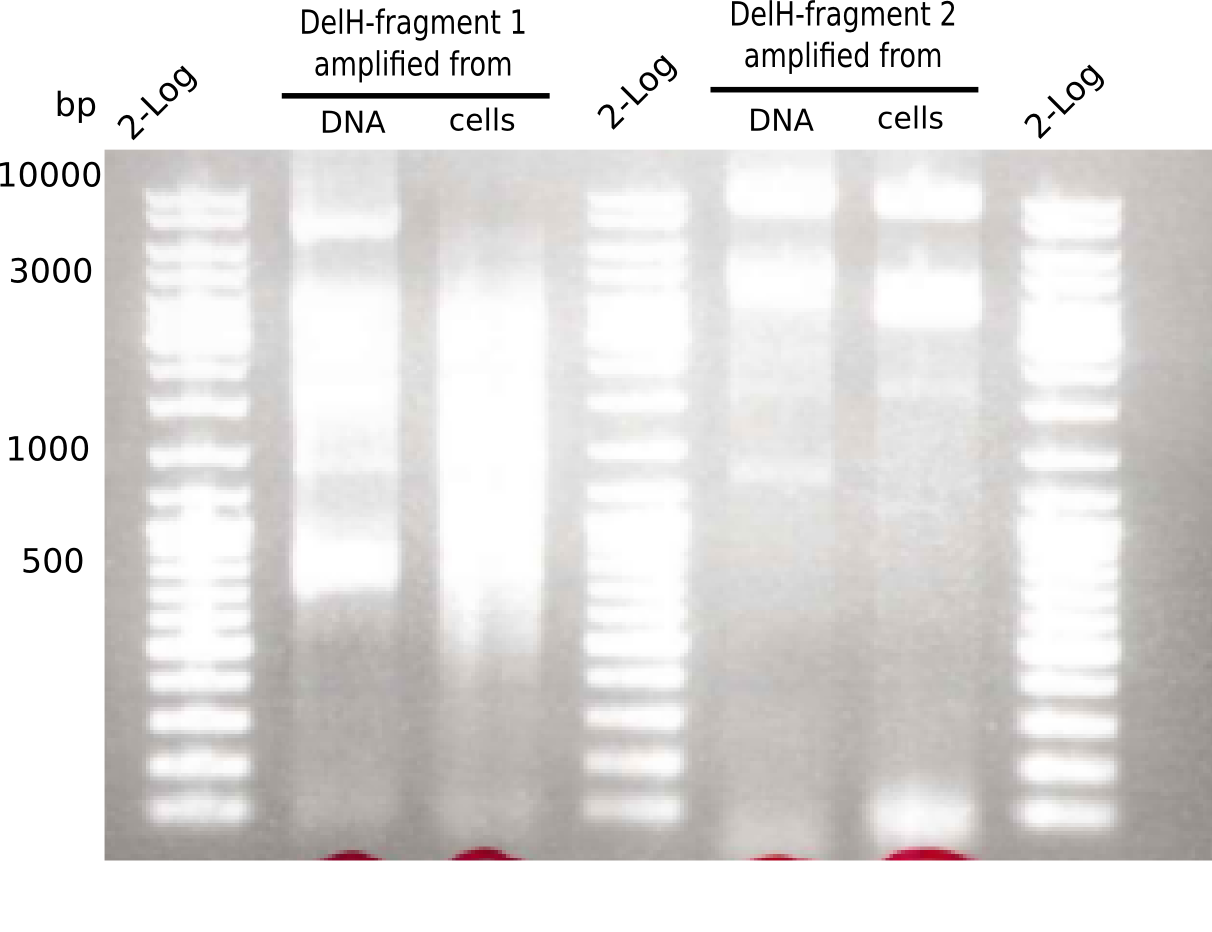
Expected band: 10 Kb
Different unspecific bands were observed.
- => Further optimize PCR conditions.
PCR Conditions F1.W2.B
| Reagent | DelH-fragment1 | DelH-fragment1 |
|---|---|---|
| Expected length [Kb] | 10 | 10 |
| Template | 1 µl D. acidovorans glycerol stock | 1 µl D. acidovorans DNA |
| Primer 100 µM fw | 0.5 µl DelH_f1_PacI_fw | 0.5 µl DelH_f1_PacI_fw |
| Primer 100 µM rev | 0.5 µl DelH_f1_SalI_rev | 0.5 µl DelH_f1_SalI_rev |
| Phusion Master Mix (2x) | 25 µl | 25 µl |
| ddH2O | 23 µl | 23 µl |
| Cycles | Temperature [°C] | Time [s] |
|---|---|---|
| 1 | 98 | 10 |
| 30 | 98 | 1 |
| 72 | 2:45 min | |
| 1 | 72 | 5 min |
| 1 | 4 | inf |
Result
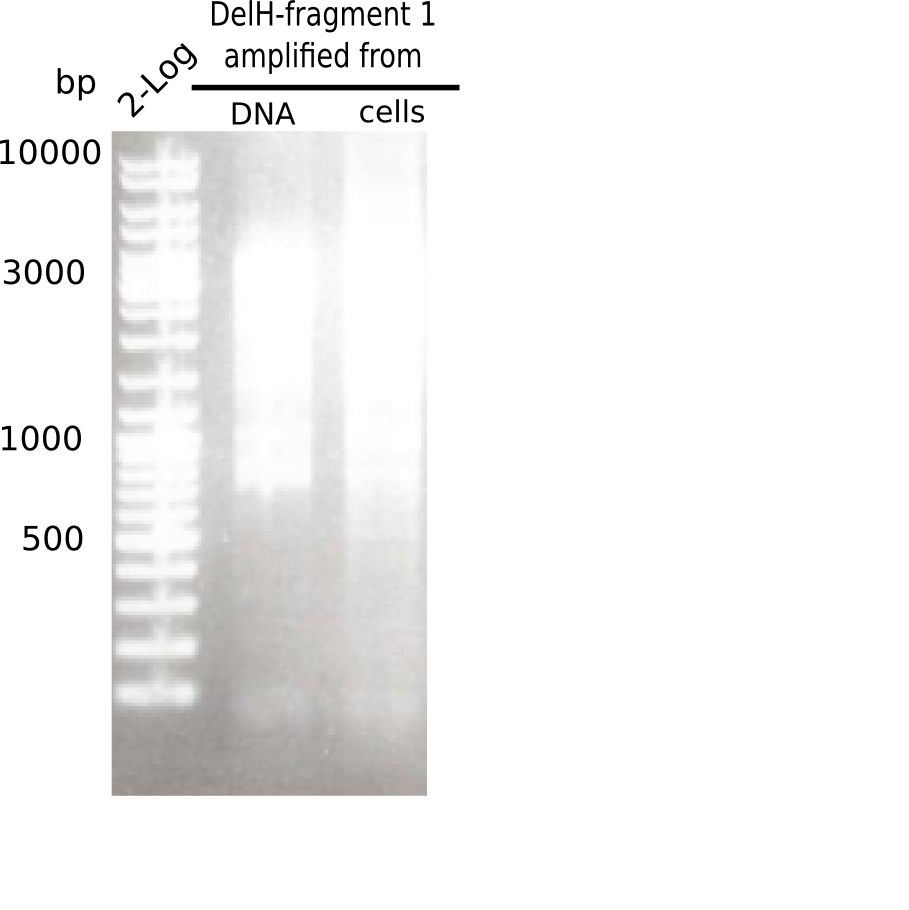
PCRs showed only unspecific bands.
- => Further optimize PCR conditions.
PCR Conditions F1.W2.C
| Reagent | DelH F1 | DelH F1 | DelH F1 | DelH F1 |
|---|---|---|---|---|
| Expected length [Kb] | 10 | 10 | 10 | 10 |
| Template | 1 µl D. acidovorans normal | 1 µl D. acidovorans normal | 1 µl D. acidovorans 1:25 | 1 µl D. acidovorans 1:25 |
| DelH_f1_PacI_fw | 0.5 µl normal | 0.5 µl 1:10 | 0.5 µl normal | 0.5 µl 1:10 |
| DelH_f1_SalI_rev | 0.5 µl normal | 0.5 µl 1:10 | 0.5 µl normal | 0.5 µl 1:10 |
| Phusion Master Mix (2x) | 25 µl | 25 µl | 25 µl | 25 µl |
| DMSO | - | - | 2.5 µl | 2.5 µl |
| ddH2O | 23 µl | 23 µl | 20.5 µl | 20.5 µl |
| Cycles | Temperature [°C] | Time [s] |
|---|---|---|
| 1 | 98 | 10 |
| 16 | 98 | 1 |
| 62 | 5 | |
| 72 | 2:45 min | |
| 1 | 72 | 5 min |
| 1 | 4 | inf |
Result
PCR with DMSO and 1:10 diluted primer looked best.
- => Gel extraction performed.
Amplification of DelH F2
PCR Conditions F2.W2.A
| Reagent | DelH F2 | DelH F2 |
|---|---|---|
| Expected length [Kb] | 8 | 8 |
| Template | 1 µl D. acidovorans glycerol stock | 1 µl D. acidovorans DNA |
| Primer 100 µM fw | 0.5 µl DelH_f2_SalI_fw | 0.5 µl DelH_f2_SalI_fw |
| Primer 100 µM rev | 0.5 µl DelH_f2_KpnI_rev | 0.5 µl DelH_f2_KpnI_rev |
| Phusion Master Mix (2x) | 25 µl | 25 µl |
| ddH2O | 23 µl | 23 µl |
| Cycles | Temperature [°C] | Time [s] |
|---|---|---|
| 1 | 98 | 10 |
| 16 | 98 | 1 |
| 66(↓0.5°C) | 5 | |
| 72 | 3:40 min | |
| 14 | 98 | 1 s |
| 62 | 5 s | |
| 72 | 3:40 min | |
| 1 | 72 | 5 min |
| 1 | 4 | inf |
Result
Expected band: 8 Kb
Different unspecific bands were observed.
- => Further optimize PCR conditions.
PCR Conditions F2.W2.B
| Reagent | DelH F2 | DelH F2 |
|---|---|---|
| Expected length [Kb] | 8 | 8 |
| Template | 1 µl D. acidovorans glycerol stock | 1 µl D. acidovorans DNA |
| Primer 100 µM fw | 0.5 µl DelH_f2_SalI_fw | 0.5 µl DelH_f2_SalI_fw |
| Primer 100 µM rev | 0.5 µl DelH_f2_KpnI_rev | 0.5 µl DelH_f2_KpnI_rev |
| Phusion Master Mix (2x) | 25 µl | 25 µl |
| ddH2O | 23 µl | 23 µl |
| Cycles | Temperature [°C] | Time [s] |
|---|---|---|
| 1 | 98 | 10 |
| 30 | 98 | 1 s |
| 72 | 2:45 min | |
| 1 | 72 | 5 min |
| 1 | 4 | inf |
Results
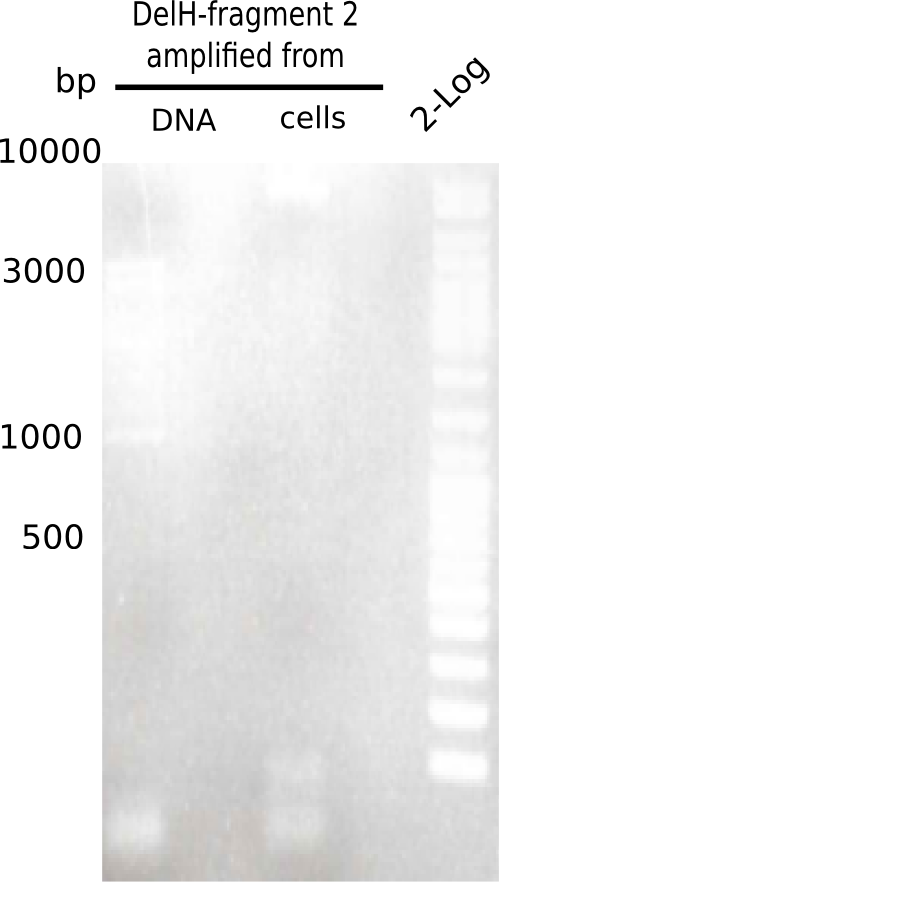
Expected band: 8 Kb
Gel shows the expected specific band at 8 Kb.
- => DelH F2 was thus successfully amplified from the glycerol stock.
 "
"


