Team:Heidelberg/Templates/DelH week6
From 2013.igem.org
03-06 - 09-06-13
Generation of DelH plasmid pHM01
Elongation-PCR Conditions BB.W6.A
The restriction sites were added to pSB6A1-AraC-lacZ via PCR.
| Reagent | pSB6A1-AraC-lacZ |
|---|---|
| Expected length [Kb] | 7.4 |
| Template | 1 µl of 1:10 pSB6A1-AraC-lacZ miniprep |
| Primer fw 10 µM | DN05 |
| Primer rev 10 µM | DN06 |
| Phusion Master Mix (2x) | 25 µl |
| DMSO | - |
| ddH2O | 23 µl |
| Cycles | Temperature [°C] | Time [s] |
|---|---|---|
| 1 | 98 | 10 |
| 14 | 98 | 1 |
| 66↓ | 5 | |
| 72 | 2:00 min | |
| 16 | 98 | 1 |
| 66 | 5 s | |
| 72 | 2:00 min | |
| 1 | 72 | 2:30 min |
| 1 | 4 | inf |
Result
Expected band: 7.4 Kb
Gel shows expected band.
- => Band was cut and gel extracted.
Test Restriction Digest
Isolated fragment was test digested to confirm identity.
| Sample | Concentration [ng/µl] | Volume for digest [µl] | Enzyme [µl] | Buffer [µl] | ddH2O [µl] | Final volume [µl] |
|---|---|---|---|---|---|---|
| pSB6A1-AraC-lacZ | 99 | 5 | 1.5 EcoRI-HF & 1.5 PstI | 5 NEB2 & 5 BSA | 32 | 50 |
- The test digest was incubated 1 h at 37°C.
Result
Expected band: ~4 Kb & 3.4 Kb
Gel shows expected band.
- => Backbone is fine.
Restriction Digest of pSB6A1-AraC-lacZ for Ligation
| Sample | Concentration [ng/µl] | Volume for digest [µl] | Enzyme [µl] | Buffer [µl] | ddH2O [µl] | Final volume [µl] |
|---|---|---|---|---|---|---|
| pSB6A1-AraC-lacZ | 99 | 12.5 | 1.5 KpnI-HF & 1.5 PacI | 5 NEB4 & 5 BSA | 24.5 | 50 |
Restriction Digest was purified with Qiagen nucleotide removal kit.
Result
c=24 ng/µl
Restriction Digest of DelH F1a for Ligation
| Sample | Concentration [ng/µl] | Volume for digest [µl] | Enzyme [µl] | Buffer [µl] | ddH2O [µl] | Final volume [µl] |
|---|---|---|---|---|---|---|
| DelH F1a | ? | 25 | 1.5 EcoRI-HF & 1.5 PacI | 5 NEB4 & 5 BSA | 12 | 50 |
Restriction Digest was purified with Qiagen nucleotide removal kit.
Result
c=9 ng/µl
Restriction Digest of DelH F1b for Ligation
| Sample | Volume for digest [µl] | Enzyme [µl] | Buffer [µl] | ddH2O [µl] | Final volume [µl] |
|---|---|---|---|---|---|
| DelH F1b | 25 | 1.5 EcoRI-HF & 1.5 SalI-HF | 5 NEB4 & 5 BSA | 12 | 50 |
Restriction Digest was purified with Qiagen nucleotide removal kit.
Result
c=19 ng/µl
Restriction Digest of DelH F2 for Ligation
| Sample | Volume for digest [µl] | Enzyme [µl] | Buffer [µl] | ddH2O [µl] | Final volume [µl] |
|---|---|---|---|---|---|
| DelH F2 | 25 | 1.5 KpnI-HF & 1.5 SalI-HF | 5 NEB4 & 5 BSA | 12 | 50 |
Restriction Digest was purified with Qiagen nucleotide removal kit.
Result
c=9 ng/µl
Ligation of pHM01:DelH-pSB6A1-AraC-lacZ
Ligations was performed of all 4 fragments (digested and purified) for 1 h at RT in 2 different mixes.
| Sample | Concentration [ng/µl] | Volume for Ligation [µl] |
|---|---|---|
| pSB6A1-AraC-lacZ | 24 | 2 |
| DelH F1a | 9 | 6 |
| DelH F1b | 19 | 3 |
| DelH F2 | 9 | 6 |
| T4 ligase | - | 1 |
| Buffer | - | 2 |
| ddH2O | - | - |
| Final volume | - | 20 |
- The ligase was inactivated by heat shock for 5 min at 70°C.
- The reaction mix was purified with Qiagen nucleotide removal.
Result
| Sample | Concentration [ng/µl] |
|---|---|
| 1 | 20 |
| 2 | 30 |
Electroporation
Two electroporations were performed.
- 20 ng
- 30 ng
- After an incubation time of 1 h in SOC-medium, cells were centrifuged and 10 µl plated on one LB Amp plate (with Arabinos and X-Gal) and 100 µl on another plate prepared with the same conditions.
- Plates were incubated ON at 37°C.
Result
White colonies grew on the plates.
Colony PCR
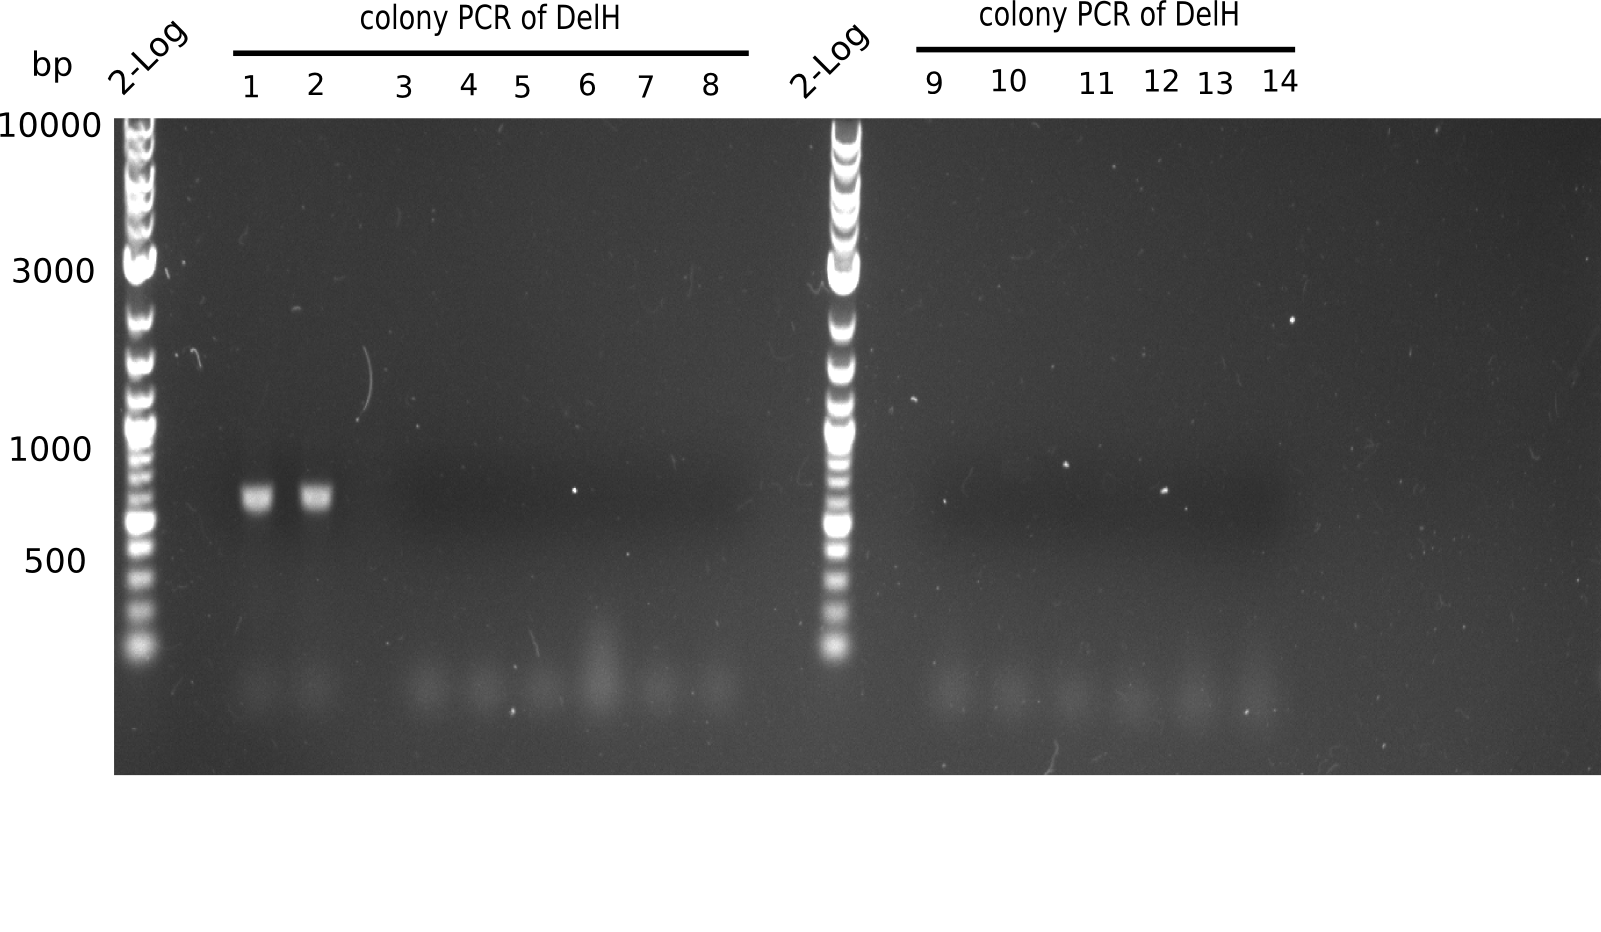
6 colonies of plate E1 (colonies 1-6) and 6 colonies of plate E2 (7-12) as well as ligation mixes 1 & 2 were checked by PCR.
| Reagent | DelH colonies |
|---|---|
| Expected length [bp] | 663 |
| Primer fw 10 µM | 2 µl VF2 |
| Primer rev 10 µM | 2 µl DN07 |
| Taq Polymerase (2x) | 10 µl |
| ddH2O | 6 µl |
| Cycles | Temperature [°C] | Time |
|---|---|---|
| 1 | 95 | 120 |
| 12 | 95 | 60 |
| 66 (touchdown -0.5°C) | 30 | |
| 72 | 45 | |
| 18 | 95 | 60 |
| 62 (touchdown -0.5°C) | 30 | |
| 72 | 45 | |
| 1 | 12 | inf |
Result
Expected length: 663 bp.
None of the colonies shows a band. Ligation mixes 1 and 2 show the expected band at ~600 bp.
- => The ligation worked, but none of the correct plasmids were present in the analyzed colinies.
 "
"

