Team:Heidelberg/Templates/DelH week8
From 2013.igem.org
Contents |
17-06 - 23-06-13
Amplification of DelH F1a
Elongation-PCR Conditions F1a.W8.A
| Reagent | Amount [µl] |
|---|---|
| Expected length [bp] | 5 |
| Template | 1 µl PCR-product (16-06) |
| Primer 10 µM fw | 2.5 µl DelH_f1_PacI_fw |
| Primer 10 µM rev | 2,5 µl DelH_EcoRI_rev |
| Phusion Master Mix (2x) | 25 µl |
| ddH2O | 19 µl |
| Cycles | Temperature [°C] | Time [s] |
|---|---|---|
| 1 | 98 | 30 |
| 30 | 98 | 5 |
| 72 | 2:15 min | |
| 1 | 72 | 7 min |
| 1 | 4 | inf |
- Using hot start at 98°C
Result
Expected band: 5 Kb
Gels shows expected band.
- => Band was cut and gel extracted.
Restriction Digest
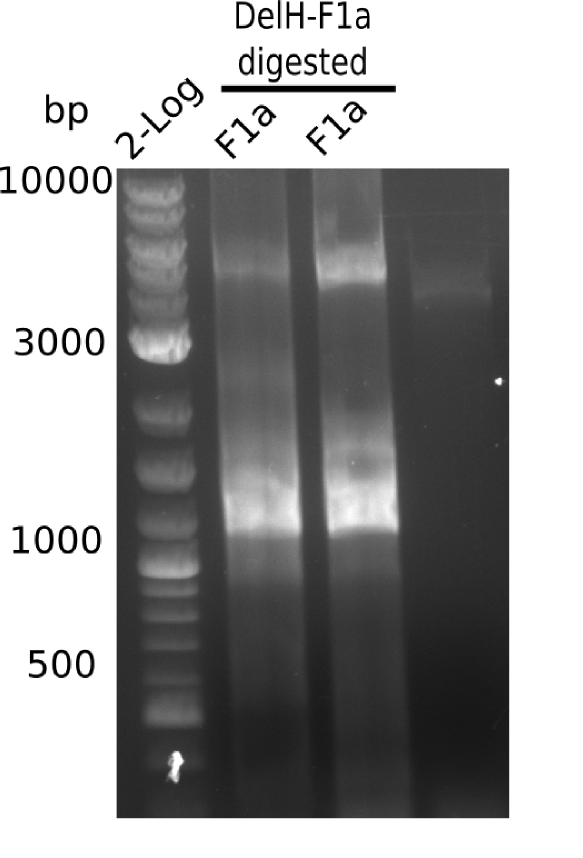
DelH F1a was restricted with EcoRI & PacI.
Afterwards it was purified with nucleotide removal kit and DNA concentration was measured.
Result
Expected band: 5 Kb
Gel shows expected band at ~5 Kb.
- => Restriction digest mix was purified by precipitation.
Purification of Restriction Digest
- Add 1 ml isopropanol
- Centrifuge 20 min full speed
- Discard supernatant
- Add 750 µl 70% ethanol
- Centrifuge 5 min full speed
- Discard supernatant
- Dry for 10 min
- Resuspend in 20 µl H2O
Result
DNA-concentration was measured at the Nanodrop c=21 ng/µl.
Re-PCR Conditions F1a.W8.A
In order to increase the product yield, F1a was amplified from the PCR fragment produced in week 7 using PCR conditions F1a.W7.A and short2 primer.
| Reagent | Amount [µl] |
|---|---|
| Expected length [bp] | 5 Kb |
| Template | 1 µl 1:10 dilution of purified DelH F1a (2.1 ng/µl) |
| Primer 10 µM fw | 2.5 µl DelH_f1_short2_fw |
| Primer 10 µM rev | 2.5 µl DelH_EcoRI_rev |
| Phusion Master Mix (2x) | 25 µl |
| ddH2O | 19 µl |
| Cycles | Temperature A [°C] | Time [s] | Cycles | Temperature B [°C] | Time [s] | |
|---|---|---|---|---|---|---|
| 1 | 98 | 30 | 1 | 98 | 30 | |
| 30 | 98 | 5 | 30 | 98 | 5 | |
| - | - | 66 | 5 | |||
| 72 | 2:15 min | 72 | 2:15 min | |||
| 1 | 72 | 7 min | 1 | 72 | 7 min | |
| 1 | 4 | inf | 1 | 4 | inf |
- Using hot start at 98°C
Result
Expected band: 5 Kb
Gel shows expected band at ~5 Kb.
- => Fragment was cut and gel isolated.
Generation of DelH plasmid 19-06
Ligation
Using 200 ng DNA
| Fragment | Size [Kb] | Concentration [ng/µl] | Volume [µl] for ligation |
|---|---|---|---|
| F1a | 5 | 261 (1:10 diluted => 26.1) | 1.4 |
| F1b | 5 | 19 | 1.6 |
| F2 | 8 | 9 | 4.5 |
| Backbone | 7.4 | 24 | 2 |
| Reagent | Volume [µl] for ligation |
|---|---|
| Ligase | 1 |
| Buffer | 2 |
| Total DNA | 10.3 |
| ddH2O | 7.3 |
Using 600 ng DNA
| Fragment | Size [Kb] | Concentration [ng/µl] | Volume [µl] for ligation |
|---|---|---|---|
| F1a | 5 | 261 (1:10 diluted => 26.1) | 8 |
| F1b | 5 | 19 | 7 |
| F2 | 8 | 9 | 2 |
| Backbone | 7.4 | 5 |
| Reagent | Volume [µl] for ligation |
|---|---|
| Ligase | 2 |
| Buffer | 4 |
| Total DNA | 22 |
| ddH2O | 22 |
Purification of Ligation
- Add 1 ml isopropanol
- Centrifuge 20 min full speed
- Discard supernatant
- Add 750 µl 70% ethanol
- Centrifuge 5 min full speed
- Discard supernatant
- Dry for 10 min
- Resuspend in 20 µl H2O
Electroporation
As described in methods Electroporation of E. coli DH10β
- One Eppi with DNA of ligation with 20 µl
- Second Eppi with DNA of ligation with 50 µl (more DNA)
- Streaked on LB Amp plates. Of each electroporated aliquot, one plate with 10 µl and another with 100 µl of the cells was spread.
- Incubation ON at 37°C.
Characterization of DelH plasmid 19-06
Test Digest using SalI and PacI
| Reagent | Amount [µl] |
|---|---|
| DNA | 1 |
| SalI | 1 |
| PacI | 1 |
| NEB4-buffer | 2 |
| BSA | 2 |
| ddH2O | 13 |
Result
Expected band: 10 Kb, 8 Kb, 7 Kb
There is nothing to see on gel, most probably due to too little amounts of DNA.
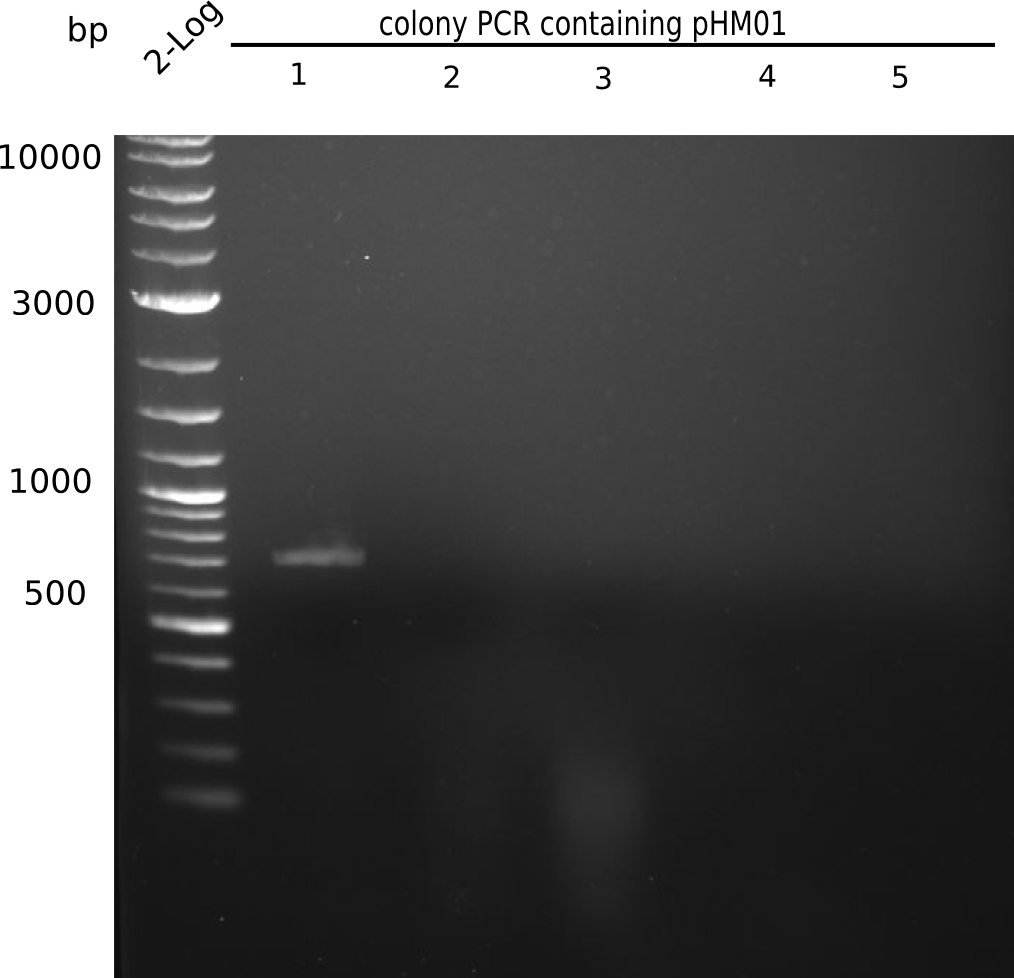
Colony-PCR
- Only few colonies (~10) grew on both 100 µl plates.
- Of 8 colonies from each 100 µl plate, a colony-PCR was performed.
- Inocculation of PCR colonies into 1 ml LB Amp-Ara-XGal ON at 37°C.
| Reagent | DelH colonies |
|---|---|
| Expected length [bp] | 663 |
| Primer fw 10 µM | 2 µl VF2 |
| Primer rev 10 µM | 2 µl DN07 |
| Dream-Taq Polymerase (2x) | 10 µl |
| ddH2O | 6 µl |
| Cycles | Temperature [°C] | Time [s] |
|---|---|---|
| 1 | 95 | 120 |
| 12 | 95 | 60 |
| 68 (touchdown -0.5°C) | 30 | |
| 72 | 45 | |
| 18 | 95 | 60 |
| 65 (touchdown -0.5°C) | 30 | |
| 72 | 45 | |
| 1 | 12 | inf |
Result
Expected band: 663 bp
Only colony 4 (second lane) shows expected band at ~600 bp. Yet, no blue color could be detected in ON culture, even in pellet (frozen for SDS Page).
- => This means, that our ligated plasmid was successfully transformed, but lacZ is not expressed.
Will run SDS-PAGE of transformed cultures and parental stock. Also inocculate cultures using higher concentrations of arabinose and X-Gal.
Stronger Induction of lacZ Expression
- Inocculated single colonies from day before into 5 ml LB Amp-Ara-XGal using 2x amounts of arabinose and X-Gal stock solutions (maybe concentrations of stocks are too low or promoters need stronger induction).
- Incubation ON at 37°C.
Result
No lacZ expression was observed.
 "
"


