Team:Heidelberg/Templates/Indigoidine week21
From 2013.igem.org
Quantitative Assay
Measurement
This week we go for a first big measurement with our engineered indigoidine synthetases. The following figure is a scheme of our 96 well plate for the first measurement. We used one plate to grow positive (i.e. indigoidine producing) E. coli TOP10 transformants from an agar plate in liquid culture for 30 hours at 37 °C. We prepared a second 96 well plate with 180 ul media and the respective antibiotics an inoculated with 20 ul of the liquid culture from the first plate.
The second plate was observed in our Tecan plate reader. This time we measured the absorbance from 400 nm to 800 nm in 2 nm steps and 25 reads for every well. This configuration unfortunately leads to the problem that the reader takes a long time for each measurement and we get huge time intervals between each measurement. Therefore we stopped the measurement after aboout 12 hours and changed the configuration. For the next 15 hours we used an interval of 10 nm and used 25 reads per well, so we are able to get a higher resolution on the time scale.
The following table shows the loading scheme of our 96 well plate in this run.
| 96-well | 1 | 2 | 3 | 4 | 5 | 6 | 7 | 8 | 9 | 10 | 11 | 12 |
|---|---|---|---|---|---|---|---|---|---|---|---|---|
| A | - | - | - | - | - | - | - | - | - | - | - | - |
| B | - | - | - | - | - | Mücke/ Spinne | - | - | MG1655+pRB3 | TOP10+pRB3 | BAP1+pRB3 | - |
| C | - | TOP10 | - | pRB22 | pRB23-T2 | pRB23-T8 | pRB23-T10 | pRB23-T12 | pRB23-T13 | pRB23-T14 | pRB23-T16 | - |
| D | - | TOP10+pRB15 | pRB3 | pRB22+pRB15 | pRB23-T2+pRB15 | pRB23-T8+pRB15 | pRB23-T10+pRB15 | pRB23-T12+pRB15 | pRB23-T13+pRB15 | pRB23-T14+pRB15 | pRB23-T16+pRB15 | - |
| E | - | TOP10+pRB16 | pRB4 | pRB22+pRB16 | pRB23-T2+pRB16 | pRB23-T8+pRB16 | pRB23-T10+pRB16 | pRB23-T12+pRB16 | pRB23-T13+pRB16 | pRB23-T14+pRB16 | pRB23-T16+pRB16 | - |
| F | - | TOP10+pRB17 | pRB6 | pRB22+pRB17 | pRB23-T2+pRB17 | pRB23-T8+pRB17 | pRB23-T10+pRB17 | pRB23-T12+pRB17 | pRB23-T13+pRB17 | pRB23-T14+pRB17 | pRB23-T16+pRB17 | - |
| G | - | TOP10+pRB18 | pRB24 | pRB22+pRB18 | pRB23-T2+pRB18 | pRB23-T8+pRB18 | pRB23-T10+pRB18 | pRB23-T12+pRB18 | pRB23-T13+pRB18 | pRB23-T14+pRB18 | pRB23-T16+pRB18 | - |
| H | - | - | - | - | - | - | - | - | - | - | - | - |
Results
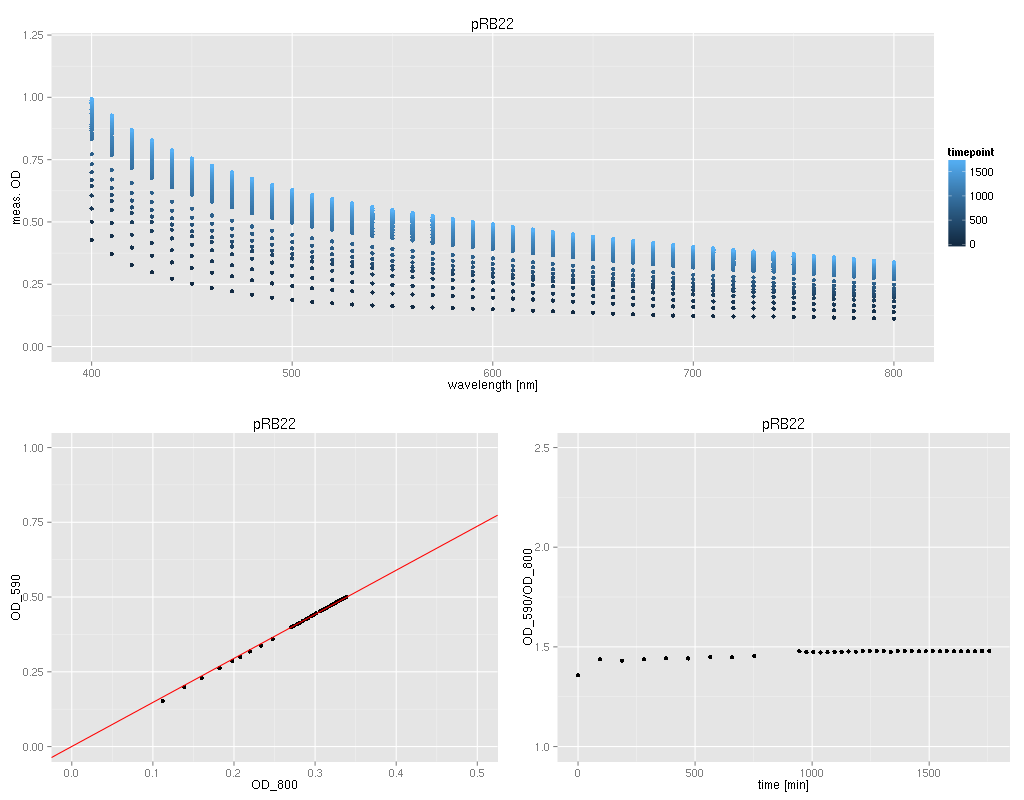
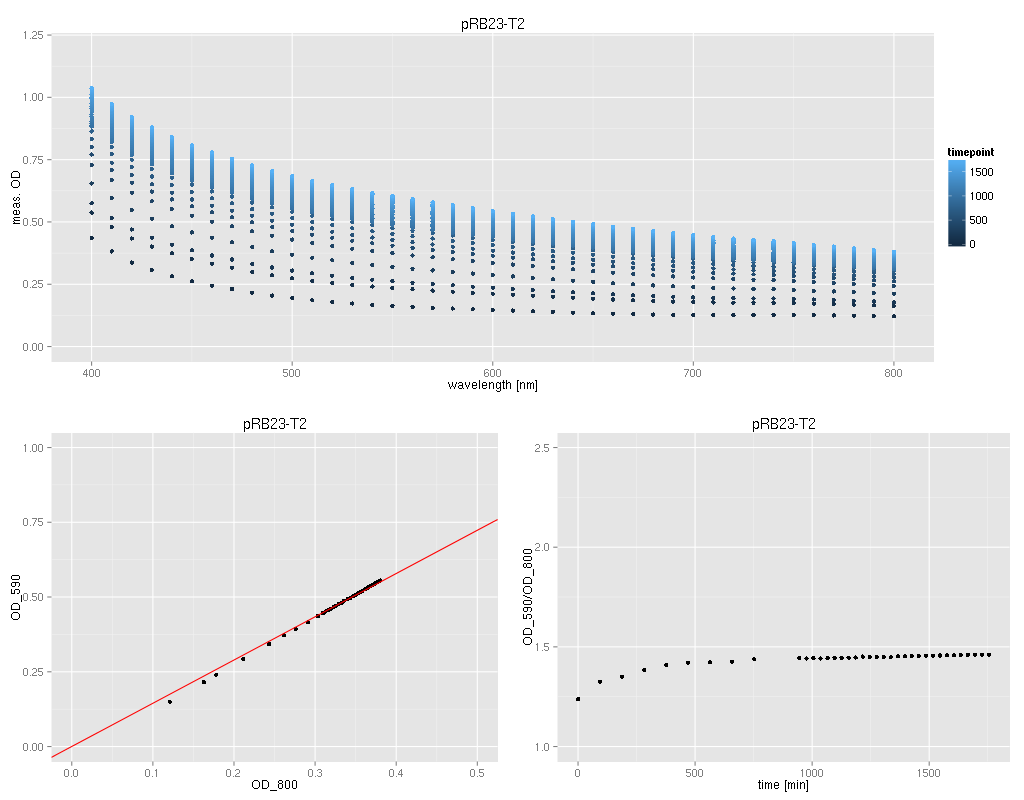
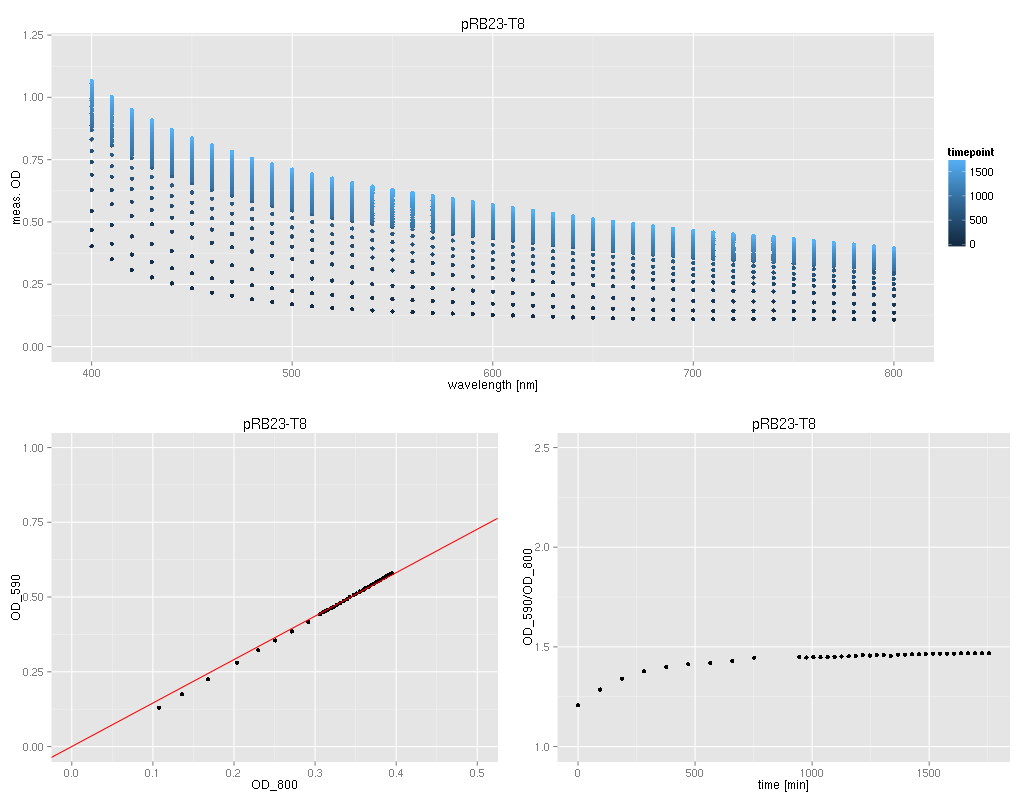
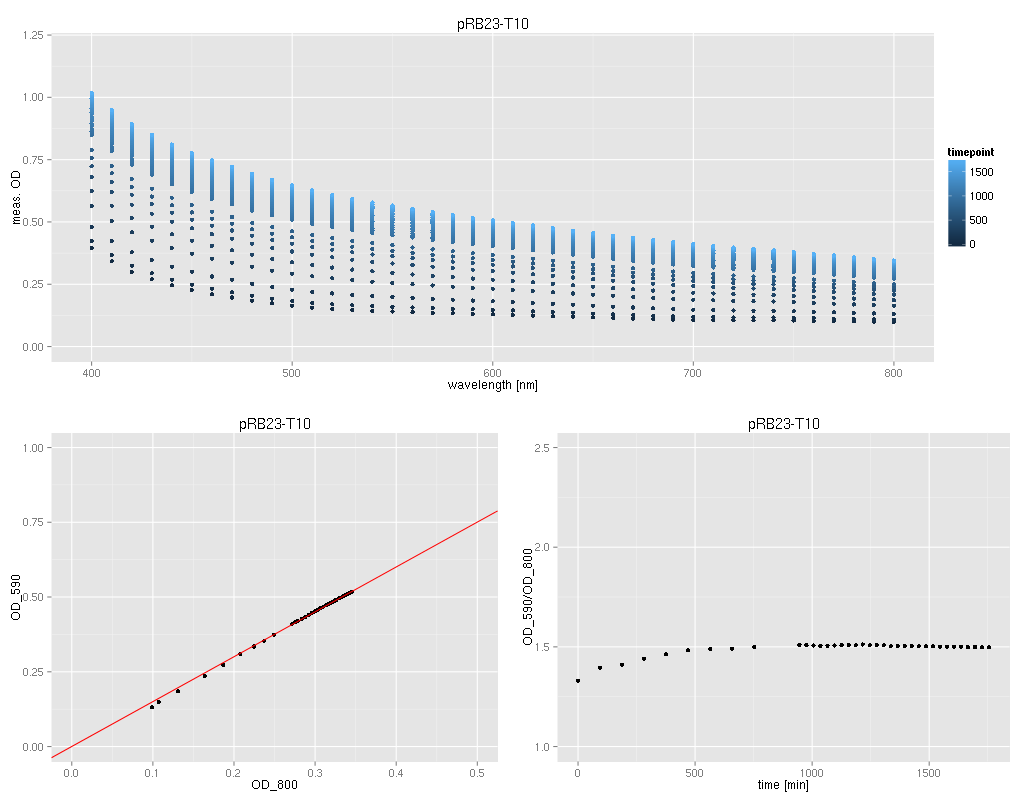
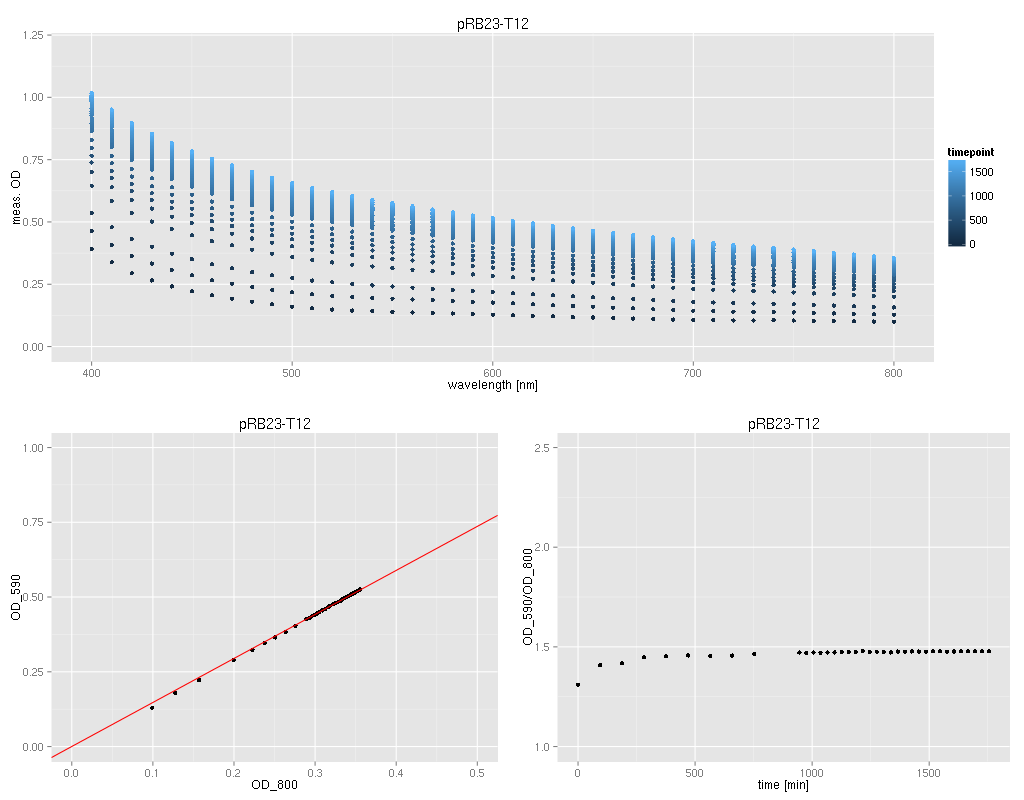
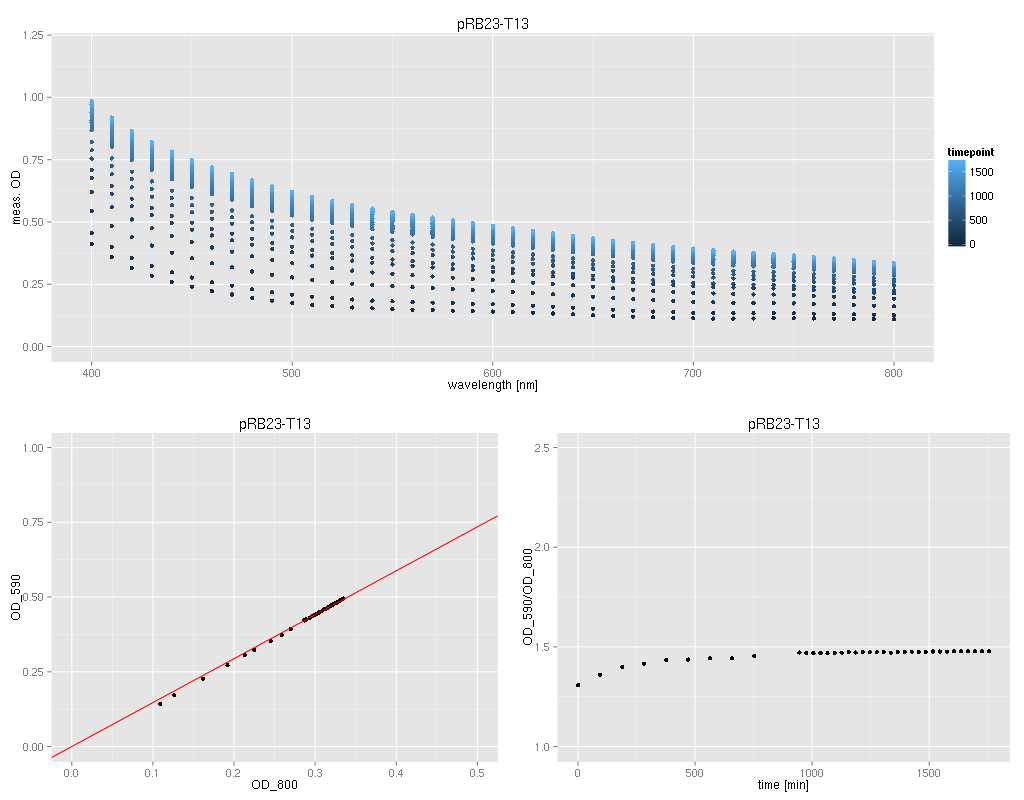
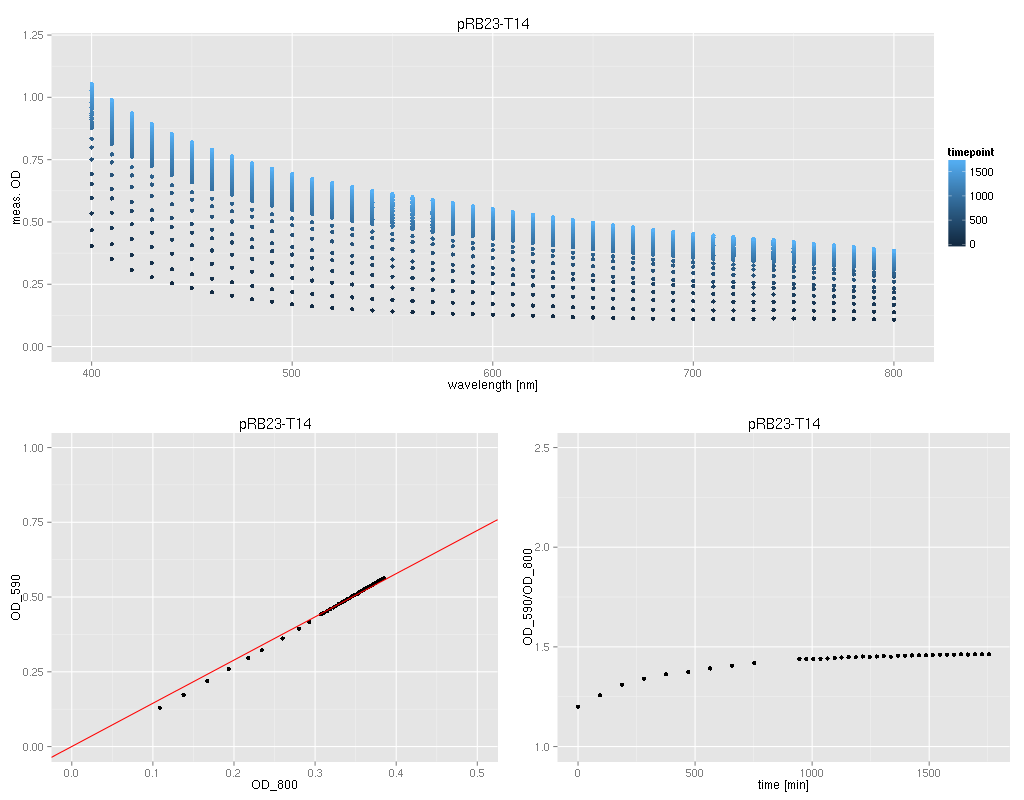
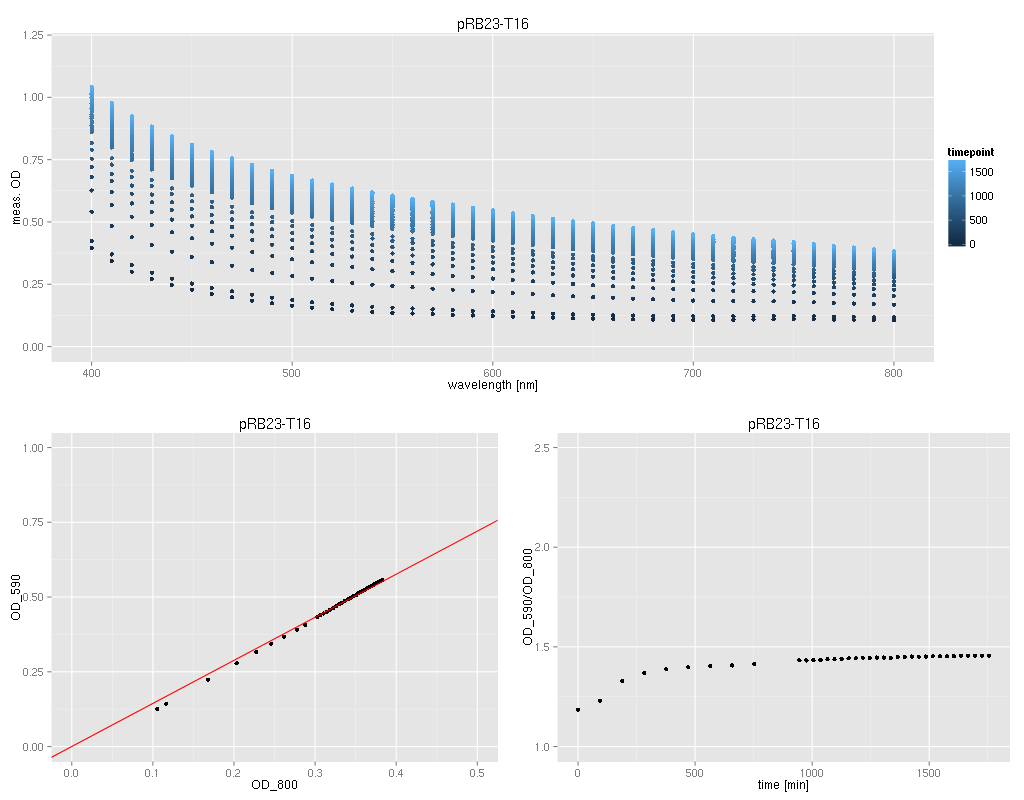
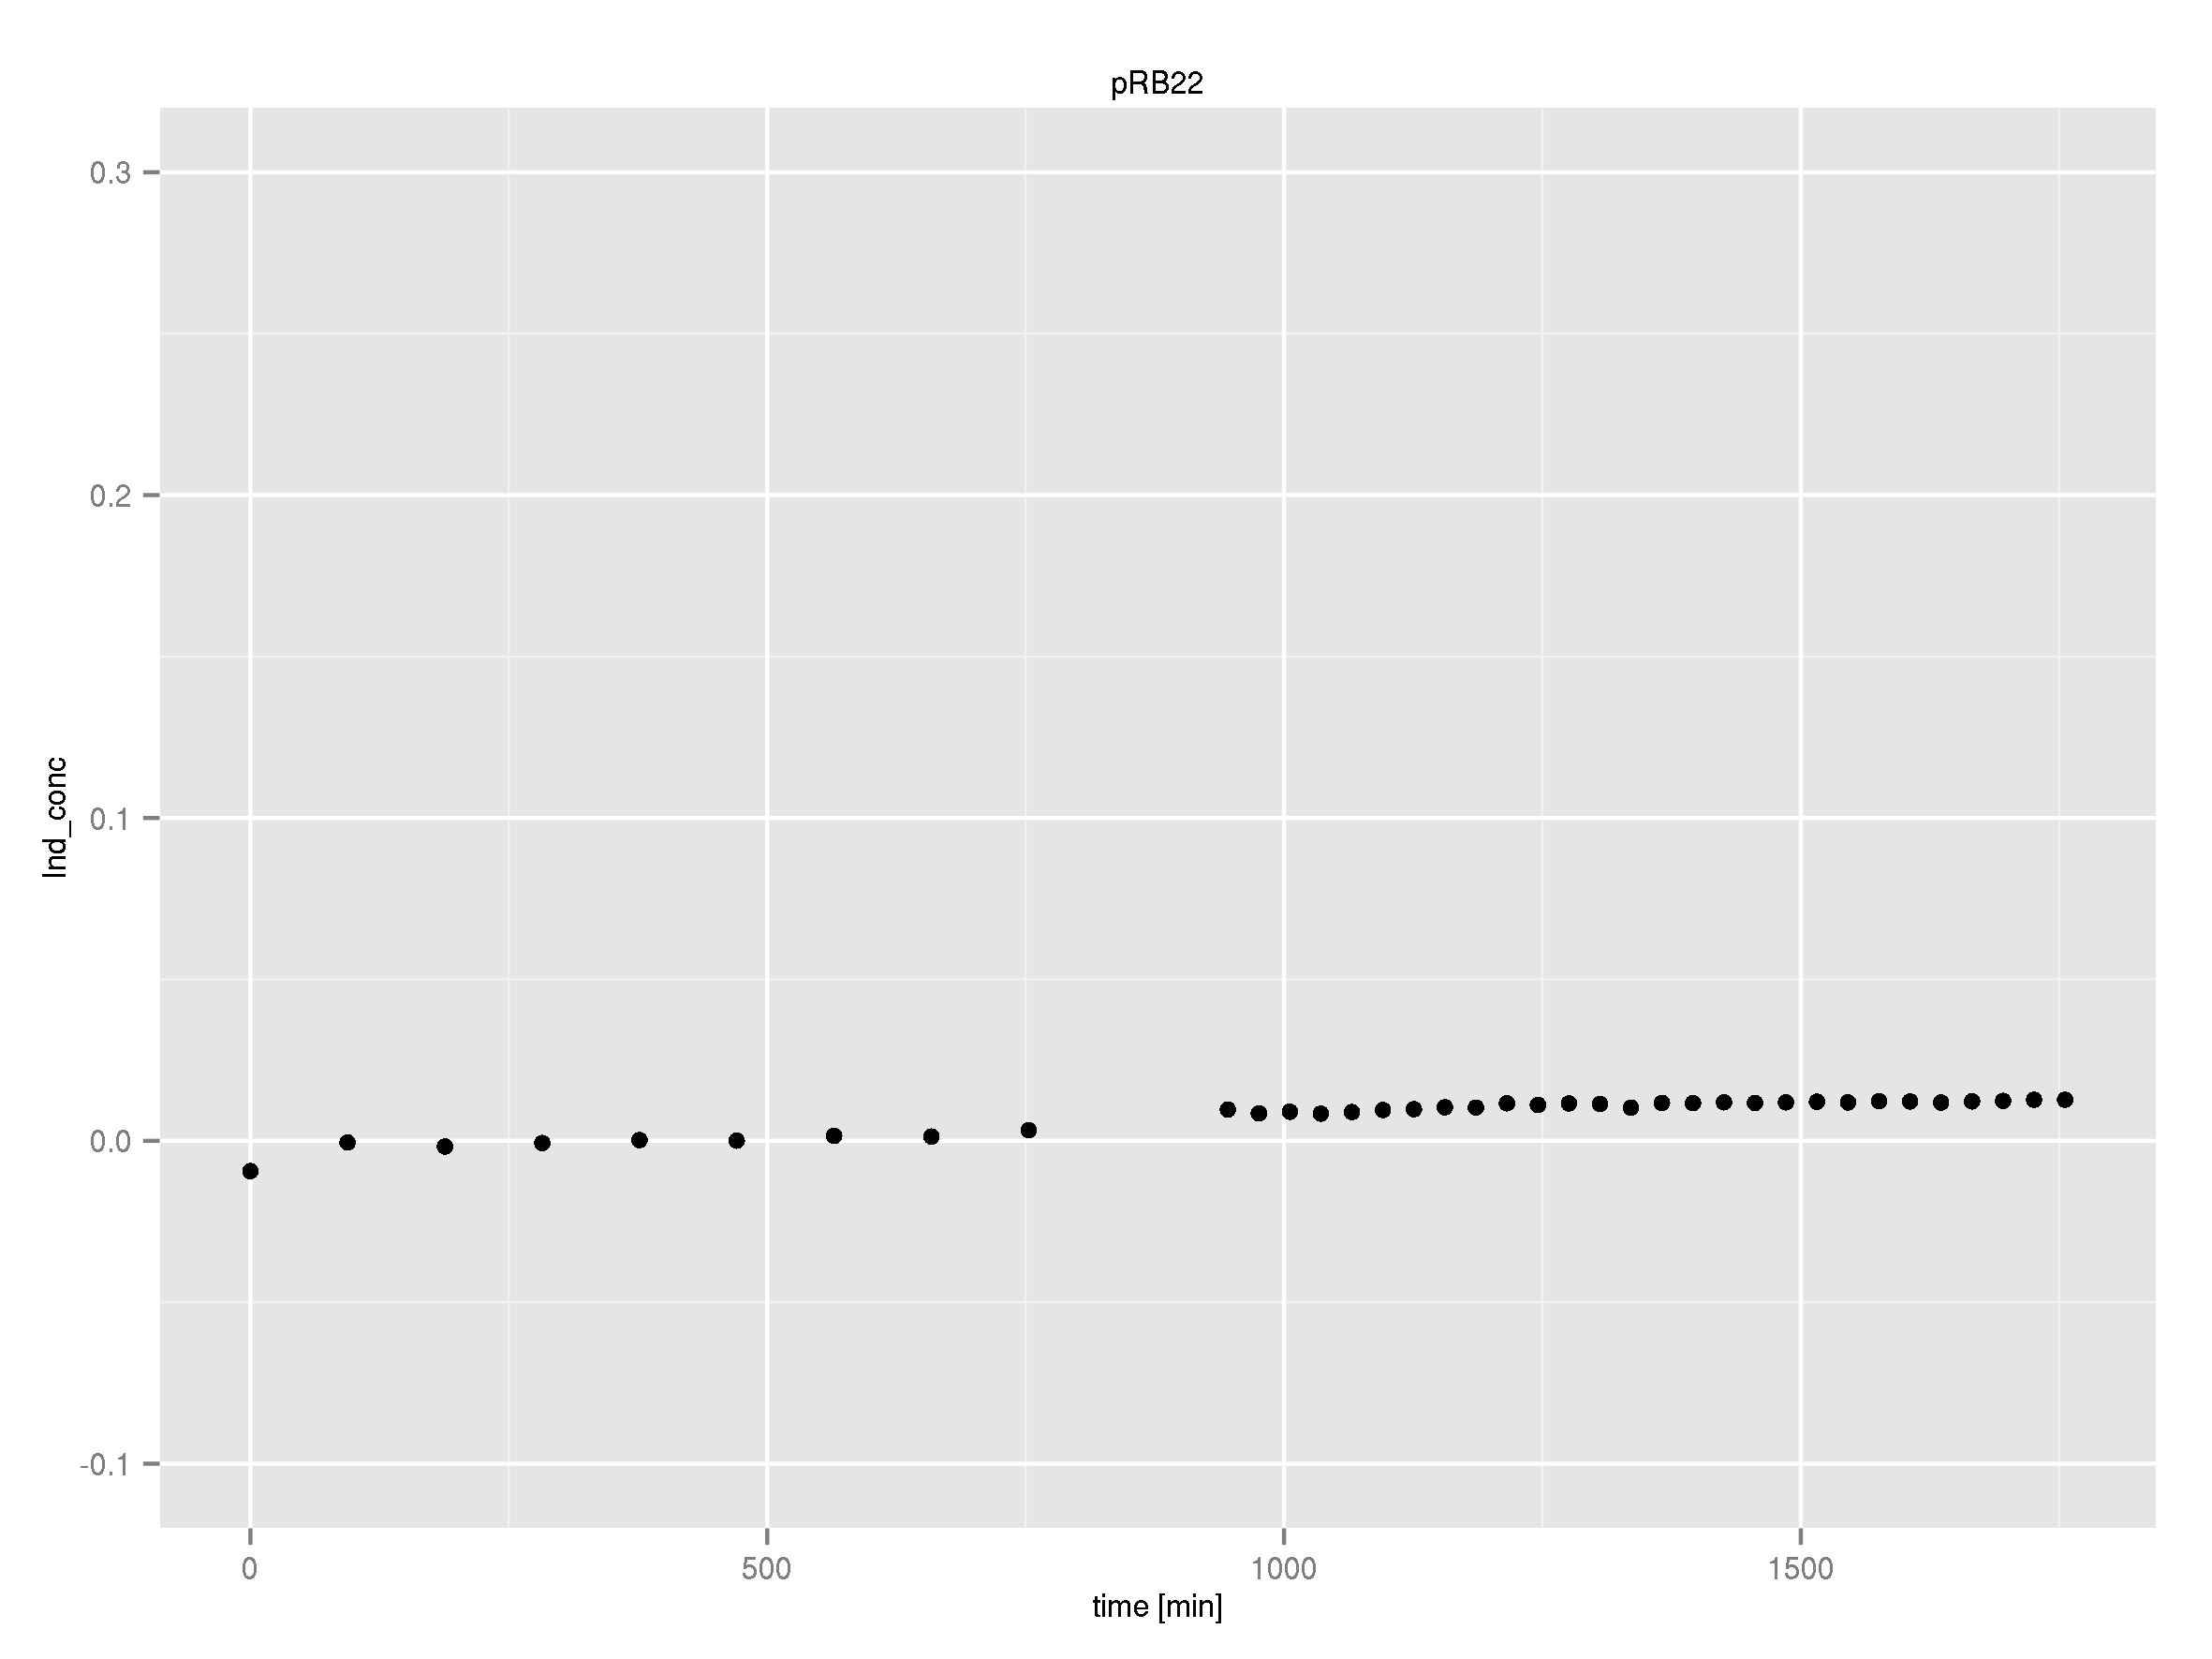
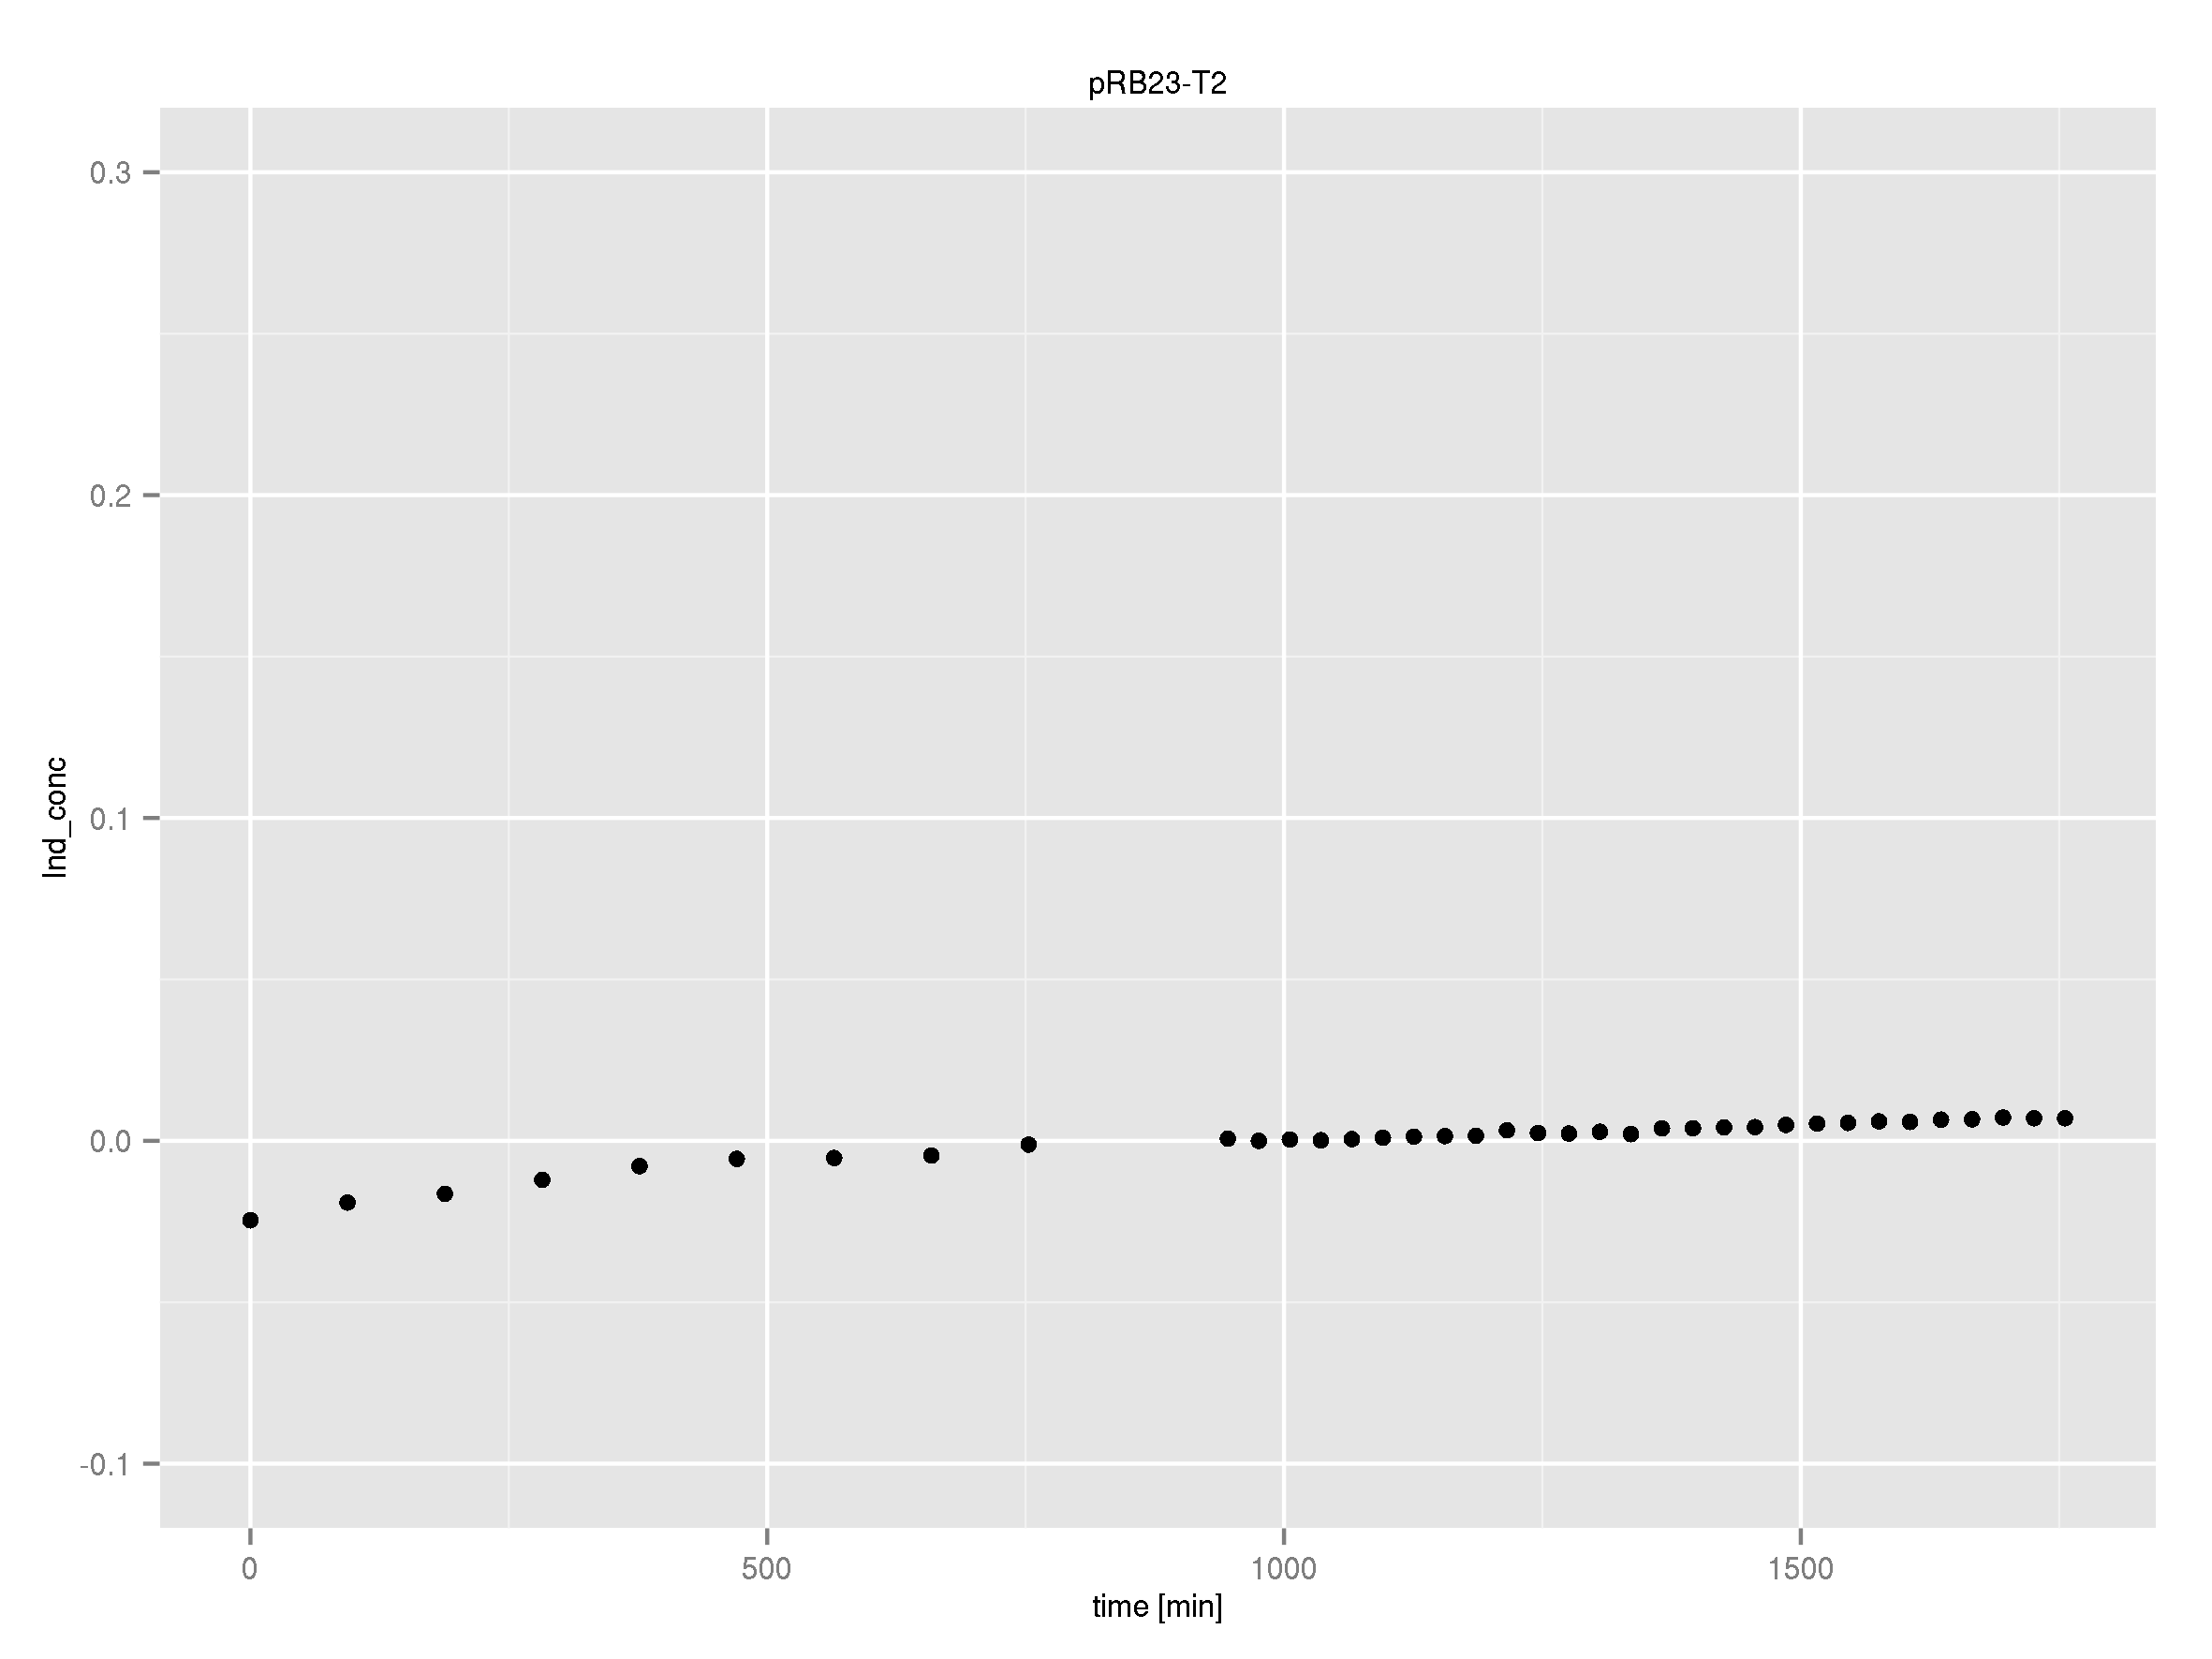
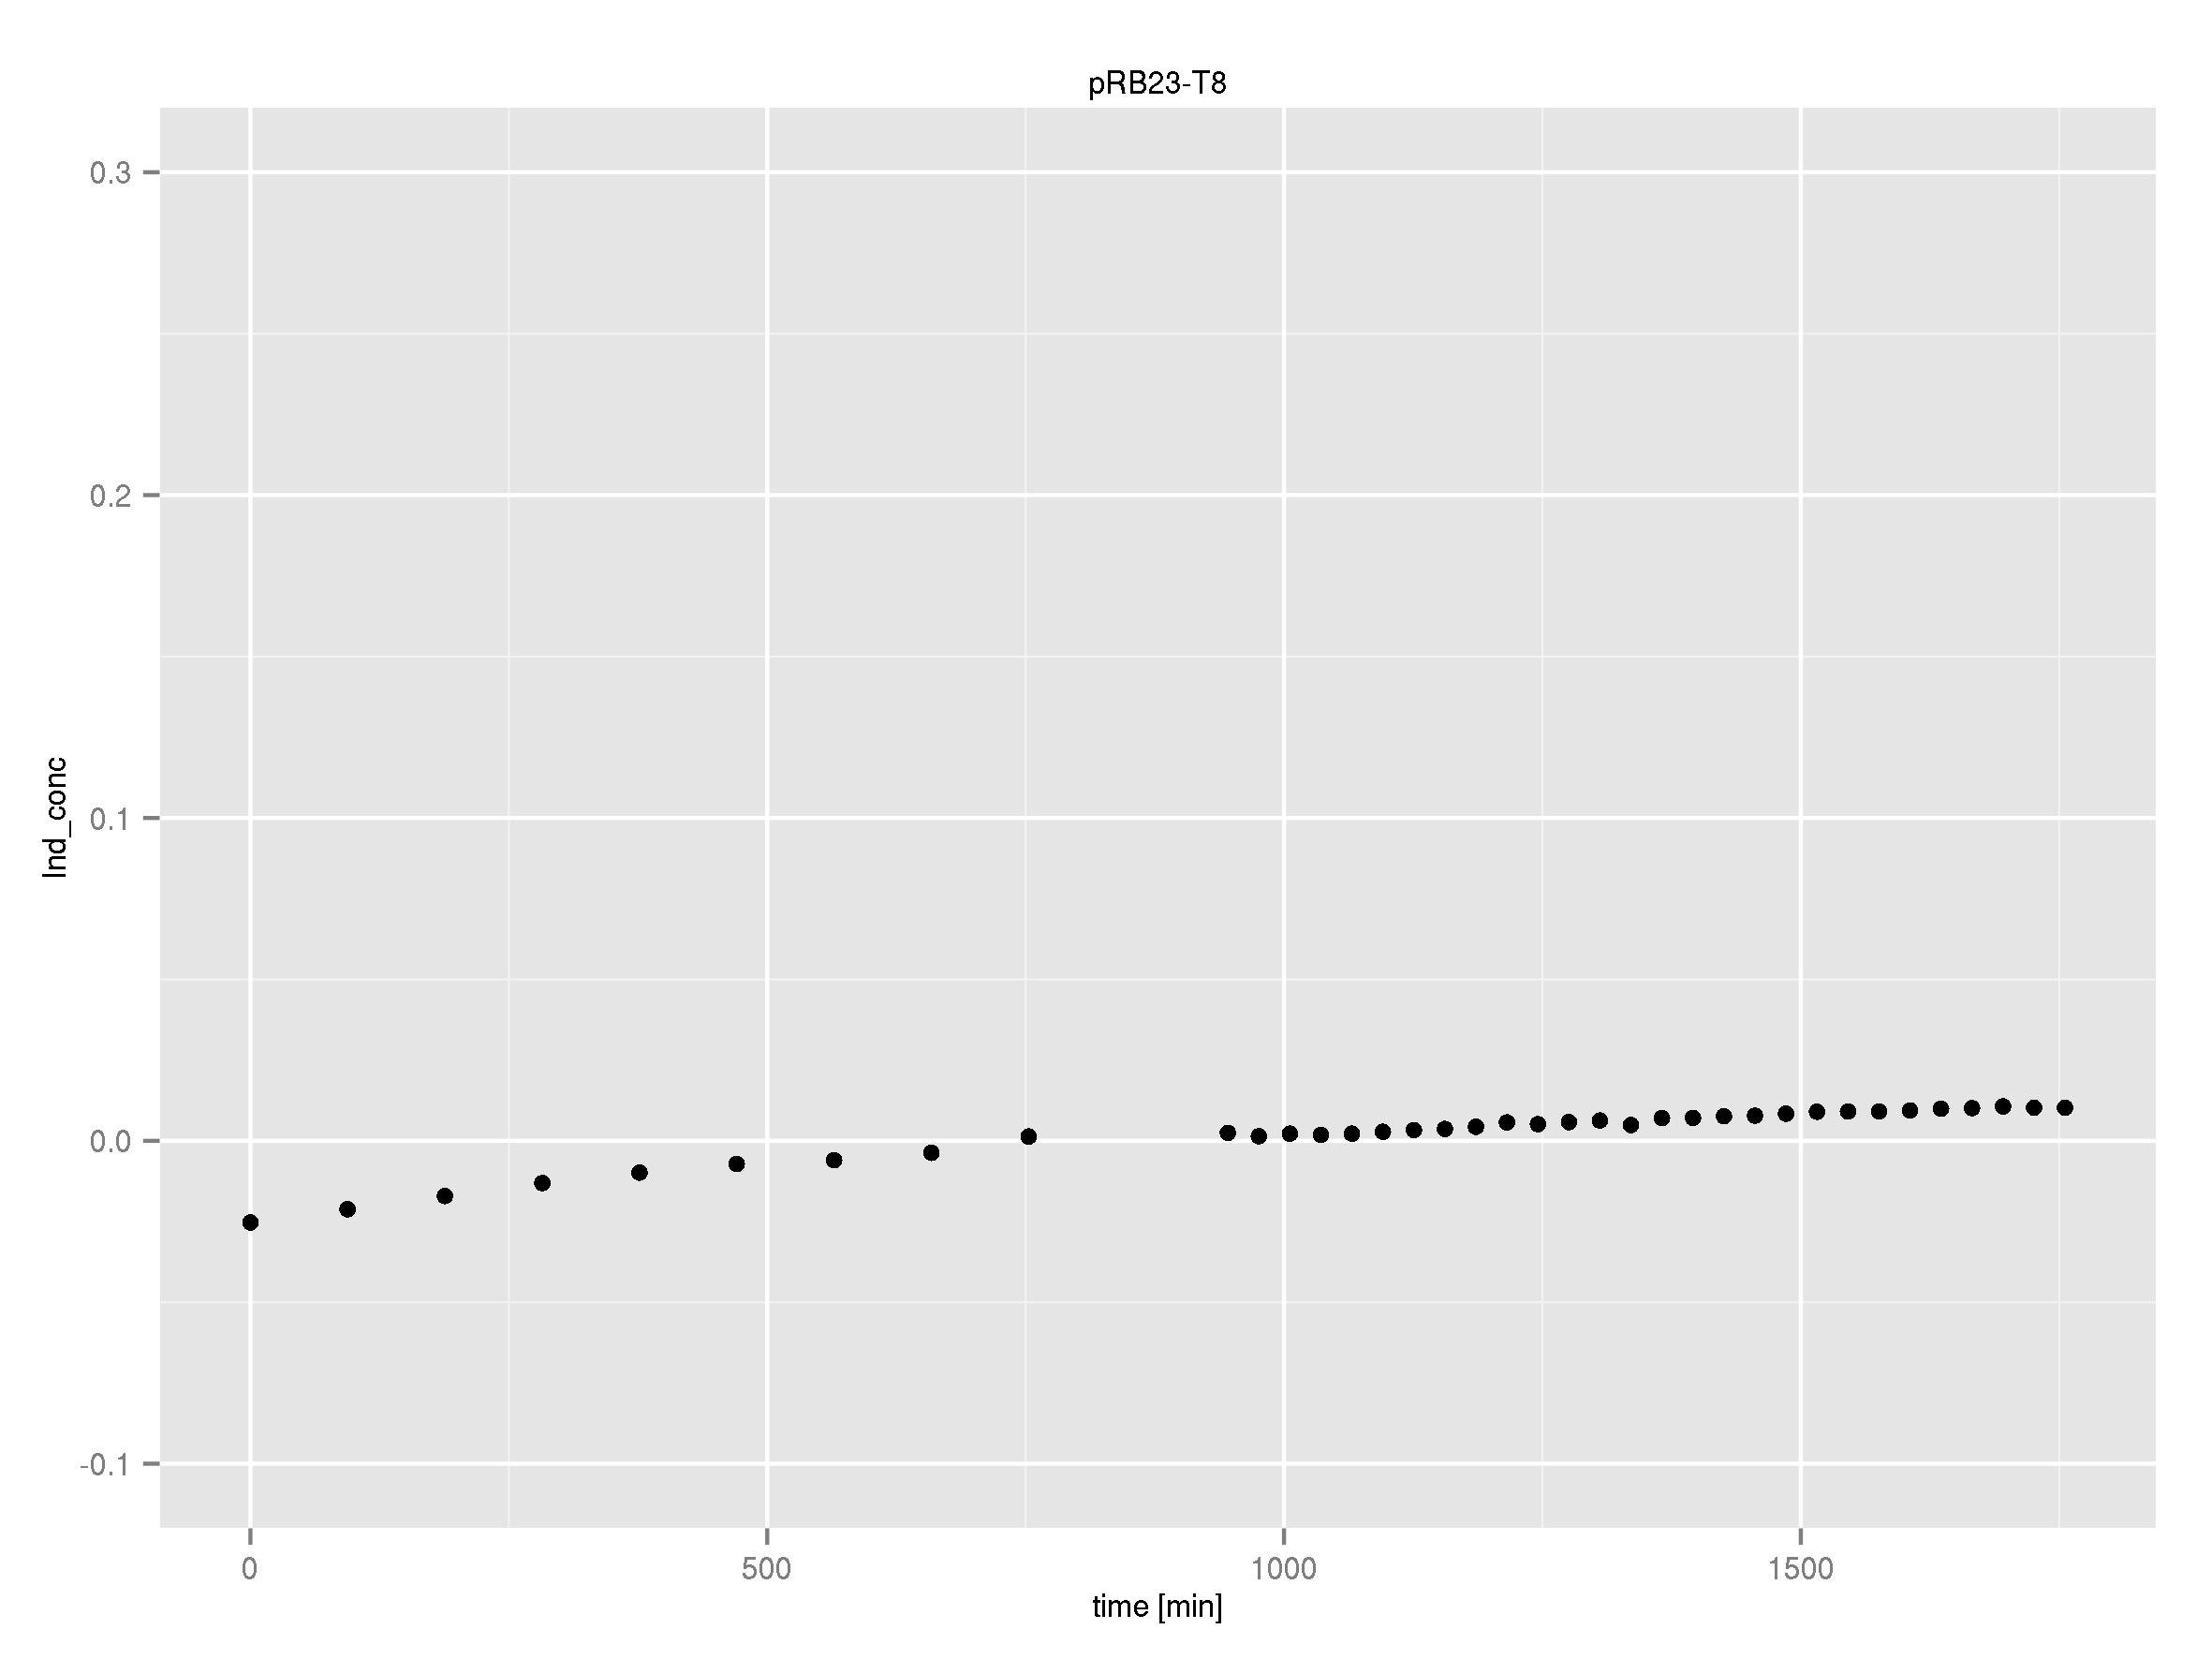
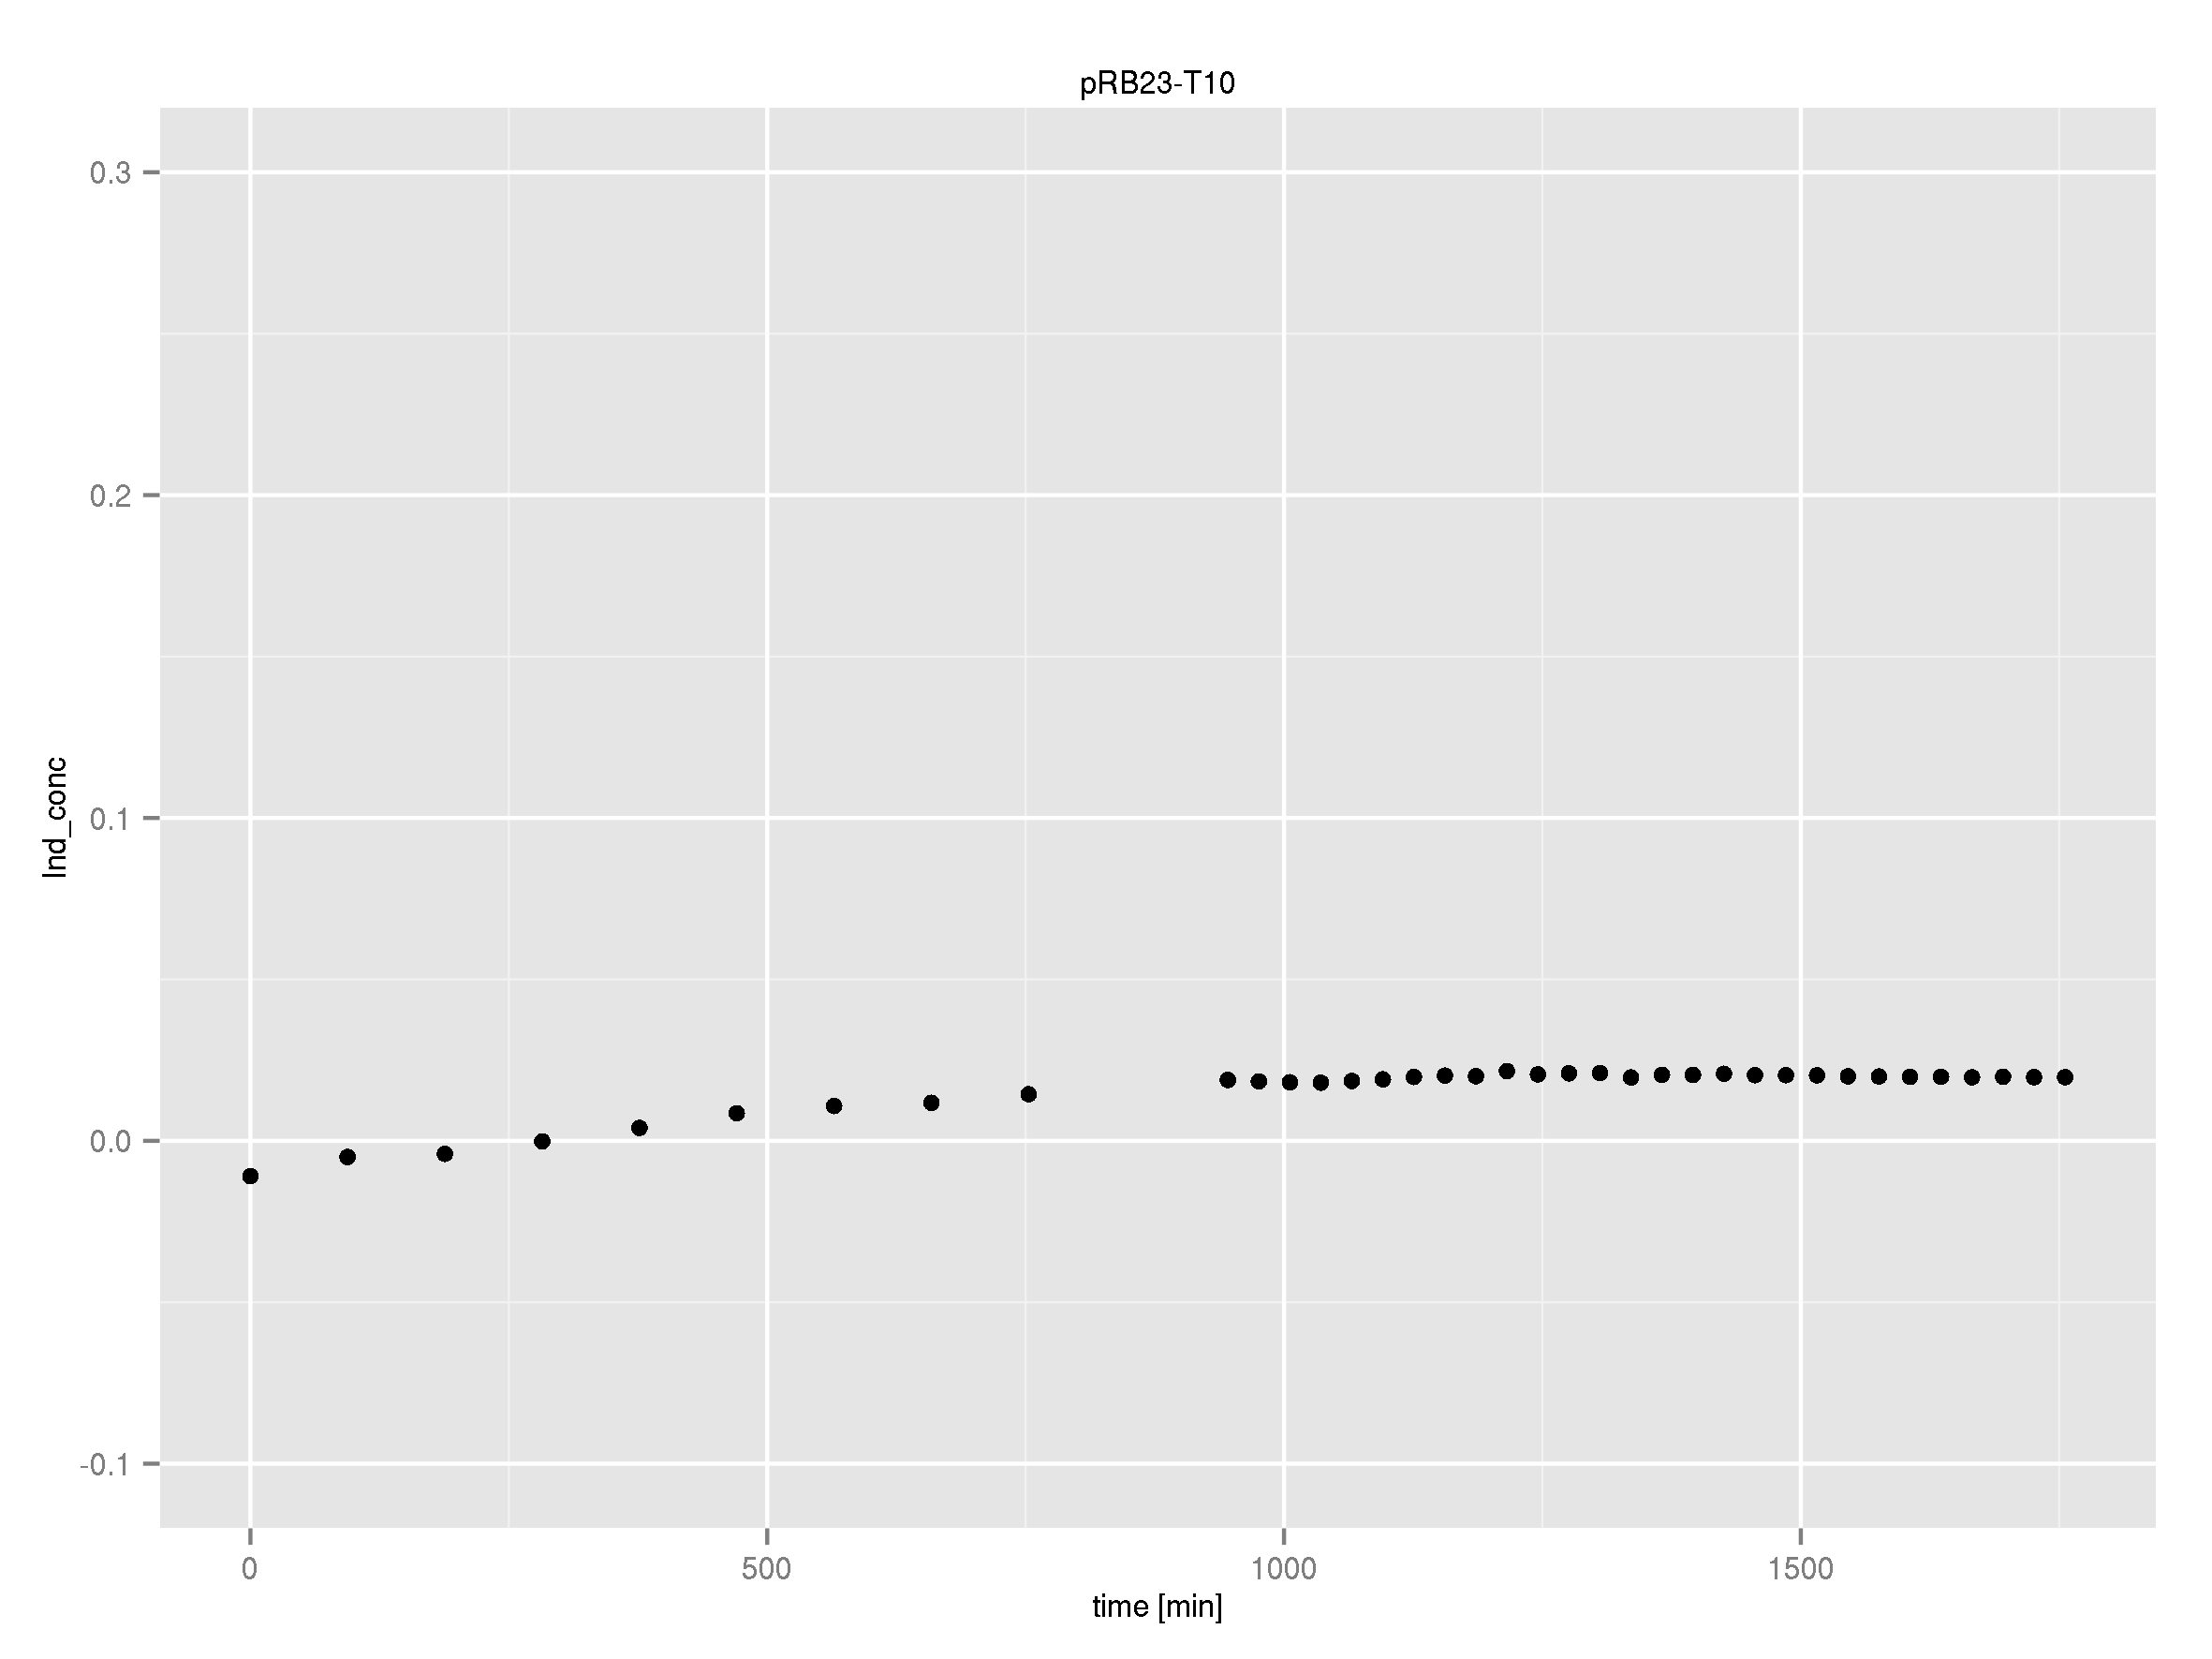
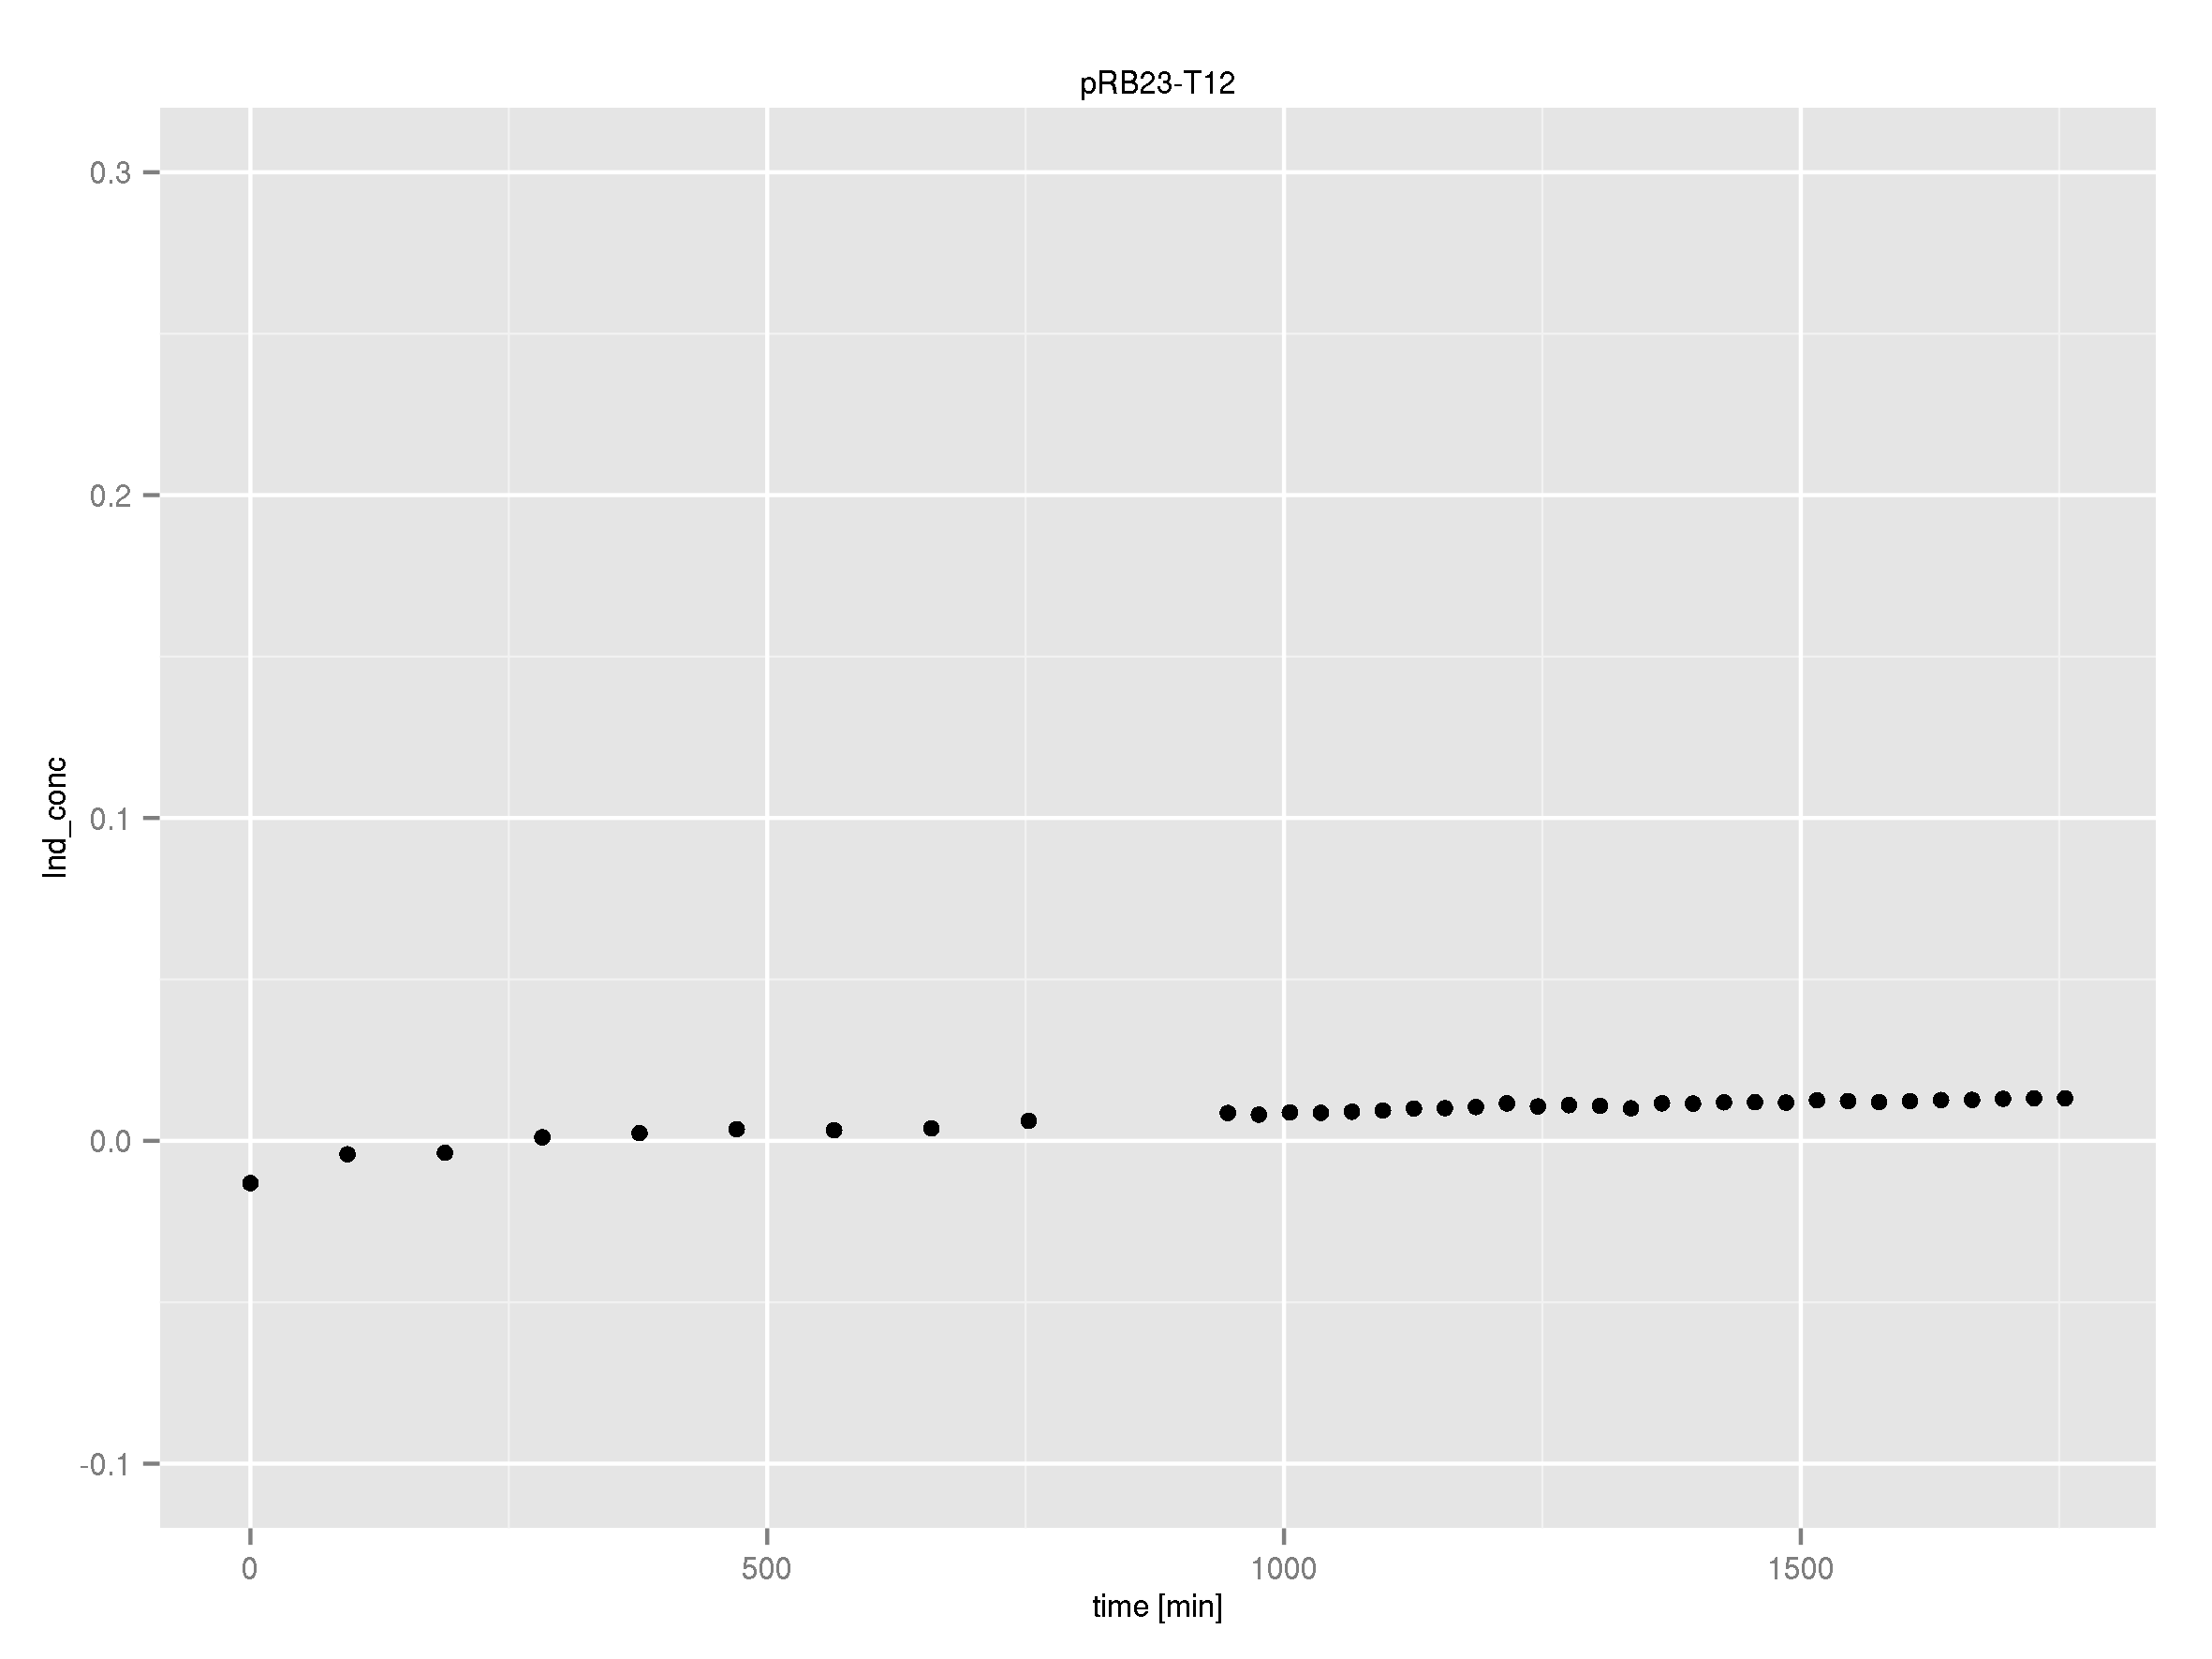
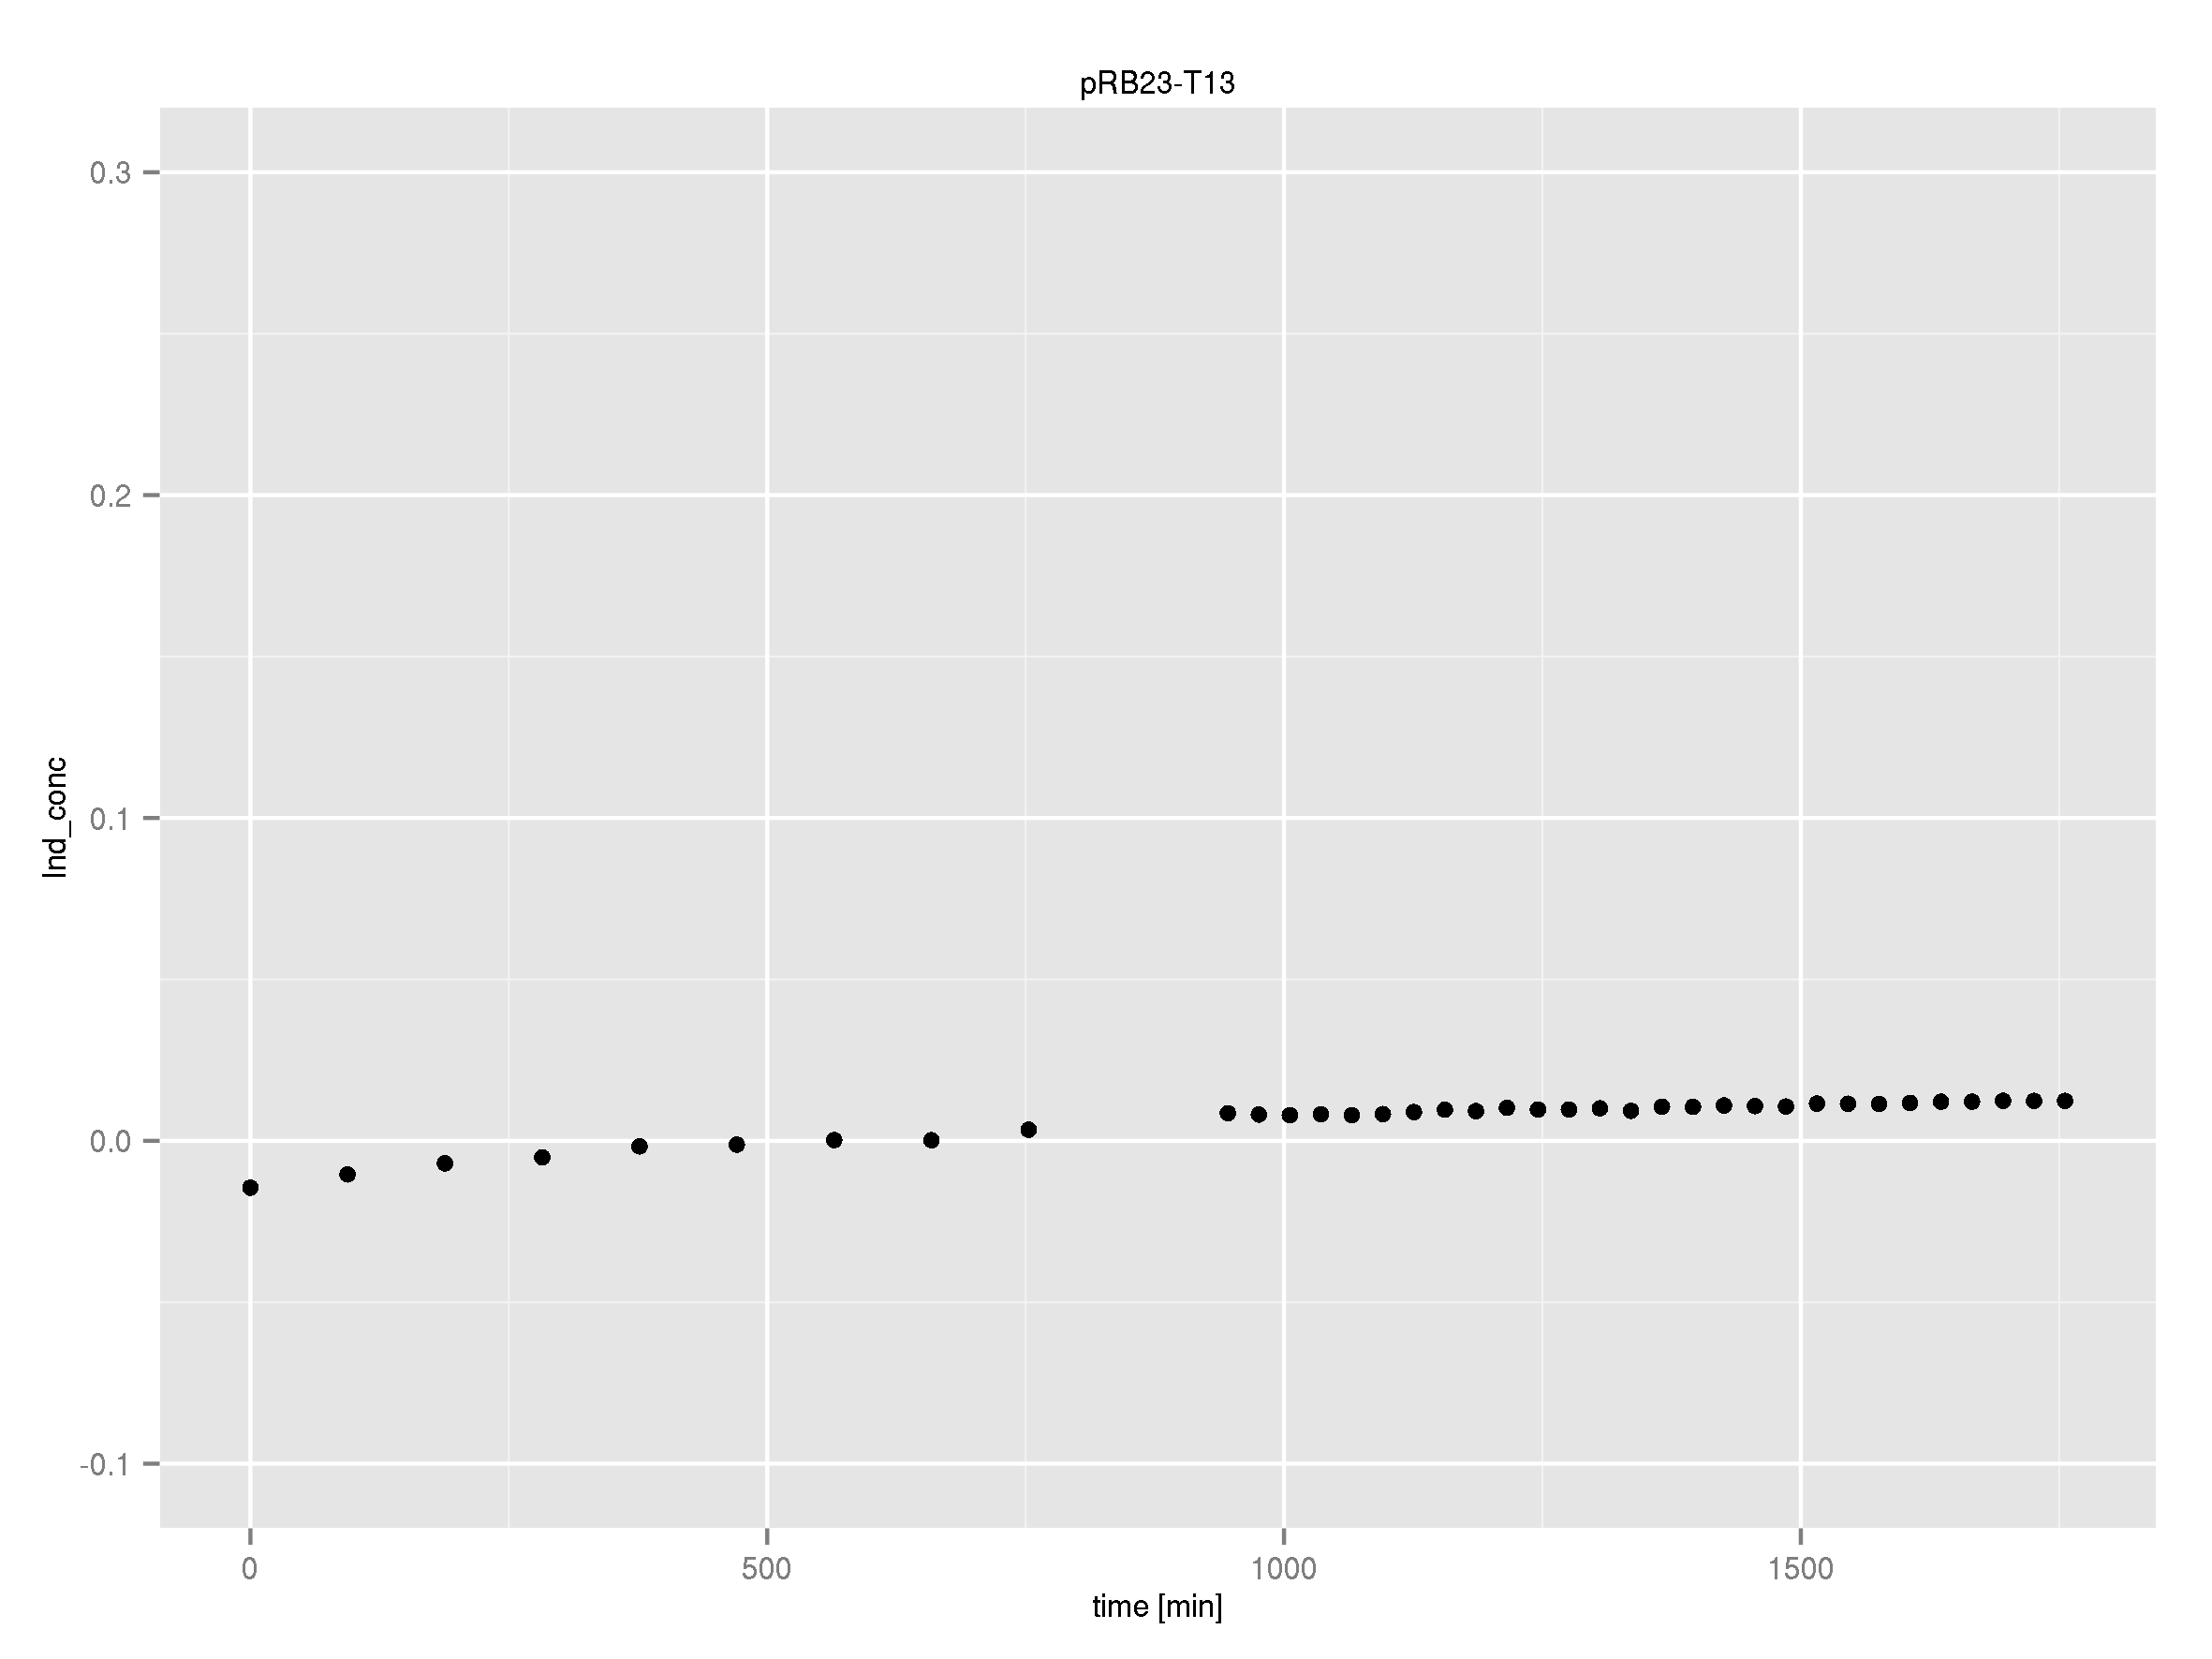
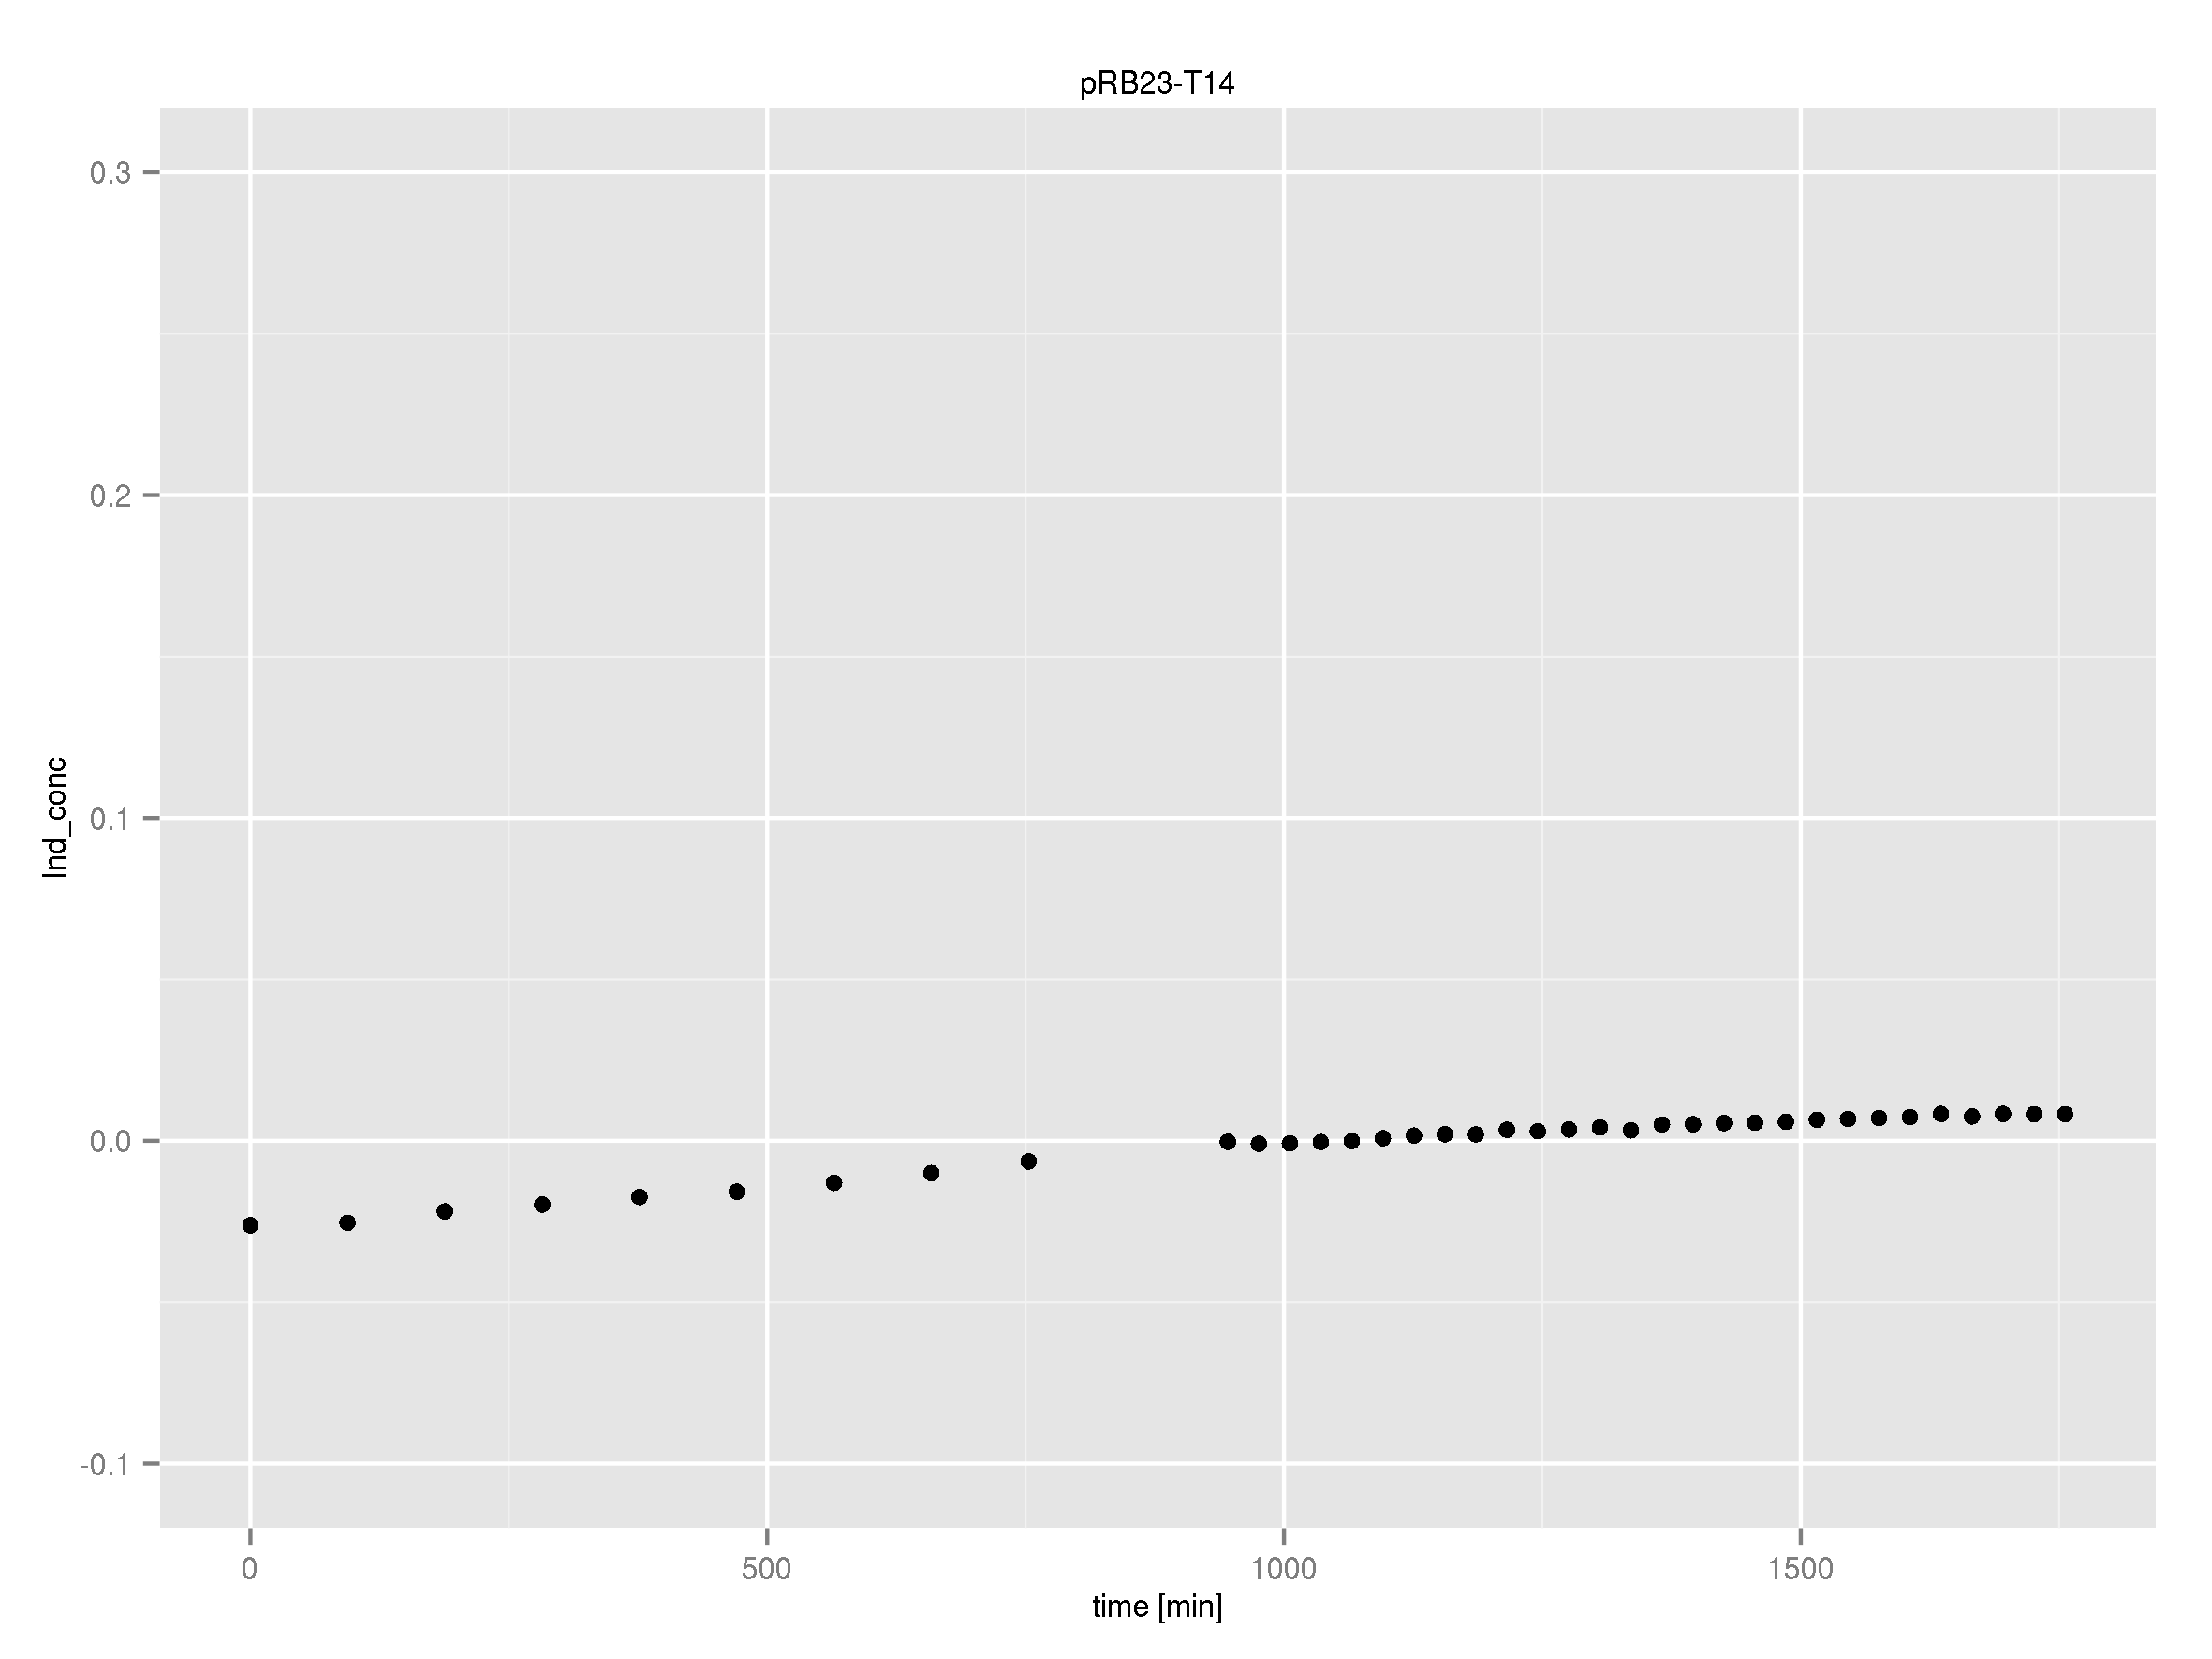
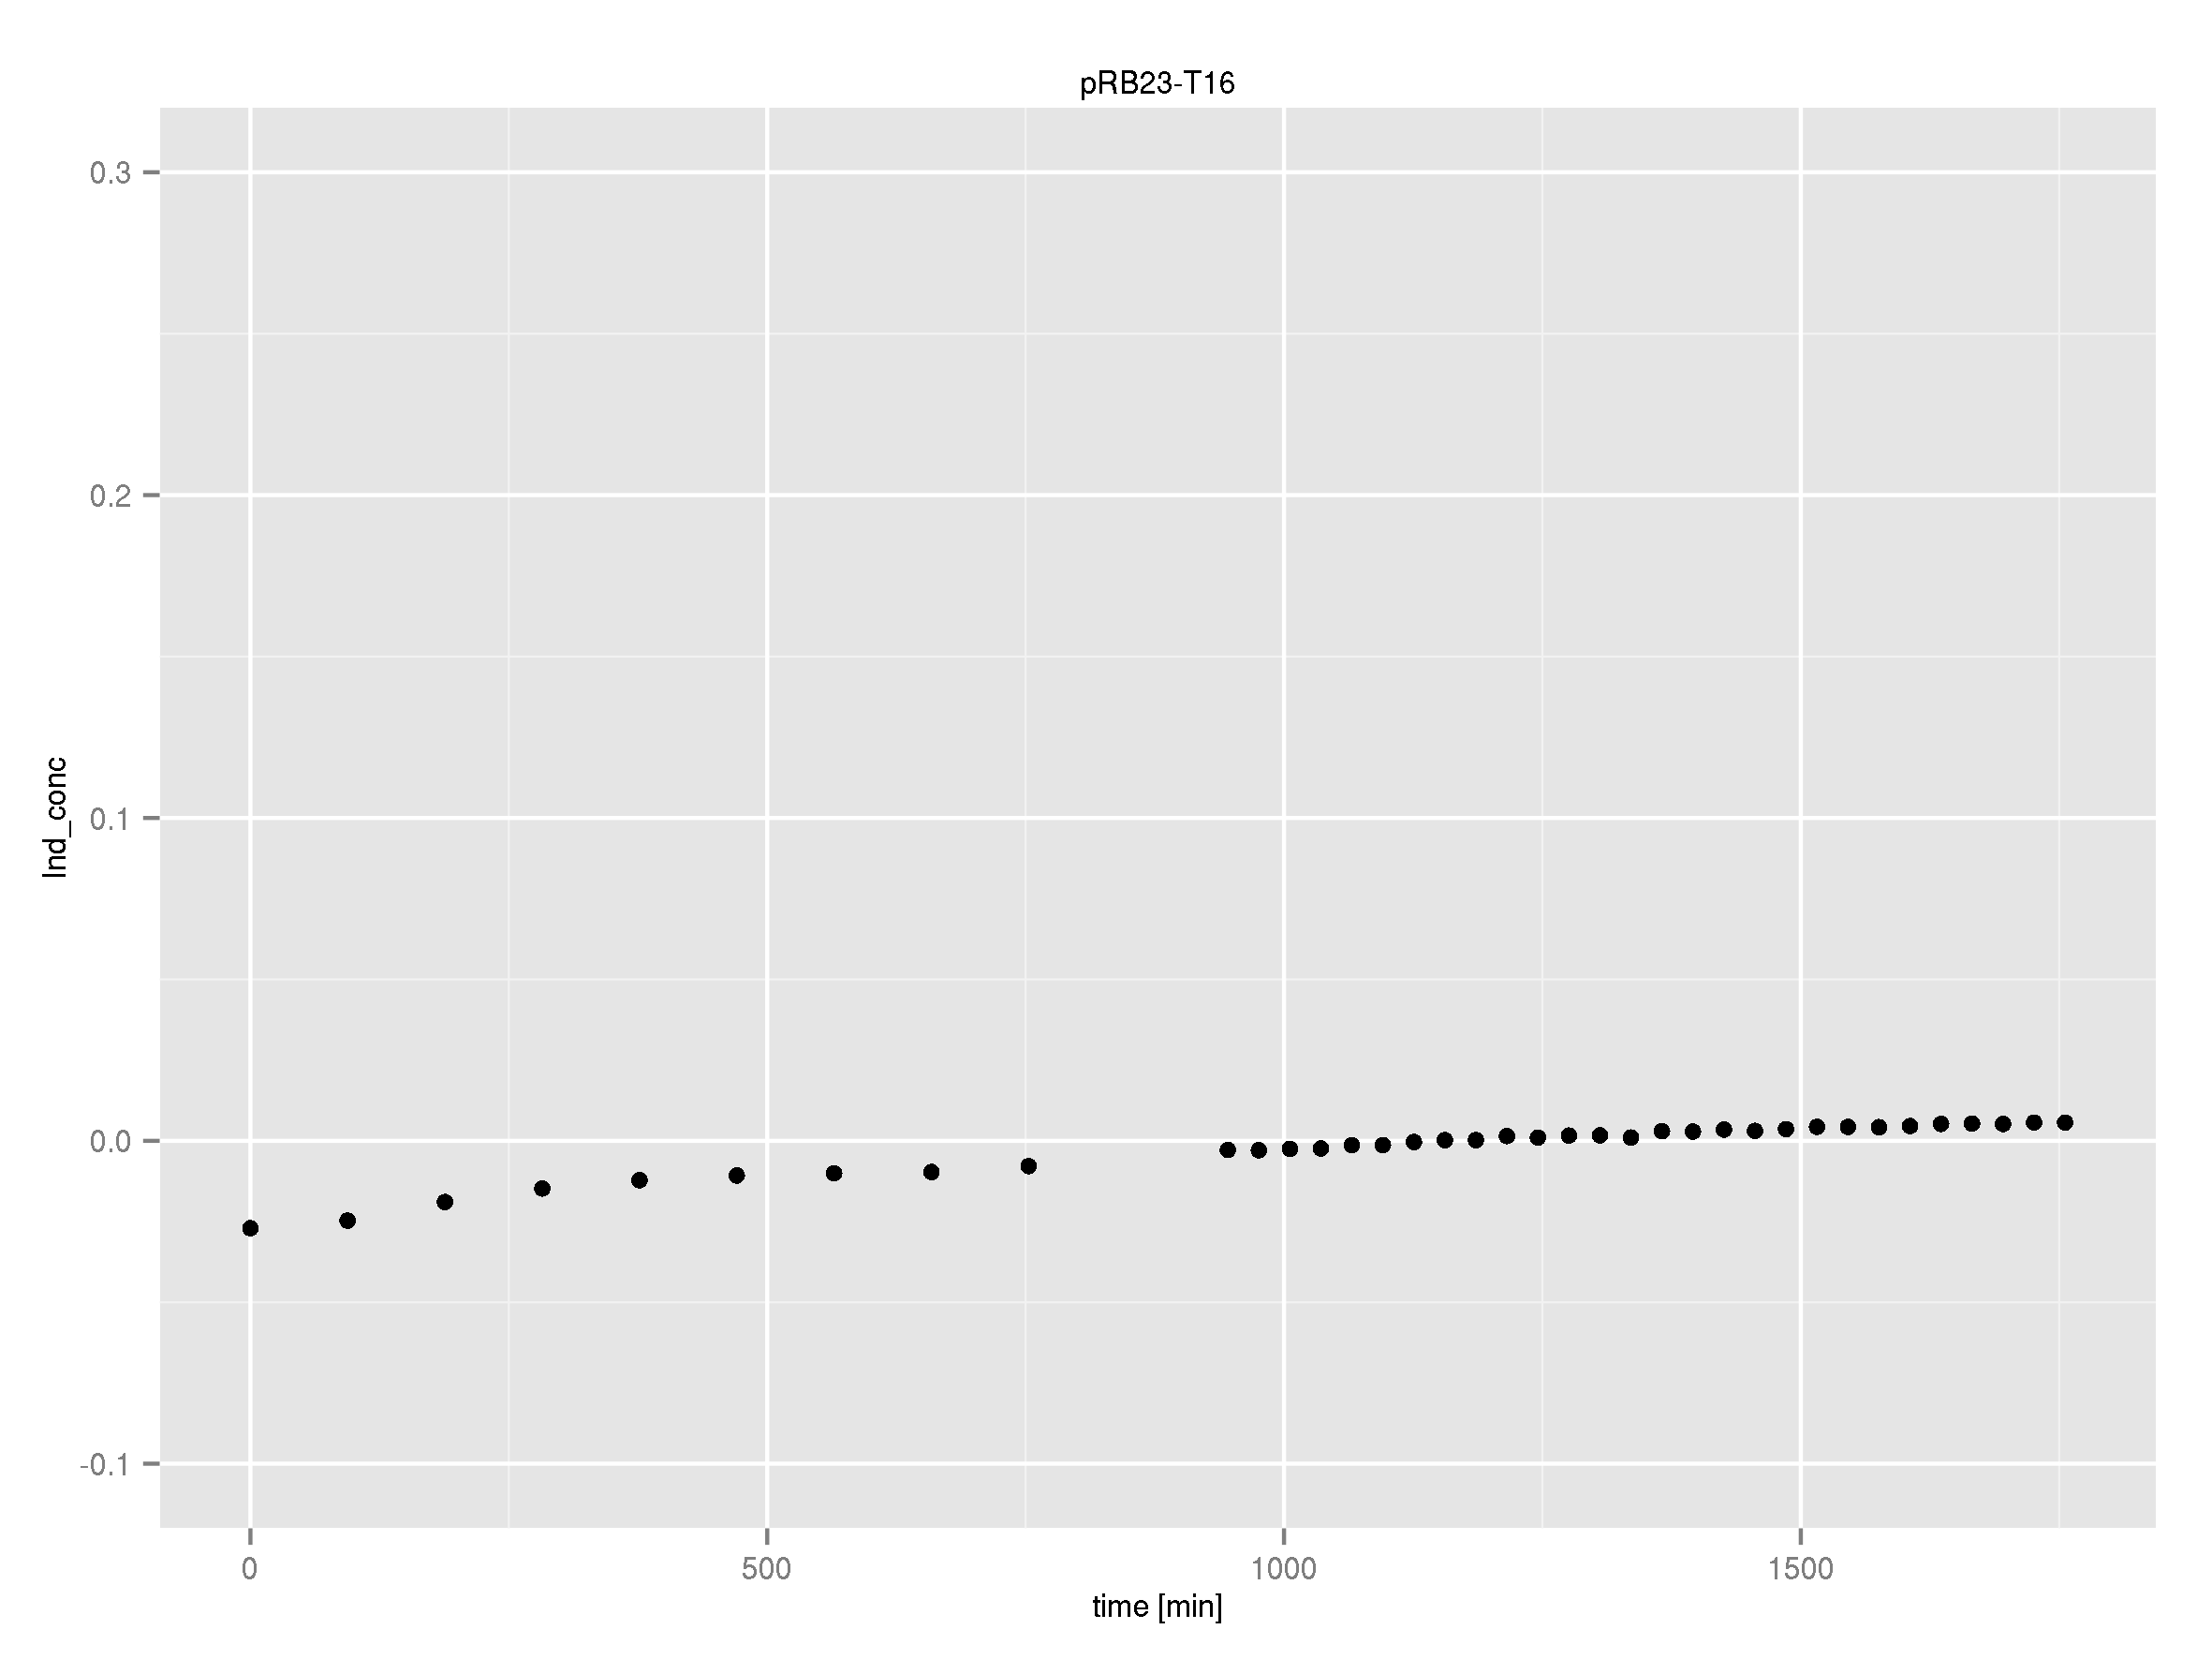
We created plots showing the OD absorption versus wavelength for all timepoint from 0 to 30 hours (top). The plot down left is the OD590 versus OD800. This plot should be linear for every negative liquid culture which doesn't produce indigoidine. The last plot shows the OD of the indigoidine without the cells versus the OD800 from the liquid culture, thus showing how much indigoidine is produced ind a liquid culture at a specific OD.
 "
"
