 "
"
Team:HokkaidoU Japan/Promoter/Modeling
From 2013.igem.org
Maestro E. coli
Promoter

Modeling
We tried to theoretically predict the strength distribution of 4096 promoters, which were artificially created by random mutation. We followed these 3 steps, referring the previous study[1][2].
- Calculate the binding energy of each promoter and σ-factor using the sequence
- Convert the binding energy to the probability that RNAP binds promoter using the method of statistical mechanics
- Utilizing the binding probability as the transcription efficiency
STEP 1: Calculation of Binding Energy
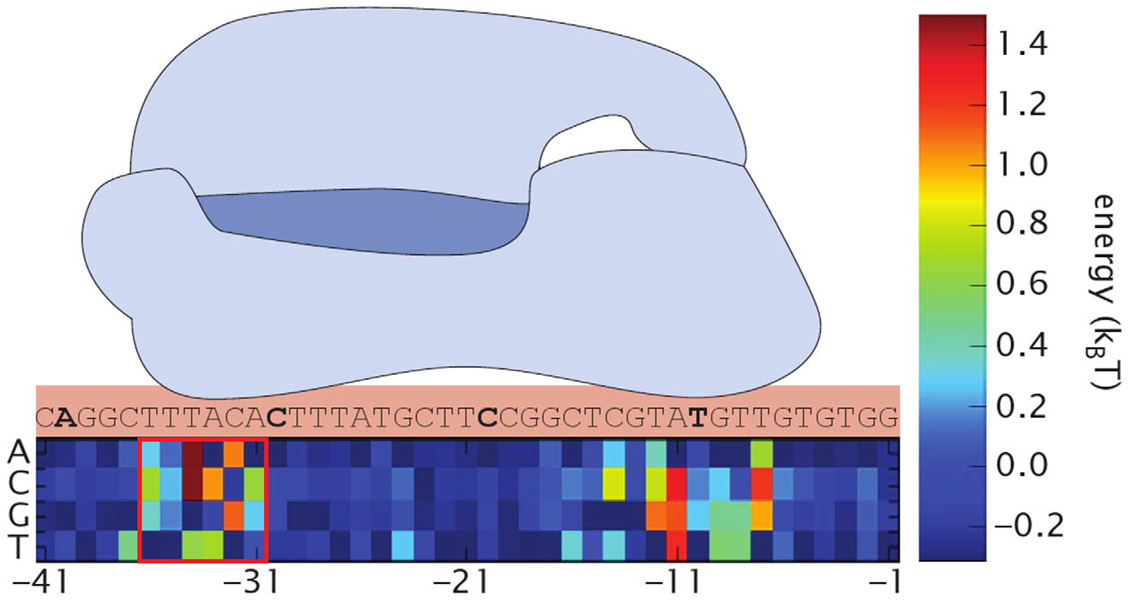
First, we found the binding energy of RNAP and our promoters. As we mutated only -35 region, we only use this region for calculations. Here we define the binding energy $\varepsilon$ as the energy released by RNAP’s binding to promoter. Simply saying, the higher is the binding energy, the stronger is the binding. We referred the data in Kenney, et al.[3] to calculate each binding energy.
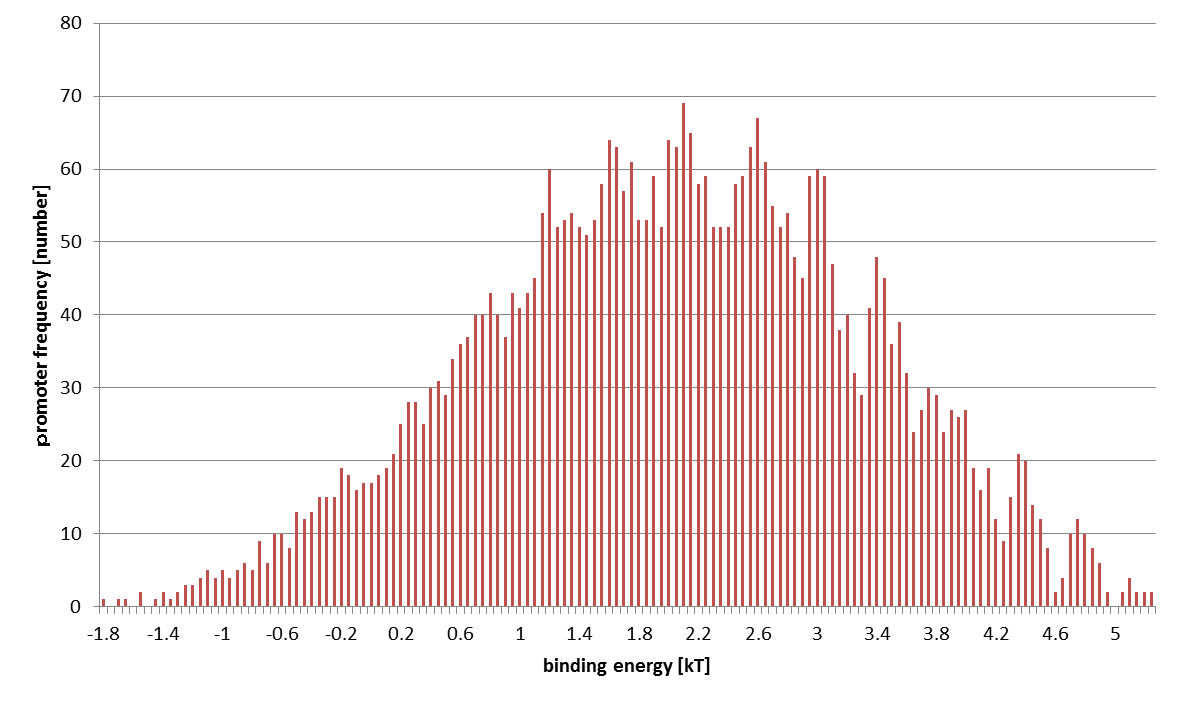
The distribution of computed 4096 promoters' binding energies is shown below. The horizontal axis stands for $\varepsilon$ (at $0.05 k_BT$ intervals) and the vertical axis sample number.
STEP 2: Conversion from Binding Energy to Binding Probability
Next, we estimated the binding probability. On this step, we used the method of statistical mechanics. So we assumed the following.
- The cell is a closed system
- There are $P$ RNAPs bound somewhere on DNA
- The number of bases is $N$ (bp) and $1$ of $N$ bases is +1 position of the promoter
The principle of statistical mechanics is very easy; any state emerges with the same probability. So we counted up the number of state. A state stands for every information of all the particles in the system, so the number is enormous. $W$ represents this number. Here $W$ can be separated as the following. \[ W=W_{\mathrm{unbound}}+W_{\mathrm{bound}} \] $W_{\mathrm{bound}}$ represents the number of state where the promoter is occupied and $W_{\mathrm{unbound}}$ unoccupied.
The purpose of this step is to find the ratio $W_{\mathrm{unbound}}:W_{\mathrm{bound}}$. Concerning the position of RNAP, \begin{align*} W_{\mathrm{unbound}}:W_{\mathrm{bound}}&=\frac{(N-1)!}{P!(N-P-1)!}\times W_{\mathrm{R}}(E):1 \times \frac{(N-1)!}{(P-1)!(N-P)!}\times W_{\mathrm{R}}(E+\varepsilon) \\ &=1:\frac{P}{N-P} \times \frac{W_{\mathrm{R}}(E+\varepsilon)}{W_{\mathrm{R}}(E)} \end{align*} where $W_{\mathrm{R}}$ represents the number of state in reservoir system (a system excluding the imformation of RNAP's position). $W_{\mathrm{R}}$ is a function of internal energy. Then, we converted $W_{\mathrm{R}}$ to entropy $S$ using the conversion formula: $S \equiv k_B \ln{W}$ ($k_B$ stands for Boltzmann constant, $\approx 1.38\times 10^{-23} \mathrm{J\cdot K^{-1}}$). \begin{align*} &=1:\frac{P}{N-P} \times \frac{\exp\left(\frac{S(E+\varepsilon)}{k_B}\right)}{\exp\left(\frac{S(E)}{k_B}\right)} \\ &=1:\frac{P}{N-P} \times \exp\left(\frac{S(E+\varepsilon)-S(E)}{k_B}\right) \\ &\approx 1:\frac{P}{N} \times \exp\left(\frac{\varepsilon \frac{\partial S}{\partial E}}{k_B}\right) \end{align*} Entropy $S$ and energy $E$ is connected as temperature $T$ as the following. \[ \frac{\partial S}{\partial E} \equiv \frac{1}{T} \] So, \[ W_{\mathrm{unbound}}:W_{\mathrm{bound}} \approx 1:\frac{P}{N} \times \exp\left(\frac{\varepsilon}{k_BT}\right) \] This is a final form of this calculation. Approximately the binding energy of -35 region is exponentially proportional to the binding probability.
STEP 3: Conclusion
The last step is to convert the binding probability to the transcription efficiency. Let us assume these suppositions.
- RNAP bound to promoter promptly initiate transcription
- There is no "traffic jam" of RNAPs on DNA (i. e., RNAP's transcription initiation is rate-limiting)
These assumptions mean that we can directly use the value of binding probability as transcription energy in an arbitrary unit. In this way, we get following conclusive result.
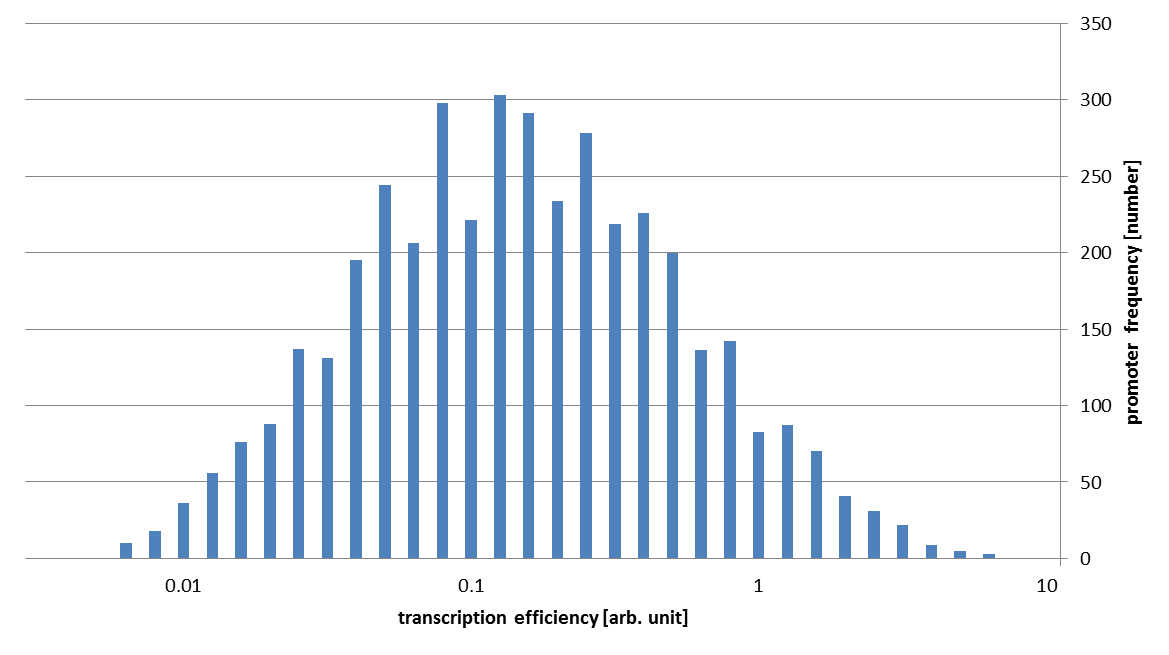
As you can see in this figure, the strengths of our promoter families vary about 1000 fold!
- Rob Phillips, Jane Kondev and Julie Theriot. (2008). Physical Biology of the Cell. Garland Science.
- Brewster, et al. (2012). Tuning promoter strength through RNA polymerase binding site design in Escherichia coli. PLoS computational biology.
- Kenney, et al. (2010). Using deep sequencing to characterize the biophysical mechanism of a transcriptional regulatory sequence. Proceeding of the National Academy of Sciences of the United States of America.

