Team:Nevada/project/results
From 2013.igem.org
| (One intermediate revision not shown) | |||
| Line 6: | Line 6: | ||
The PCR results are as shown | The PCR results are as shown | ||
| - | [[File: | + | [[File:NV_results_1.jpg|center]] |
Figure 1: A 1.2% agarose gel showing PCR amplicons of 519 bp for Xp15 endolysin (Lane 5, targets Xanthamonus campesteris) and a 714 bp for Lys 103 endolysin (Lane 6, targets Erwnia). Lane 1 contains the 1 kb (+) ladder (Invitrogen). Results show that the amplification of these genes was successful. | Figure 1: A 1.2% agarose gel showing PCR amplicons of 519 bp for Xp15 endolysin (Lane 5, targets Xanthamonus campesteris) and a 714 bp for Lys 103 endolysin (Lane 6, targets Erwnia). Lane 1 contains the 1 kb (+) ladder (Invitrogen). Results show that the amplification of these genes was successful. | ||
| Line 20: | Line 20: | ||
| - | [[File:nvresults4. | + | [[File:nvresults4.jpg|center]] |
Figure 4: Colony check for Kz144 endolysin demonstrating positive colonies for lanes 3-5 and 7-9. Lane 1 contains the 1 kb (+) ladder (Invitrogen). | Figure 4: Colony check for Kz144 endolysin demonstrating positive colonies for lanes 3-5 and 7-9. Lane 1 contains the 1 kb (+) ladder (Invitrogen). | ||
| Line 28: | Line 28: | ||
| - | [[File:nvresults5. | + | [[File:nvresults5.jpg|center]] |
Figure 5: Protein expression of Xp15 endolysin demonstrating the recovery of purified full length protein and dimers. Monomer protein is shown in lanes 3-9 as a 19.7 kD band. Lanes 4-6 also contain the dimer form of the protein. Lane 2 contains supernatant from the unpurified lysed culture expressing Lys 103. Lanes 10-11 contain supernatant from the uninduced control and lane 1 contains Novex pre-stained protein standards. | Figure 5: Protein expression of Xp15 endolysin demonstrating the recovery of purified full length protein and dimers. Monomer protein is shown in lanes 3-9 as a 19.7 kD band. Lanes 4-6 also contain the dimer form of the protein. Lane 2 contains supernatant from the unpurified lysed culture expressing Lys 103. Lanes 10-11 contain supernatant from the uninduced control and lane 1 contains Novex pre-stained protein standards. | ||
| - | [[File:nvresults6. | + | [[File:nvresults6.jpg|center]] |
Figure 6: Protein expression of Kz144 endolysin demonstrating the recovery of purified full length protein of 29 kD in lanes 4-8. Lane 2 contains supernatant from the unpurified lysed Kz144 culture and Lane 1 contains Novex pre-stained protein standards. | Figure 6: Protein expression of Kz144 endolysin demonstrating the recovery of purified full length protein of 29 kD in lanes 4-8. Lane 2 contains supernatant from the unpurified lysed Kz144 culture and Lane 1 contains Novex pre-stained protein standards. | ||
| - | [[File:nvresults7. | + | [[File:nvresults7.jpg|center]] |
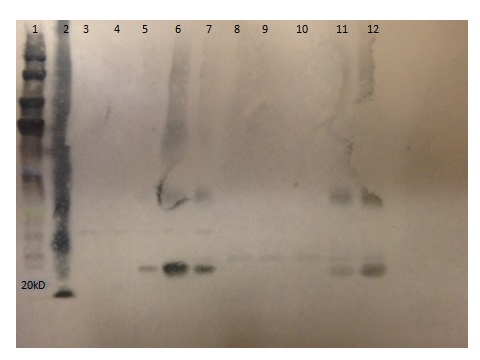
Figure 7: Protein expression of Lys 103 endolysin demonstrating the recovery of the 26.6 kD purified full length protein. Lane 5 contains unpurified supernant. Lane 6 contain unpurified pellet. Lane 7-10 is flow through from column wash. Lanes 11-12 is purified Lys 103. Lane 1 contains Bio-Rad Pre-stained protein standards. Lane 2 is a positive control of Xp15 at 19.7 kD. Lanes 3-4 are negative controls of supernatant and pellet of uninduced bacteria. | Figure 7: Protein expression of Lys 103 endolysin demonstrating the recovery of the 26.6 kD purified full length protein. Lane 5 contains unpurified supernant. Lane 6 contain unpurified pellet. Lane 7-10 is flow through from column wash. Lanes 11-12 is purified Lys 103. Lane 1 contains Bio-Rad Pre-stained protein standards. Lane 2 is a positive control of Xp15 at 19.7 kD. Lanes 3-4 are negative controls of supernatant and pellet of uninduced bacteria. | ||
Latest revision as of 03:47, 28 September 2013


Part 1: Molecular Cloning
Genescript was used to synthesize the three endolysin genes (Kz144, Lyz 103, and Xp15) with codon optimization for E. coli. We took these genes and transformed E. coli cells, and then did polymerase chain reaction to amplify the gene only to be TOPOcloned into pBAD.
The PCR results are as shown
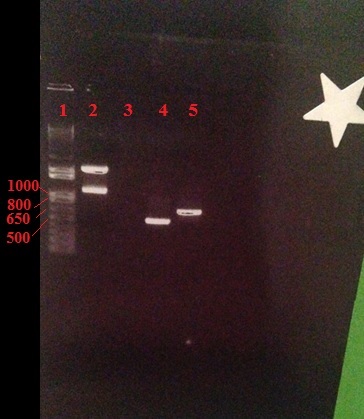
Figure 1: A 1.2% agarose gel showing PCR amplicons of 519 bp for Xp15 endolysin (Lane 5, targets Xanthamonus campesteris) and a 714 bp for Lys 103 endolysin (Lane 6, targets Erwnia). Lane 1 contains the 1 kb (+) ladder (Invitrogen). Results show that the amplification of these genes was successful.
Figure 2: A 2% agarose gel showing a PCR amplicon of 833bp for Kz144 endolysin (Lane 2, targets various Pseudomonas species including Pseudomonas syringae). Lane 1 contains the 1 kb (+) ladder (Invitrogen). Results show that the amplification of the Kz144 gene was successful.
After cloning the three endolysins into the pBAD expression vector, a colony check was performed to determine which colonies contained the genes for the three endolysin. The experiment was designed to use a forward primer from pBAD and a reverse pimer from the specific endolysin gene.
Figure 3: Colony check for Lys 103 endolysin demonstrating a positive colony in top row, lane 9 and Xp15 bottom rows lanes 4, 8 and 9. Lane 1 contains the 1 kb (+) ladder (Invitrogen).
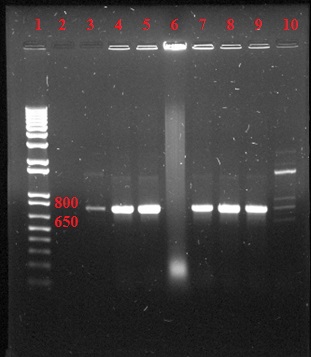
Figure 4: Colony check for Kz144 endolysin demonstrating positive colonies for lanes 3-5 and 7-9. Lane 1 contains the 1 kb (+) ladder (Invitrogen).
Part 2 Protein Expression and Purification
The pBAD plasmid containing the endolysin gene was transformed into BL21( DE3) E. coli cells. The engineered cells were induced with L-arabinose to express endolysin proteins. We found that a 20% L-arabinose concentration gave the highest yield for protein expression. Expression and purification was successful for all three endolysin proteins, confirmed with a western blot analysis. To purify the protein, a His-tagged purification column was used (nickel column, Thermo scientific).
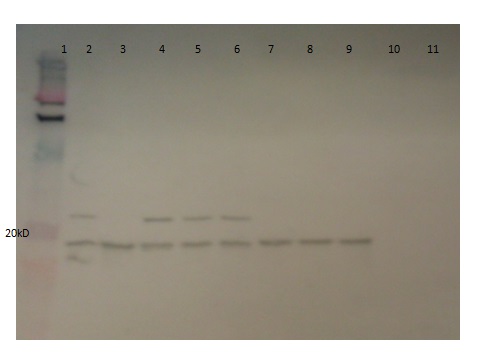
Figure 5: Protein expression of Xp15 endolysin demonstrating the recovery of purified full length protein and dimers. Monomer protein is shown in lanes 3-9 as a 19.7 kD band. Lanes 4-6 also contain the dimer form of the protein. Lane 2 contains supernatant from the unpurified lysed culture expressing Lys 103. Lanes 10-11 contain supernatant from the uninduced control and lane 1 contains Novex pre-stained protein standards.
Figure 6: Protein expression of Kz144 endolysin demonstrating the recovery of purified full length protein of 29 kD in lanes 4-8. Lane 2 contains supernatant from the unpurified lysed Kz144 culture and Lane 1 contains Novex pre-stained protein standards.
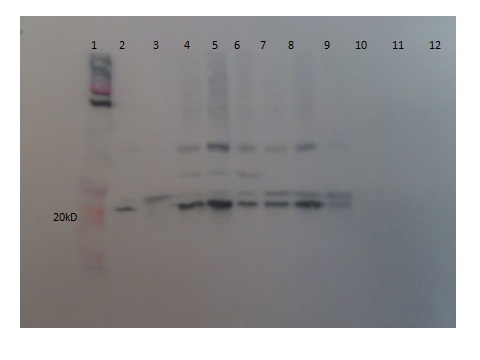
Figure 7: Protein expression of Lys 103 endolysin demonstrating the recovery of the 26.6 kD purified full length protein. Lane 5 contains unpurified supernant. Lane 6 contain unpurified pellet. Lane 7-10 is flow through from column wash. Lanes 11-12 is purified Lys 103. Lane 1 contains Bio-Rad Pre-stained protein standards. Lane 2 is a positive control of Xp15 at 19.7 kD. Lanes 3-4 are negative controls of supernatant and pellet of uninduced bacteria.
Part 3: Protein Activity Assay
Optimizing the Lysis Assay using Lysozyme
We performed the assay from Volckaert’s lab (Lavigne et. al., 2004) to observe the effects of lysozyme on chloroform treated and non-chloroform treated Pseudomonas aeruginosa cells. Pseudomonas aeruginosa cells were first treated with or without chloroform. Chloroform was used to remove the outer membrane on the Pseudomonas bacteria. Our future studies, time permitting, would have been to replace chloroform with a gentle surfactant that would not inactivate the lysozyme or harm the plant. The cells were then treated with or without commercially available lysozyme purchased from Sigma Chemicals. The OD reading of each cell treatment at pH 6 was normalized at time zero to a reading of 0.33 and change in OD was monitored over time. Four conditions were run in triplicate and averaged in the data below. The conditions were untreated (-/-), treated with chloroform only (+/-), treated with lysozyme only (-/+) and treated with both chloroform and lysozyme (+/+).
Data was collected over three hours. Between 0-2 hours, the OD reading decreased by more than 50% in all samples, including the untreated (-/-) control, indicating that cell death was occurring even without treatment. At 2-3 hours the assay showed very minimal changes in OD readings for all samples. The data below show the normalized results after three hours of treatment.
We attempted the assay with using our endolysins and the target bacteria, but to date we have not had success
 "
"
