 "
"
Team:TU Darmstadt/result
From 2013.igem.org
| Line 137: | Line 137: | ||
clearly see the overlap between donor and acceptor in an optimal FRET system. <br><br> | clearly see the overlap between donor and acceptor in an optimal FRET system. <br><br> | ||
| - | <center><img alt="Spectra" src="/wiki/images/6/6c/ShcherbakovaSpectra.png" width=" | + | <center><img alt="Spectra" src="/wiki/images/6/6c/ShcherbakovaSpectra.png" width="400" height="349"></center> <br> |
| - | Excitation and emission spectra overlay of donor LSSmOrange and acceptor mKate2[1] | + | Caption:Excitation and emission spectra overlay of donor LSSmOrange and acceptor mKate2[1] |
(dashed line = excitation spectrum, solid line = emission spectrum)<br><br> | (dashed line = excitation spectrum, solid line = emission spectrum)<br><br> | ||
</body> | </body> | ||
</html> | </html> | ||
Revision as of 16:40, 3 October 2013
Our results
LSSmOrange:
LSSmOrange is an orange fluorescent protein that we want to use for FRET, we us it as a donor. In an
actual paper Daria M. Shcherbakova[1] showed that LSSmOrange has an excitation maximum by
437 nm and an emission maximum by 572 nm.
In the following diagram (figure 1) one can see our results with our own expressed LSSmOrange. The
colored dots show the different maximums. The excitation maximum is at 415 nm, another at 453 nm
and our measured emission maximum is at 564 nm. This aberration changes nothing
on the FRET system. The excitation maximum is big enough to stimulate mKate, the other fluorescent
protein. Of course, we checked also the emission and excitation of our Bl21DE3 cells (data
not shown) and we can eliminate the theories that these cells disturb this florescence measurement.
Graph"Bl21DE3pLys[pBR-IBA2-Lssmorange]"
Caption: Excitation Spectrum (dashed line) and emission spectrum (solid line) from
LssmOrange with marked maximums.
mKate:
mKate2 is a red fluorescent protein that we want to use as a acceptor for FRET. According to Evrogen[2]
mKate2 has an excitation maximum at 588 nm and an emission maximum T 633 nm. The
diagram below (Figure 2, colored dots) shows that the excitation maximum is at 579 nm and the
emission maximum is 611 nm. The first peak does not look exactly like a single peak, but we can see a
clear maximum. The problem for our FRET system is the very low intensity which results
in the next diagram (figure 3) in a huge difference of intensity of the two fluorescence
proteins.
Graph"Bl21DE3pLys[pBR-IBA2-mKate]"
Caption:Excitation Spectrum (dashed line) and emission spectrum (solid line) of
mKate with marked maximums.
FRET:
Both diagrams in an overlay shows us the FRET system. LSSmOrange is the donor and mKate is the
acceptor. For an optimum in FRET, it should display a stronger overlap between the emission maximum of LssmOrange and the excitation maximum of mKate.
Graph"FRET pair LSSmOrange-mKate"
Caption:Overlay of figure 1 and figure 2.
The next figure is from the paper of M. Shcherbakova. In this figure one can
clearly see the overlap between donor and acceptor in an optimal FRET system.
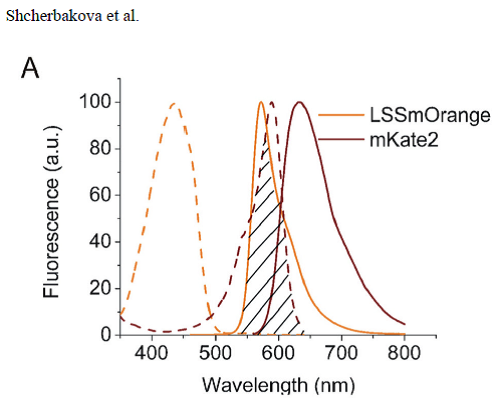
Caption:Excitation and emission spectra overlay of donor LSSmOrange and acceptor mKate2[1] (dashed line = excitation spectrum, solid line = emission spectrum)