Team:DTU-Denmark/Notebook/7 August 2013
From 2013.igem.org
(→Main purpose) |
(→Conclusion) |
||
| (33 intermediate revisions not shown) | |||
| Line 1: | Line 1: | ||
{{:Team:DTU-Denmark/Templates/StartPage|7 August 2013}} | {{:Team:DTU-Denmark/Templates/StartPage|7 August 2013}} | ||
| - | + | Navigate to the [[Team:DTU-Denmark/Notebook/6_August_2013|Previous]] or the [[Team:DTU-Denmark/Notebook/8_August_2013|Next]] Entry | |
| - | = | + | =Lab 208= |
<hr/> | <hr/> | ||
==Main purpose== | ==Main purpose== | ||
<hr/> | <hr/> | ||
| + | * PCR for SPL and Ref (reference promoter) | ||
| + | * PCR for AMO with USER endings | ||
| + | * High yield plasmids purification of cycAX, Sec2, TAT2-1, TAT3-2 and TAT3-1a. | ||
| + | * Gel purification of AMO, araBAD promoter and Nir2. | ||
| + | * USER reaction on araBAD inducible promoter and pZA21 without native promoter containing GFP Sf | ||
| + | * more PCR | ||
==Who was in the lab== | ==Who was in the lab== | ||
| Line 14: | Line 20: | ||
===PCR for SPL and Ref (reference promoter)=== | ===PCR for SPL and Ref (reference promoter)=== | ||
| - | template: | + | template: pZA21 with RFP; |
primers for SLP: 52a, 52b1; | primers for SLP: 52a, 52b1; | ||
| Line 97: | Line 103: | ||
[[File:2013-08-07 ara nir2 puri.jpg|600px]] | [[File:2013-08-07 ara nir2 puri.jpg|600px]] | ||
| - | = | + | |
| + | =Lab 115= | ||
<hr/> | <hr/> | ||
==Main purpose== | ==Main purpose== | ||
<hr/> | <hr/> | ||
| - | Run | + | Run [[Team:DTU-Denmark/Experiment2|Experiment 2]] anaerobically in order to characterize the behavior of ''P. aeruginosa'' |
| - | anaerobically in order to characterize the behavior of P.aeruginosa | + | |
==Who was in the lab== | ==Who was in the lab== | ||
| Line 112: | Line 118: | ||
<hr/> | <hr/> | ||
| - | + | Adjusting the temperature at 37 degrees and calibrating the probes as described in Appendix 5. | |
| - | == | + | |
| + | Following the protocol [[Team:DTU-Denmark/Methods/Determining_concentration_of_nitrogen_compounds/Experiment_2|Experiment 2]] | ||
| + | |||
| + | Changing the steps : | ||
| + | |||
| + | 6. 2 ml of the overnight culture in 100 ml of medium. | ||
| + | |||
| + | 7. Grow the cells for about 4 hours where the OD was measured ...... in 500 nm wavelength setup instead of 600 nm. | ||
| + | |||
| + | 8. We didn't cool down the centrifuge because the experiment had to be done in 37 degrees. | ||
| + | |||
| + | 11. The volume was 140 ml instead of 200 ml. | ||
| + | |||
| + | 12. The OD was measured 0.1195 instead of 0.3. | ||
| + | |||
| + | 19. Add 0.5 ml of nitrite solution and continue by adding 1 ml after 10 minutes then we took 1.8 ml of sample, we added then 0.5 ml and afterwards when there was any change in the curve we spiked with 0.9 ml of nitrite. We took 2.3 ml for sample in the end and another 2 ml for OD measurement where OD=0.1105. | ||
| + | |||
| + | The temperature in the end was 40.5 degrees C and not 37. | ||
| + | |||
| + | ==Results== | ||
<hr/> | <hr/> | ||
| + | |||
| + | ===Colorimetric results=== | ||
| + | '''Ammonium''' | ||
| + | |||
| + | ''Measuring range 2-75 mg/L NH<sub>4</sub>-N'' | ||
| + | |||
| + | start point- signal <2 mg/L | ||
| + | |||
| + | middle point- signal <2 mg/L | ||
| + | |||
| + | end point- signal <2 mg/L but 1.8 mg/L | ||
| + | |||
| + | |||
| + | '''Nitrate''' | ||
| + | |||
| + | ''Measuring range 1-25 mg/L NO<sub>3</sub>-N'' | ||
| + | |||
| + | start point- signal <1 mg/L | ||
| + | |||
| + | middle point- signal <1 mg/L | ||
| + | |||
| + | end point- signal 0.4 mg/L | ||
| + | |||
| + | |||
| + | '''Nitrite''' | ||
| + | |||
| + | ''Measuring range 0.02-1 mg/L NO<sub>2</sub>-N'' | ||
| + | |||
| + | start point- signal 0.07 mg/L | ||
| + | |||
| + | middle point- signal 0.57 mg/L after X10 dilution | ||
| + | |||
| + | end point- signal 0.47 mg/L after X10 dilution | ||
| + | |||
| + | |||
| + | === N<sub>2</sub>O measurements about ''P. aeruginosa'' === | ||
| + | |||
| + | [[File:Dtu pseudo exp.png|600px]] | ||
| + | |||
| + | ==Conclusion== | ||
| + | We were not able to see a response. | ||
| + | |||
Navigate to the [[Team:DTU-Denmark/Notebook/6_August_2013|Previous]] or the [[Team:DTU-Denmark/Notebook/8_August_2013|Next]] Entry | Navigate to the [[Team:DTU-Denmark/Notebook/6_August_2013|Previous]] or the [[Team:DTU-Denmark/Notebook/8_August_2013|Next]] Entry | ||
{{:Team:DTU-Denmark/Templates/EndPage}} | {{:Team:DTU-Denmark/Templates/EndPage}} | ||
Latest revision as of 11:53, 4 October 2013
7 August 2013
Contents |
Lab 208
Main purpose
- PCR for SPL and Ref (reference promoter)
- PCR for AMO with USER endings
- High yield plasmids purification of cycAX, Sec2, TAT2-1, TAT3-2 and TAT3-1a.
- Gel purification of AMO, araBAD promoter and Nir2.
- USER reaction on araBAD inducible promoter and pZA21 without native promoter containing GFP Sf
- more PCR
Who was in the lab
Kristian, Gosia, Julia, Henrike
Procedure
PCR for SPL and Ref (reference promoter)
template: pZA21 with RFP;
primers for SLP: 52a, 52b1; primers for Ref: 52a, 52b2;
temperature: 53C, time: 3:00;
Samples:
1 -> SLP + DMSO
2 -> SLP + betaine
3 -> Ref + DSMO
4 -> Ref + betaine
5 -> SLP Negative control + DMSO
6 -> Ref Negative control + betaine
PCR for AMO with USER endings
Midiprep
Purifying plasmids with high yield for sequencing of the samples cycAX, Sec2, TAT2-1, TAT3-2 and TAT3-1a.
Gel purification
Extracted from gel and purified AMO extraction fragment, araBAD promoter and Nir2 extraction fragment. Nir2 was treated according to protocol for fragments bigger 4kb, the others as fragments between 100bp and 4kb.
USER reaction
Performed USER ligation on araBAD inducible promoter and pZA21 without native promoter containing GFP Sf respective RFP following the standard protocol (I assume).
more PCR
Results
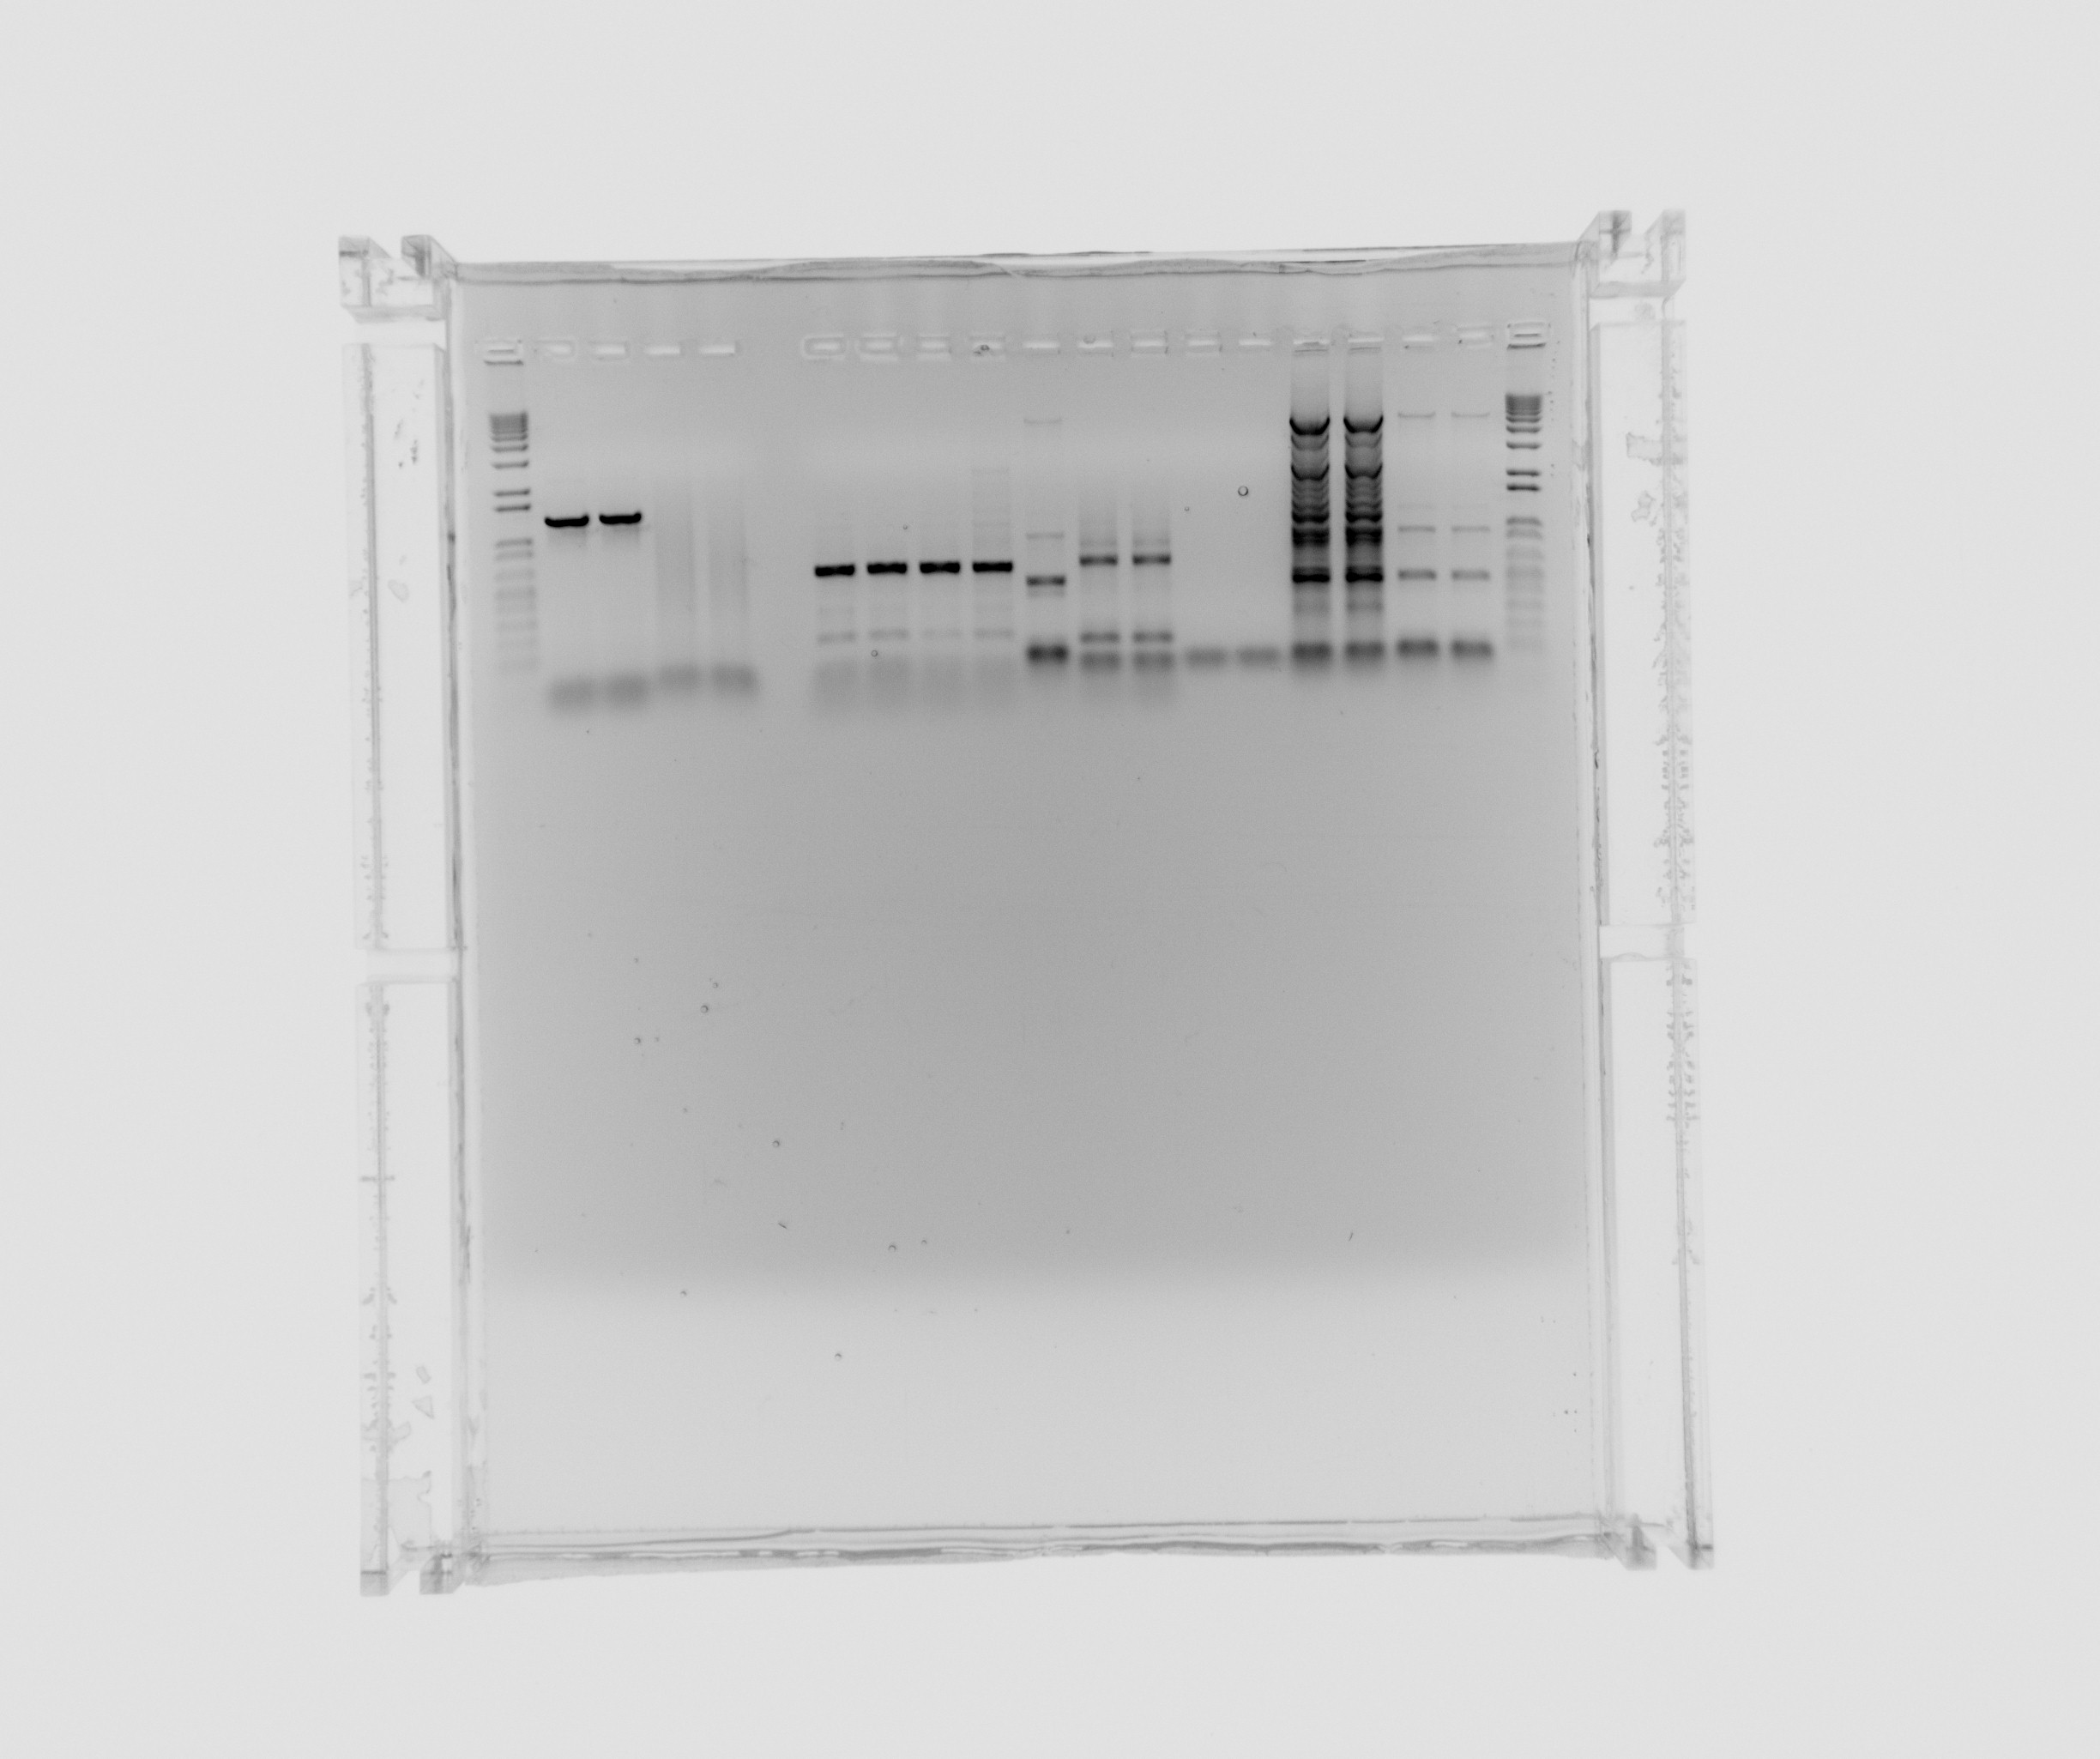
Gel on yesterdays PCR
ara, SPL is from yesterdays PCR with 5% DMSO, Nir and the sample numbers is also from yesterday, here the composition can be seen.
- ara
- ara
- SPL
- SPL
- Nir 0 MgCl2
- Nir 1uL MgCl2
- Nir 5uL MgCl2
- Nir 20uL MgCl2
- 12 - Nir2, extraction PCR, primers 42a, 42b, cells in water, plus MgCl2 additive, x7 polymerase
- 13 - Nir1 with USER primers, primers 39a, 39b, x7, template - Nir purified from gel
- 14 - Nir1 with USER primers, primers 39a, 39b, x7, template - Nir purified from gel
- 15 - check Nir1 with primers for NirM+S, primers 11a, 44, template - Nir purified from gel, Phusion polymerase
- 16 - check Nir1 with primers for NirM+S, primers 11a, 44, template - Nir purified from gel, Phusion polymerase
- 7 - Nir2, extraction PCR, primers 42a, 42b, cells in water, Phusion polymerase
- 8 - Nir2, extraction PCR, primers 42a, 42b, cells in water, Phusion polymerase
- 9 - Nir2, extraction PCR, primers 42a, 42b, cells in water, x7 polymerase
- 10 - Nir2, extraction PCR, primers 42a, 42b, cells in water, x7 polymerase
not on the gel: 11 - Nir2, extraction PCR, primers 42a, 42b, cells in water, plus MgCl2 additive, Phusion polymerase
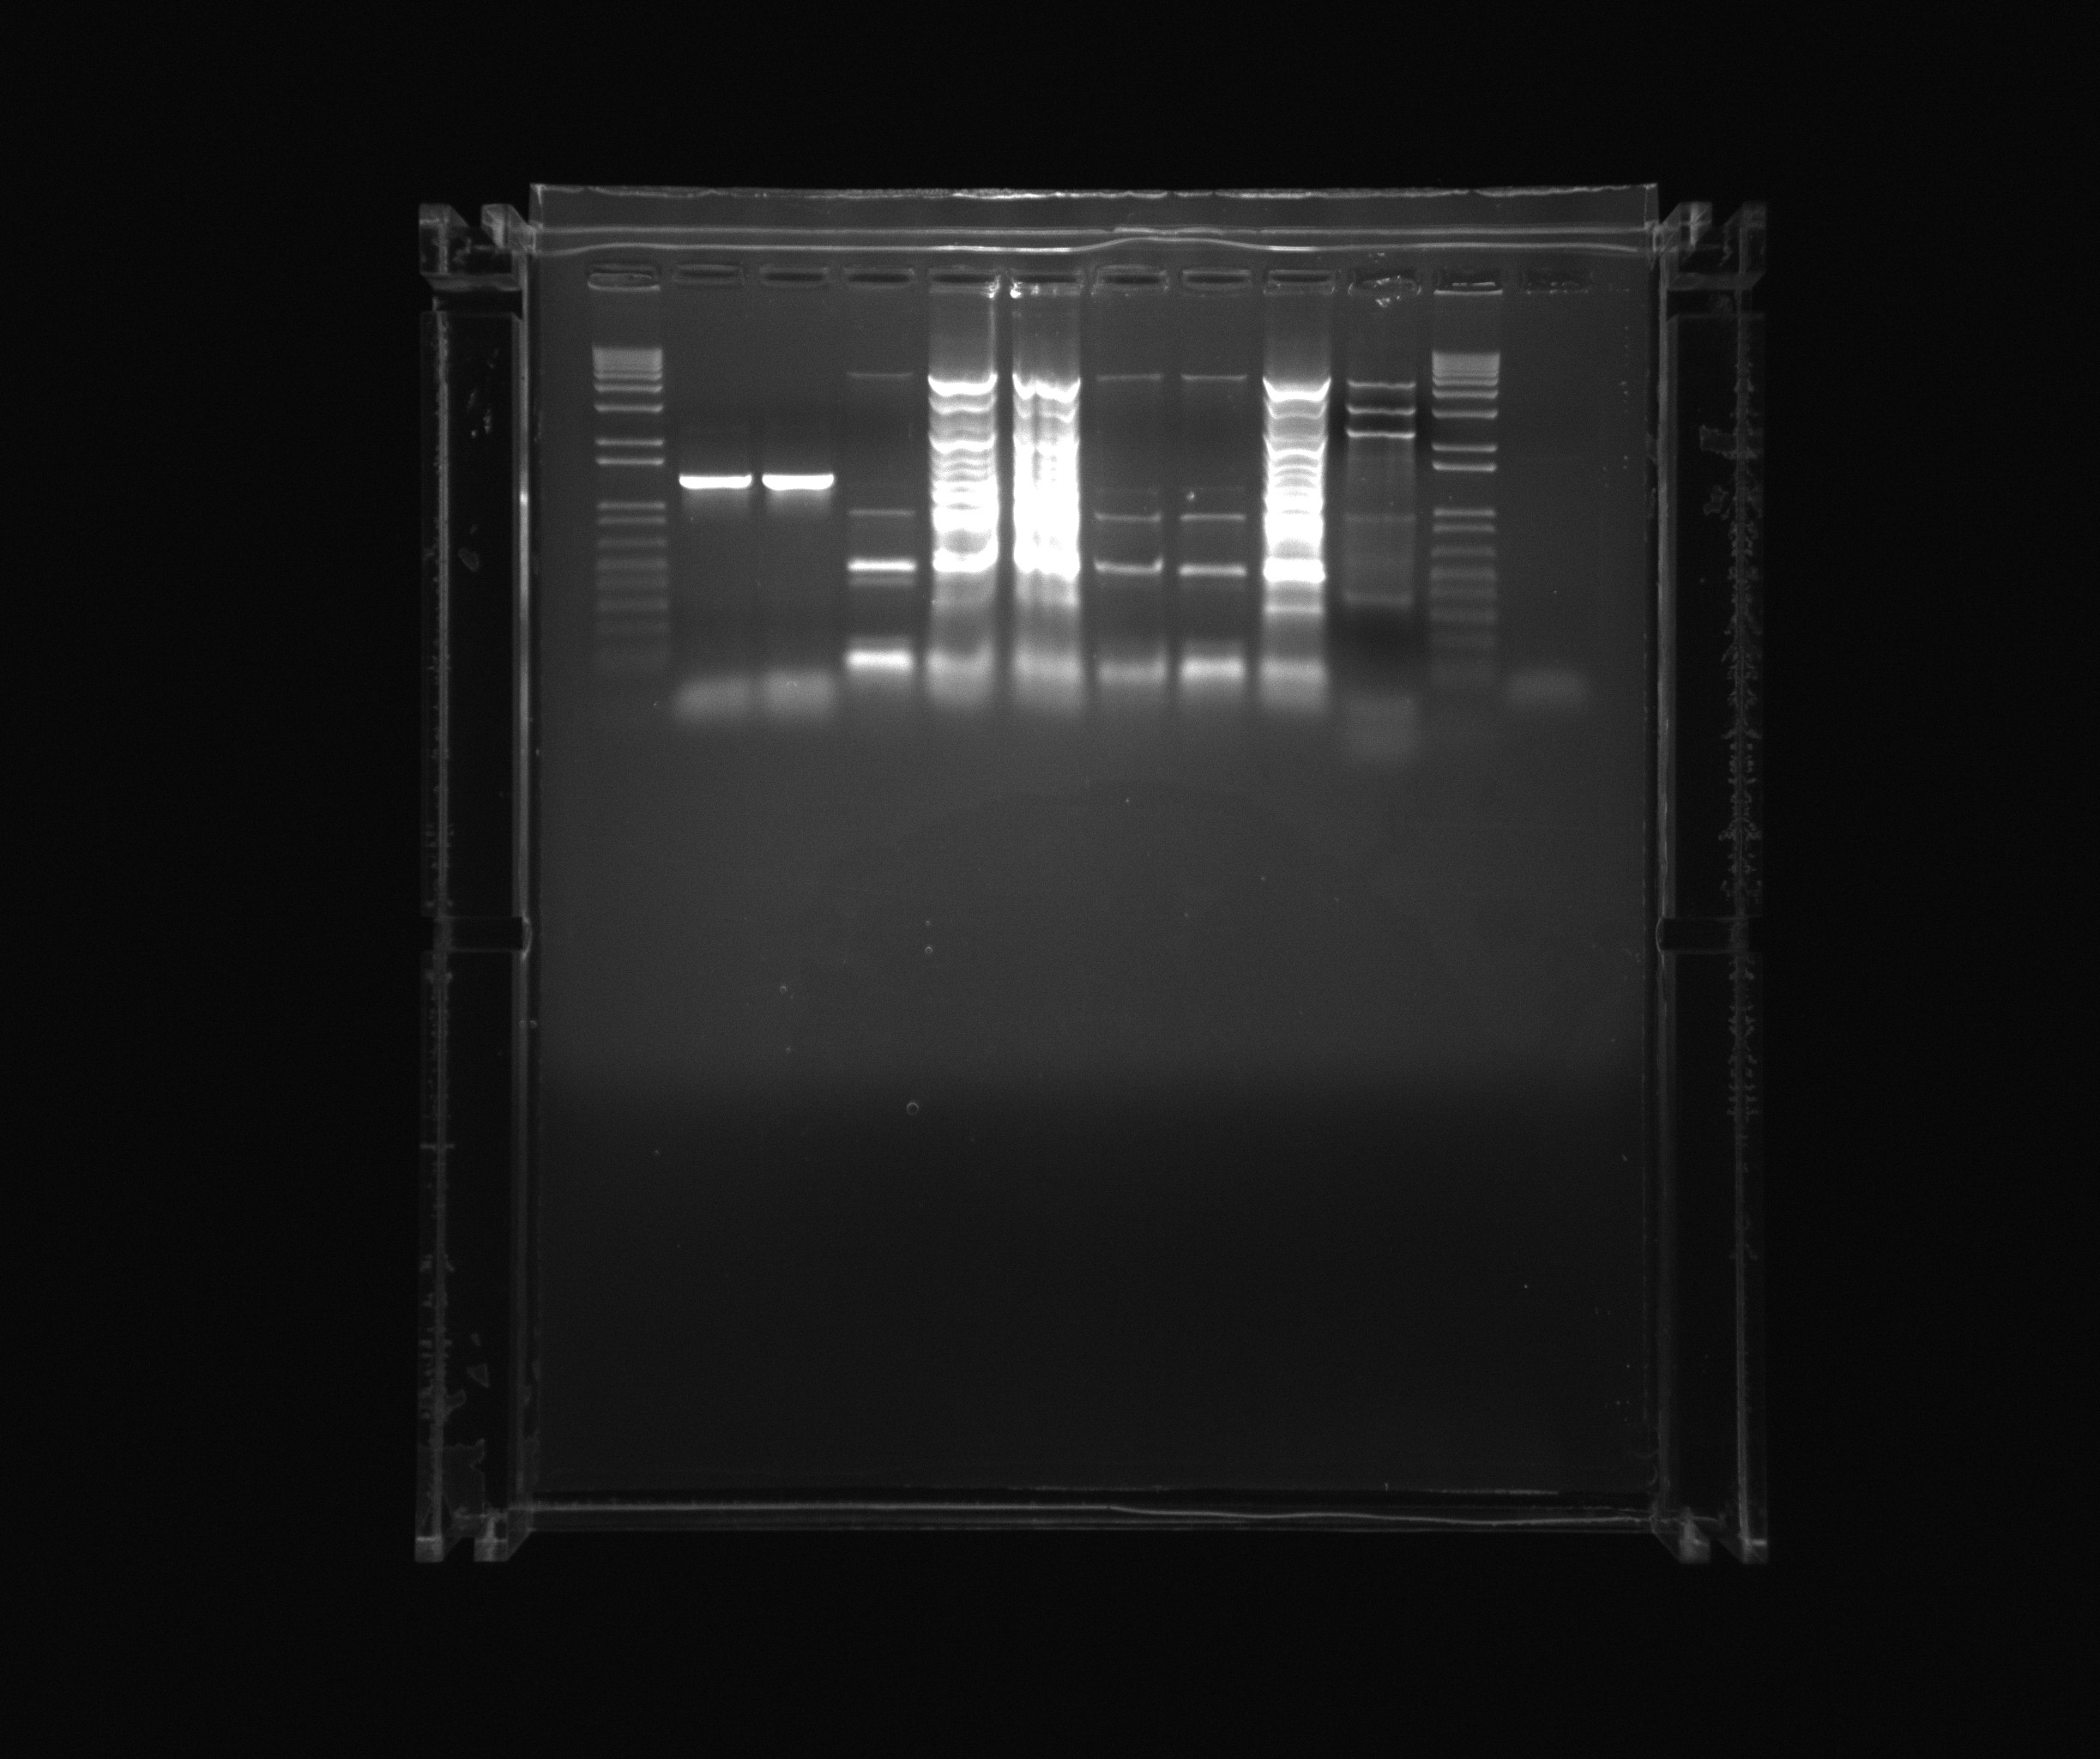
Decided to purify ara and Nir2 (from 12, 7, 8, 9 and 10) and analyse sample 11 (Nir2).
Purification gel
- 1 kb ladder
- ara
- ara
- 12
- 7
- 8
- 9
- 10
- 11
- Nir colony PCR X7
- 1 kb
Lab 115
Main purpose
Run Experiment 2 anaerobically in order to characterize the behavior of P. aeruginosa
Who was in the lab
Ariadni, Helen
Procedure
Adjusting the temperature at 37 degrees and calibrating the probes as described in Appendix 5.
Following the protocol Experiment 2
Changing the steps :
6. 2 ml of the overnight culture in 100 ml of medium.
7. Grow the cells for about 4 hours where the OD was measured ...... in 500 nm wavelength setup instead of 600 nm.
8. We didn't cool down the centrifuge because the experiment had to be done in 37 degrees.
11. The volume was 140 ml instead of 200 ml.
12. The OD was measured 0.1195 instead of 0.3.
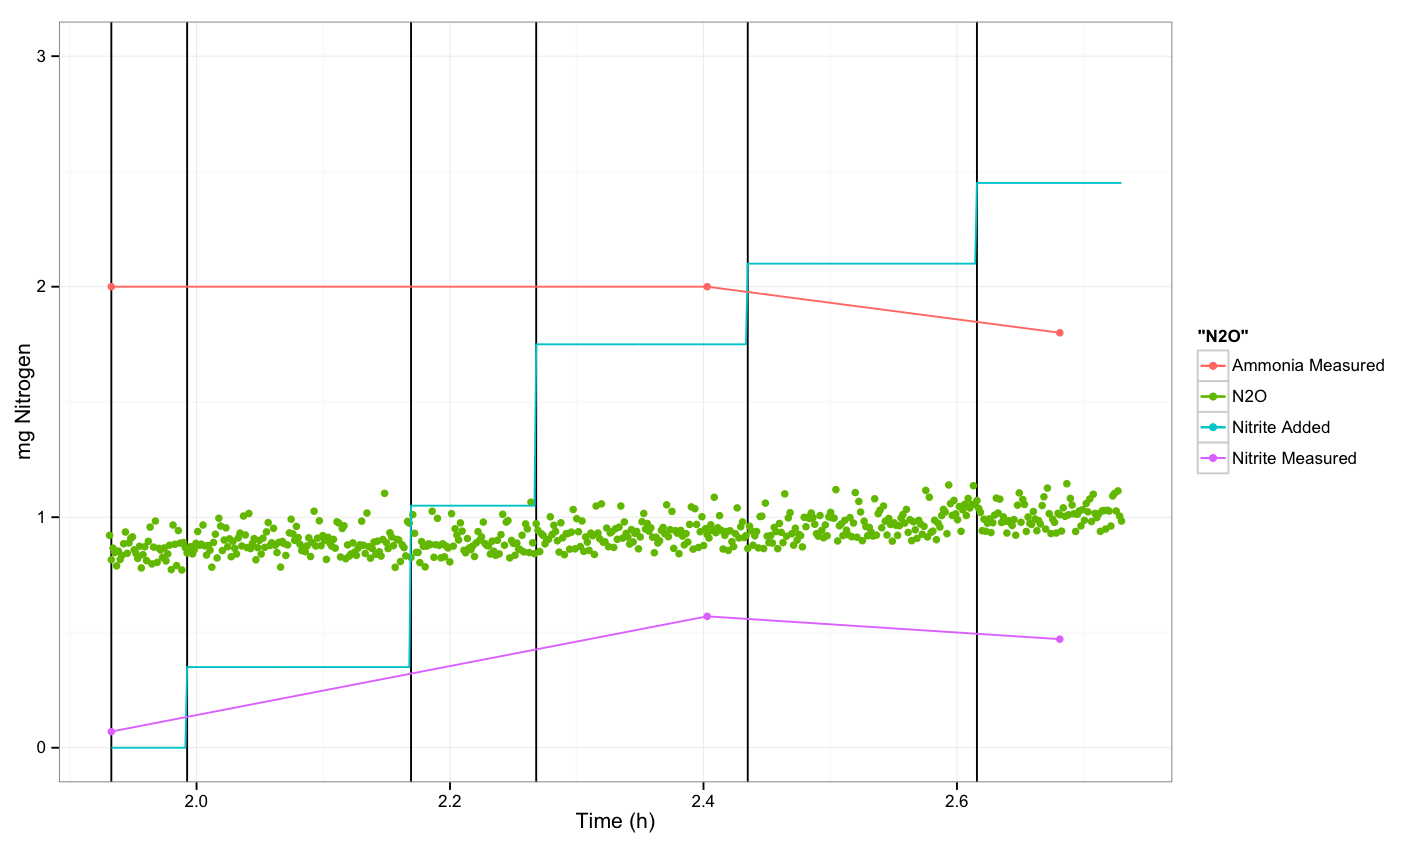
19. Add 0.5 ml of nitrite solution and continue by adding 1 ml after 10 minutes then we took 1.8 ml of sample, we added then 0.5 ml and afterwards when there was any change in the curve we spiked with 0.9 ml of nitrite. We took 2.3 ml for sample in the end and another 2 ml for OD measurement where OD=0.1105.
The temperature in the end was 40.5 degrees C and not 37.
Results
Colorimetric results
Ammonium
Measuring range 2-75 mg/L NH4-N
start point- signal <2 mg/L
middle point- signal <2 mg/L
end point- signal <2 mg/L but 1.8 mg/L
Nitrate
Measuring range 1-25 mg/L NO3-N
start point- signal <1 mg/L
middle point- signal <1 mg/L
end point- signal 0.4 mg/L
Nitrite
Measuring range 0.02-1 mg/L NO2-N
start point- signal 0.07 mg/L
middle point- signal 0.57 mg/L after X10 dilution
end point- signal 0.47 mg/L after X10 dilution
N2O measurements about P. aeruginosa
Conclusion
We were not able to see a response.
Navigate to the Previous or the Next Entry
 "
"


