Team:EPF Lausanne/Results summary

From 2013.igem.org

(Difference between revisions)
(Nanoparticles:)
(Nanoparticles:)
Line 14: Line 14:
[[Image:Team-EPF-Lausanne_results_ELISA-like2.jpg|thumb|250px|left|Figure 2: ELISA-like assay. The high absorbance in wells B and H (containing biotinylated nanoparticles) was quantitatively detected using a plate reader. It showed that the nanoparticles were well biotinylated.]]
[[Image:Team-EPF-Lausanne_results_ELISA-like2.jpg|thumb|250px|left|Figure 2: ELISA-like assay. The high absorbance in wells B and H (containing biotinylated nanoparticles) was quantitatively detected using a plate reader. It showed that the nanoparticles were well biotinylated.]]
-
[[Image:Team-EPF-Lausanne_results_confocal_positive.jpg|thumb|200px|left| Figure 3: Confocal microscopy image showing outer CY5 labeling of the nanoparticles. The size of those nanoparticles is around 200 nm, which corresponds to the previous DLS characterization.]]
+
[[Image:Team-EPF-Lausanne_results_confocal_positive.jpg|thumb|250px|left| Figure 3: Confocal microscopy image showing outer CY5 labeling of the nanoparticles. The size of those nanoparticles is around 200 nm, which corresponds to the previous DLS characterization.]]
-
[[Image:Team-EPF-Lausanne_results_NPs_FITC.jpg|thumb|200px|left| Figure 4: Fluorescent microscopy of the FITC-Dextran loaded nanoparticles. In contrast to the rGFP-loaded ones, their cargo stay inside. Those nanoparticles have been successfully characterized and biotinylated.]]
+
[[Image:Team-EPF-Lausanne_results_NPs_FITC.jpg|thumb|250px|left| Figure 4: Fluorescent microscopy of the FITC-Dextran loaded nanoparticles. In contrast to the rGFP-loaded ones, their cargo stay inside. Those nanoparticles have been successfully characterized and biotinylated.]]
-
[[Image:Team-EPF-Lausanne_device1.jpg|thumb|200px|left|Figure 5: Fluorescent microscopy of GFP-expressing E.coli and nanoparticles. The bacteria were chemically labeled with streptavidin as a surrogate of the cell-surface display strategy. We then mixed them with biotinylated CY5-labeled nanoparticles. This merge image shows that the coupling is successful and that the nanoparticles are attached to the E.coli.]]
+
[[Image:Team-EPF-Lausanne_device1.jpg|thumb|250px|left|Figure 5: Fluorescent microscopy of GFP-expressing E.coli and nanoparticles. The bacteria were chemically labeled with streptavidin as a surrogate of the cell-surface display strategy. We then mixed them with biotinylated CY5-labeled nanoparticles. This merge image shows that the coupling is successful and that the nanoparticles are attached to the E.coli.]]
<br><br><br><br><br><br><br><br>

Revision as of 21:42, 4 October 2013

Taxi.Coli: Smart Drug Delivery iGEM EPFL

Header

This section provides a short summary of our main experimental achievements.


Nanoparticles:

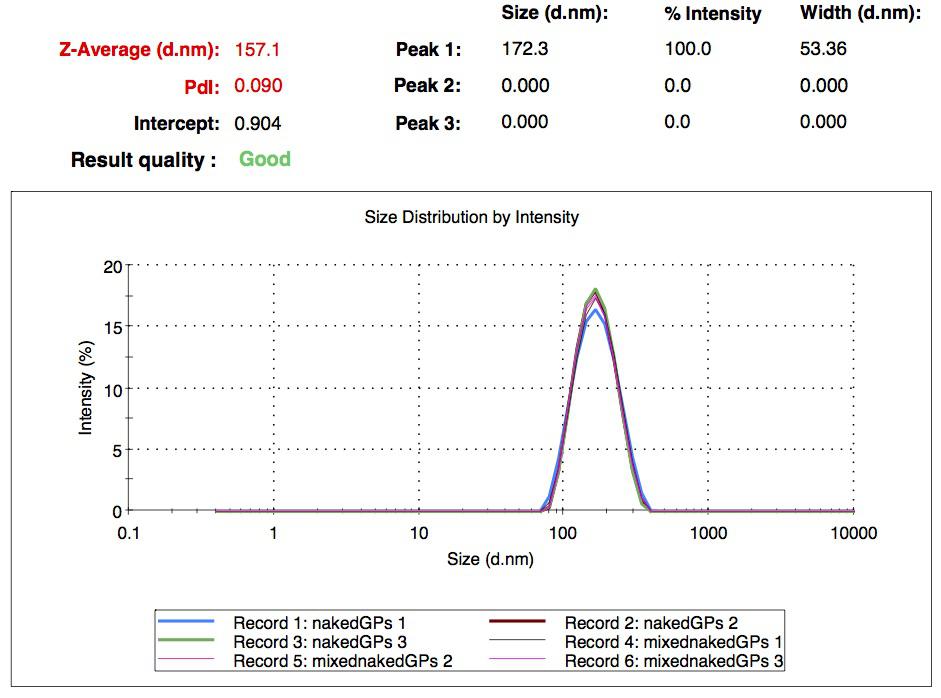
We successfully synthesized different batches of nanoparticles, whose mean diameter is in a range between 200 nm and 300 nm. We ended up with seven different collections of samples: simple naked gelatin nanoparticles, simple biotinylated nanoparticles, CY5-labeled biotinylated nanoparticles, rGFP loaded nanoparticles (naked and biotinylated) and FITC-Dextran loaded nanoparticles (naked and biotinylated). All of them were characterized by DLS. These experiments show that two cargo transport strategies are possible: an external labeling (the one we used with CY5) or an internal loading (with FITC-Dextran and rGFP).
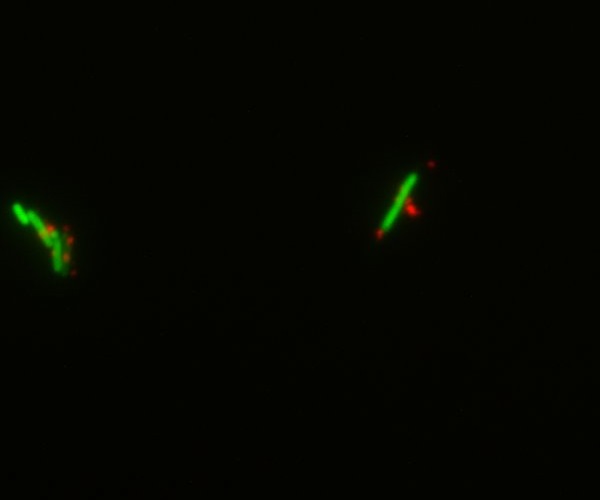
Figure 1: DLS experiment results of the first nanoparticles we obtained: their mean diameter is a bit below 200 nm.
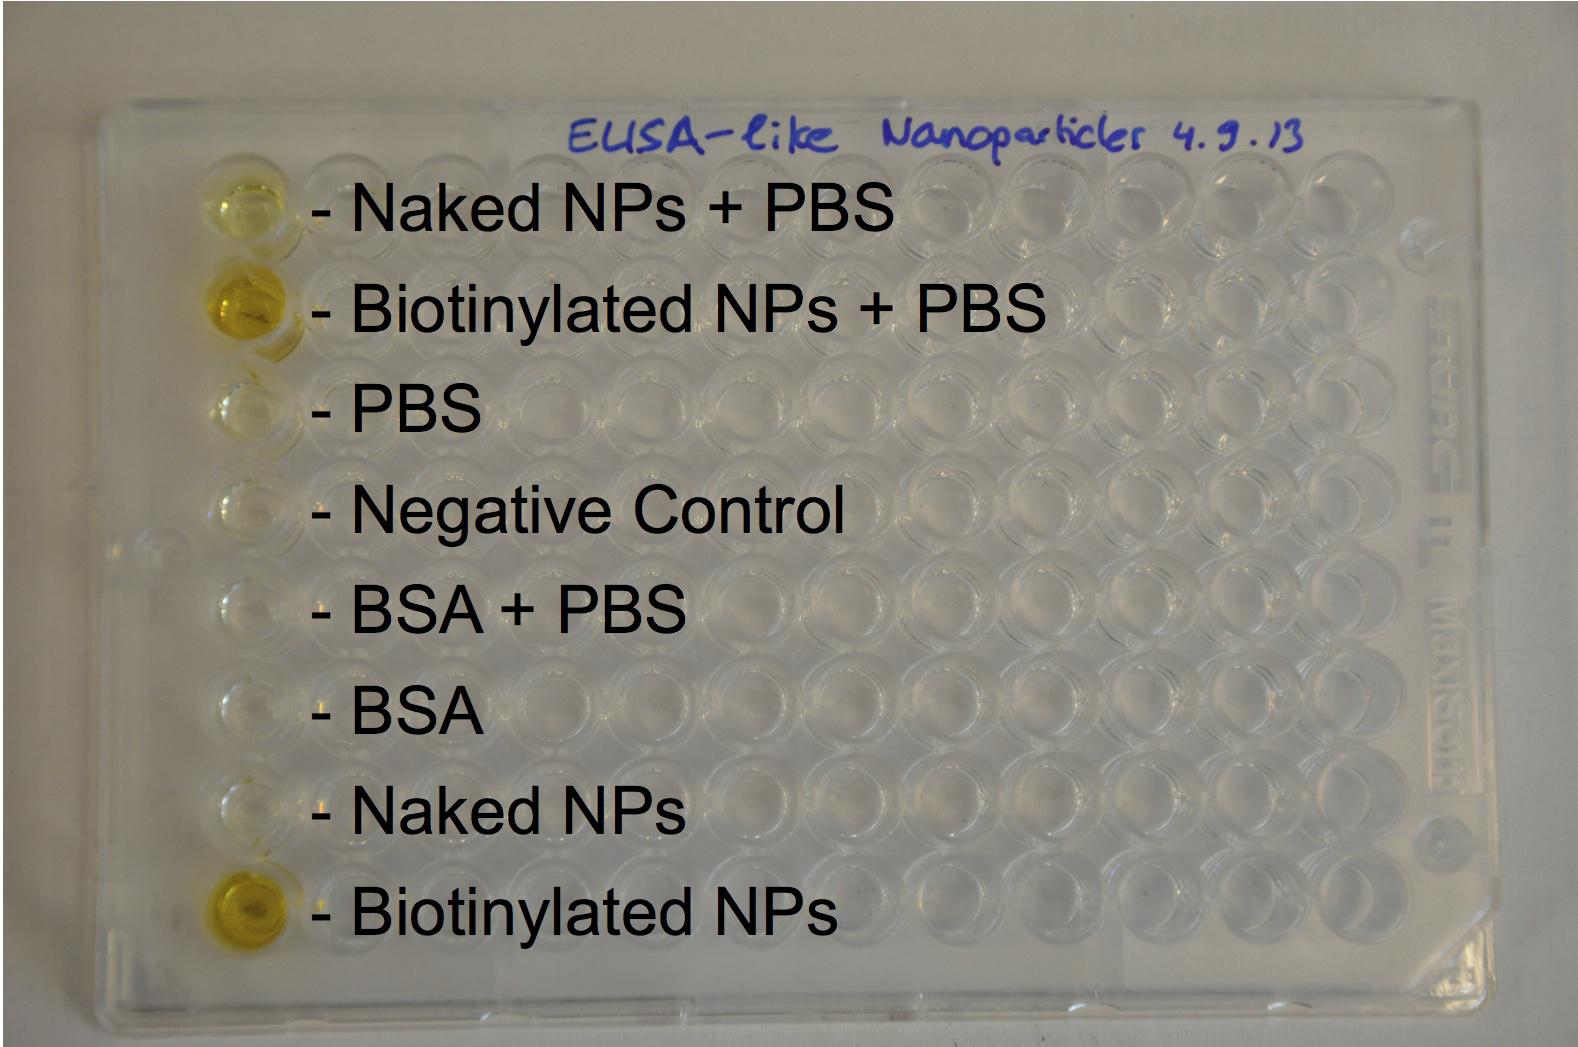
Figure 2: ELISA-like assay. The high absorbance in wells B and H (containing biotinylated nanoparticles) was quantitatively detected using a plate reader. It showed that the nanoparticles were well biotinylated.
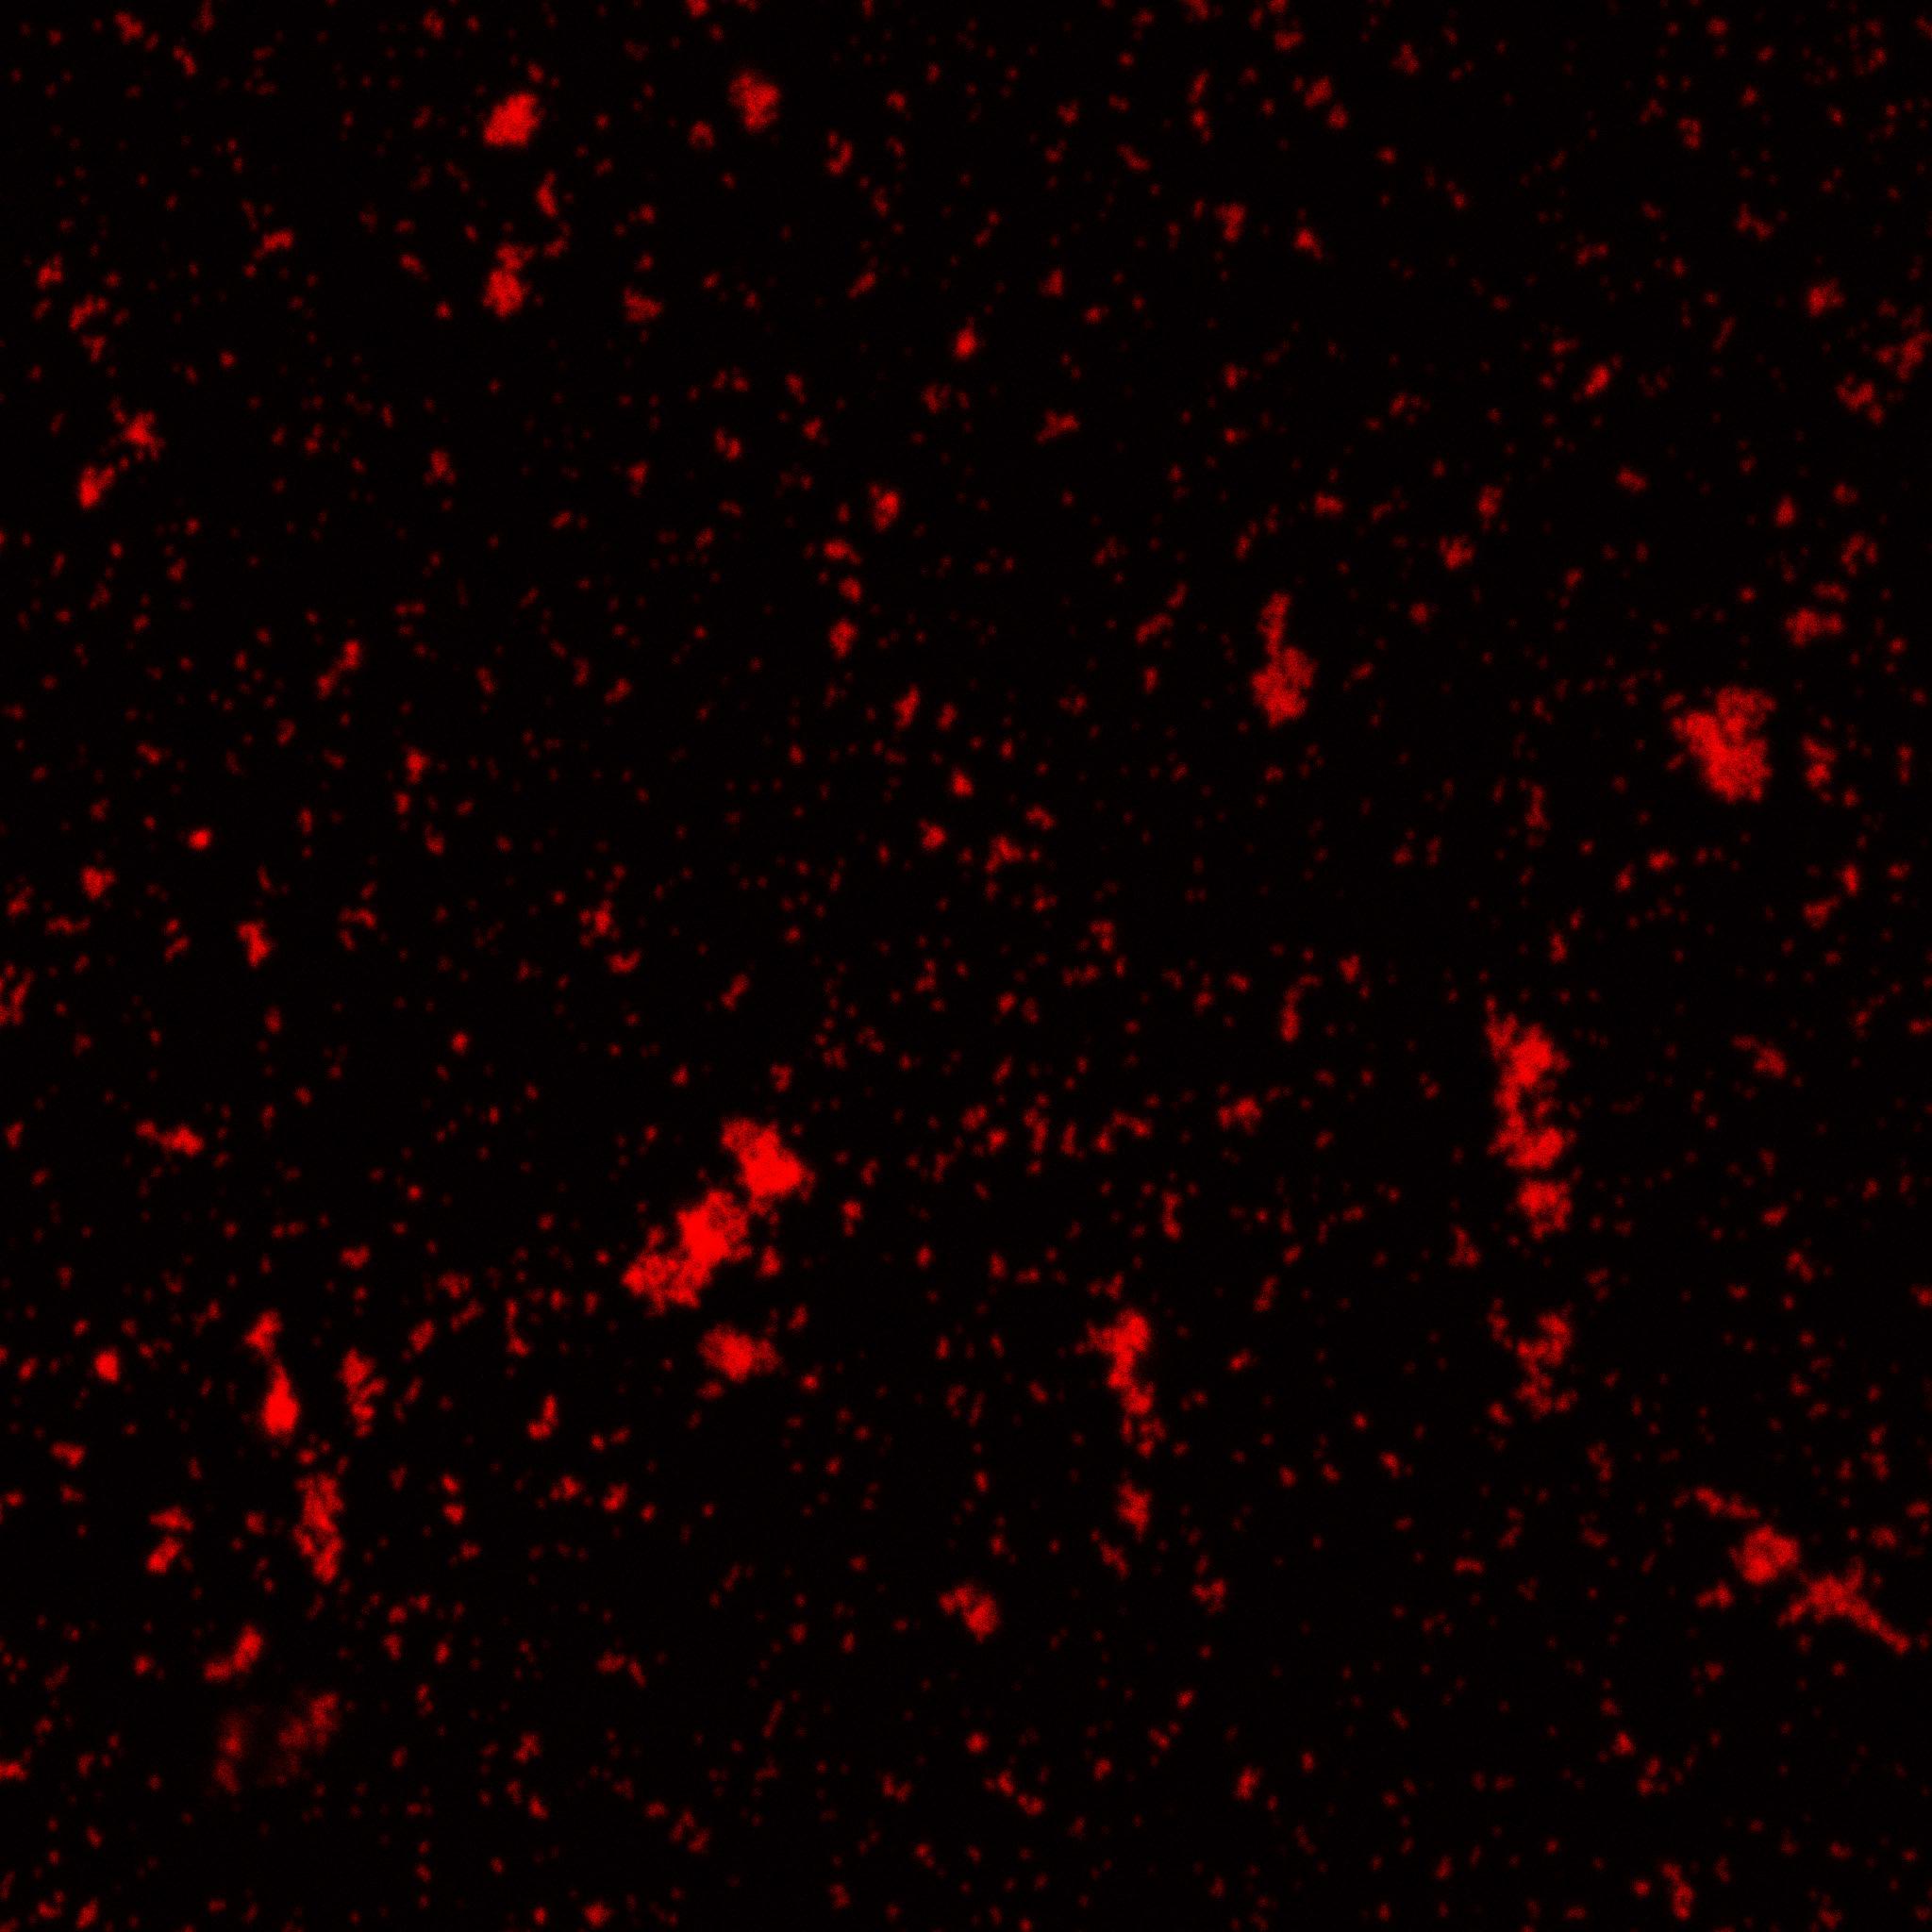
Figure 3: Confocal microscopy image showing outer CY5 labeling of the nanoparticles. The size of those nanoparticles is around 200 nm, which corresponds to the previous DLS characterization.
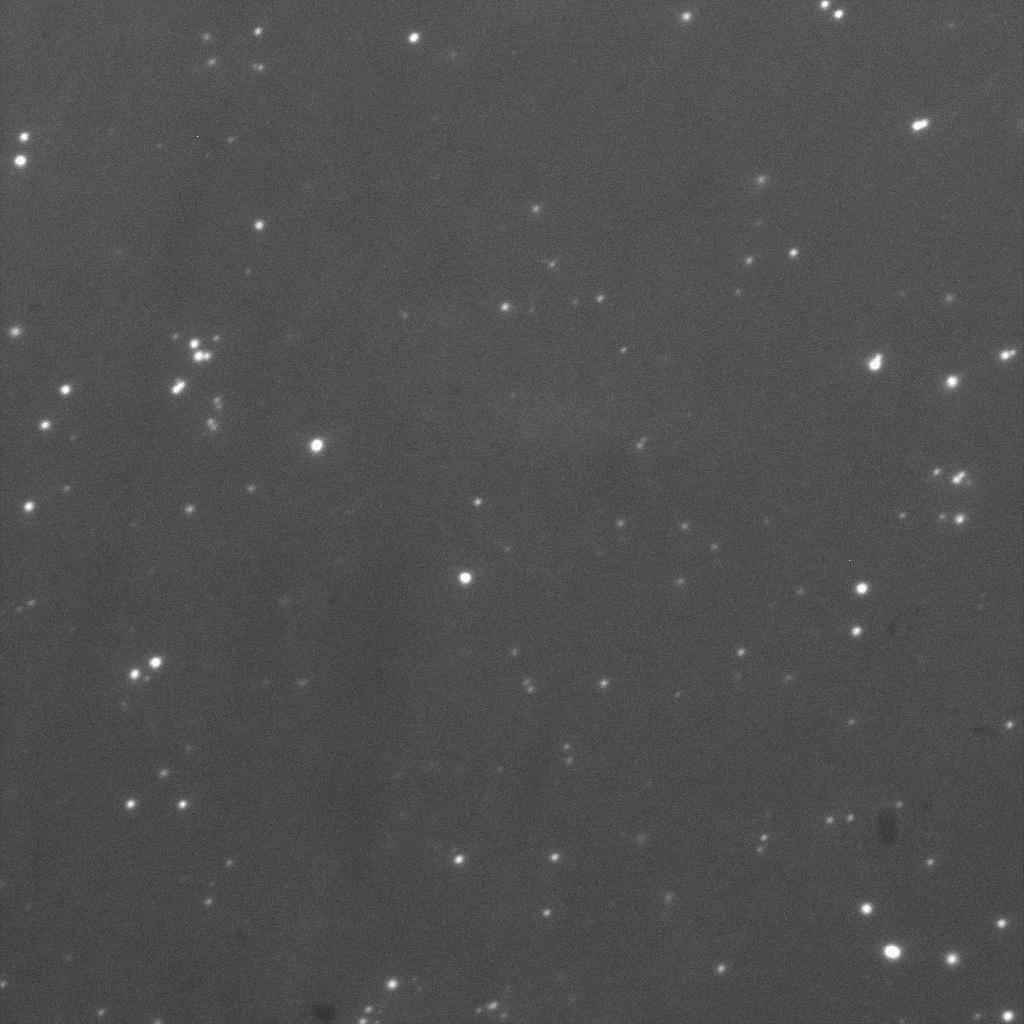
Figure 4: Fluorescent microscopy of the FITC-Dextran loaded nanoparticles. In contrast to the rGFP-loaded ones, their cargo stay inside. Those nanoparticles have been successfully characterized and biotinylated.
Figure 5: Fluorescent microscopy of GFP-expressing E.coli and nanoparticles. The bacteria were chemically labeled with streptavidin as a surrogate of the cell-surface display strategy. We then mixed them with biotinylated CY5-labeled nanoparticles. This merge image shows that the coupling is successful and that the nanoparticles are attached to the E.coli.


Cell surface expression:

Characterization of an existing part: INP characterization with confocal microscope was successfull, we were able to prove with certainty the export of YFP via INP transport in part Bba_K523013

Expression of streptavidin at the cell surface: Gibson assemblies of the three different streptavidin worked perfectly and sequencing results matched with what expected. The growth curve of transformed E.Coli showed delayed growth, but bacteria still divide with an acceptable rate. The assay with a fluorescent biotin supposed to bind streptavidin gave some positive results (some bacteria appeared flurescent when excited at the corresponding wavelenght) but since the negative control also showed fluorescence, nothing could be proved. However, a western blot anti streptavidin showed bands at the expected size of streptavidin, proving with certainty its expression.

Degrading:

With the exception of MMP9, Gibson assemblies worked fine. The sequencing results showed a STOP after MMP2 and gelE, but there was still a chance for them to be expressed, even whithout GFP. The Western Blot anti-His tag was negative even though His tag was supposed to be before STOP. However, it may be hidden in the protein. An assay to purify the two enzymes MMP2 and gelE showed the presence of the proteins by comparing the assay of arabinose induce (expressing enzymes due to the arabinose induced promoter) and non arabinose induced protein.