Team:Tsinghua-E/Result
From 2013.igem.org
(→Results) |
|||
| (15 intermediate revisions not shown) | |||
| Line 2: | Line 2: | ||
<html xmlns="http://www.w3.org/1999/xhtml"> | <html xmlns="http://www.w3.org/1999/xhtml"> | ||
<style type="text/css"> | <style type="text/css"> | ||
| - | #content{height: | + | #content{height:3400px;} |
| - | p{font-size:130%} | + | p{font-size:130%;text-indent:0em;} |
.memberx {position:absolute;top:60px;left:5px;height:215px;width;300px;} | .memberx {position:absolute;top:60px;left:5px;height:215px;width;300px;} | ||
.memberx span{z-index:50;position:relative;width:453px;display:block;top:-215px;left:305px;color:#000000} | .memberx span{z-index:50;position:relative;width:453px;display:block;top:-215px;left:305px;color:#000000} | ||
| Line 17: | Line 17: | ||
</div> | </div> | ||
| - | <div class="tmc" style="height: | + | <div class="tmc" style="height:3285px;"> |
</div> | </div> | ||
| - | <div class="neirong" style="height: | + | <div class="neirong" style="height:3265px;"> |
</html> | </html> | ||
<h2>Strains</h2> | <h2>Strains</h2> | ||
| Line 29: | Line 29: | ||
<strong>Negative control:</strong> | <strong>Negative control:</strong> | ||
| - | BL21(DE3) pSC101wt-ori | + | BL21(DE3) pSC101wt-ori-sfGFP/pTrc99A-trpss-30-tetA |
| - | BL21(DE3) pSC101wt-ori | + | BL21(DE3) pSC101wt-ori-sfGFP/pTrc99A-trpss-32-tetA |
Each evolution was conducted in three parallel with only one parallel of negative control. | Each evolution was conducted in three parallel with only one parallel of negative control. | ||
| Line 42: | Line 42: | ||
<table border="1" cellspacing="0" cellpadding="0"> | <table border="1" cellspacing="0" cellpadding="0"> | ||
<tr> | <tr> | ||
| - | <td width=" | + | <td width="200"><p align="center"><strong> </strong></p></td> |
<td width="142"><p align="center"><strong>1st generation</strong></p></td> | <td width="142"><p align="center"><strong>1st generation</strong></p></td> | ||
<td width="142"><p align="center"><strong>2nd generation</strong></p></td> | <td width="142"><p align="center"><strong>2nd generation</strong></p></td> | ||
| Line 48: | Line 48: | ||
</tr> | </tr> | ||
<tr> | <tr> | ||
| - | <td width=" | + | <td width="200"><p align="center"><strong>Control (only have mutation part)</strong></p></td> |
<td width="142"><p align="center">No growth</p></td> | <td width="142"><p align="center">No growth</p></td> | ||
<td width="142"><p align="center">No growth</p></td> | <td width="142"><p align="center">No growth</p></td> | ||
| Line 54: | Line 54: | ||
</tr> | </tr> | ||
<tr> | <tr> | ||
| - | <td width=" | + | <td width="200"><p align="center"><strong>Bitter defender part rbs30 (mg/L)</strong></p></td> |
<td width="142"><p align="center">0.791</p></td> | <td width="142"><p align="center">0.791</p></td> | ||
<td width="142"><p align="center">3.578</p></td> | <td width="142"><p align="center">3.578</p></td> | ||
| Line 60: | Line 60: | ||
</tr> | </tr> | ||
<tr> | <tr> | ||
| - | <td width=" | + | <td width="200"><p align="center"><strong>Bitter defender part rbs30/mutation part (mg/L)</strong></p></td> |
<td width="142"><p align="center">0.500<br /> | <td width="142"><p align="center">0.500<br /> | ||
0.741<br /> | 0.741<br /> | ||
| Line 75: | Line 75: | ||
<table border="1" cellspacing="0" cellpadding="0"> | <table border="1" cellspacing="0" cellpadding="0"> | ||
<tr> | <tr> | ||
| - | <td width=" | + | <td width="200"><p align="center"><strong> </strong></p></td> |
<td width="142"><p align="center"><strong>1st generation</strong></p></td> | <td width="142"><p align="center"><strong>1st generation</strong></p></td> | ||
<td width="142"><p align="center"><strong>2nd generation</strong></p></td> | <td width="142"><p align="center"><strong>2nd generation</strong></p></td> | ||
| Line 81: | Line 81: | ||
</tr> | </tr> | ||
<tr> | <tr> | ||
| - | <td width=" | + | <td width="200"><p align="center"><strong>Control (only have mutation part)</strong></p></td> |
<td width="142"><p align="center">No growth</p></td> | <td width="142"><p align="center">No growth</p></td> | ||
<td width="142"><p align="center">No growth</p></td> | <td width="142"><p align="center">No growth</p></td> | ||
| Line 87: | Line 87: | ||
</tr> | </tr> | ||
<tr> | <tr> | ||
| - | <td width=" | + | <td width="200"><p align="center"><strong>Bitter defender part rbs32 (mg/L)</strong></p></td> |
<td width="142"><p align="center">0.673</p></td> | <td width="142"><p align="center">0.673</p></td> | ||
<td width="142"><p align="center">1.063</p></td> | <td width="142"><p align="center">1.063</p></td> | ||
| Line 93: | Line 93: | ||
</tr> | </tr> | ||
<tr> | <tr> | ||
| - | <td width=" | + | <td width="200"><p align="center"><strong>Bitter defender part rbs32/mutation part (mg/L)</strong></p></td> |
<td width="142"><p align="center">3.142<br /> | <td width="142"><p align="center">3.142<br /> | ||
0.913<br /> | 0.913<br /> | ||
| Line 110: | Line 110: | ||
It was obvious that tryptophan productivity evolution indeed occurred with the increase productivity trend along the time course compared with the control group. From the wild type E. Coli BL21 (DE3) with nearly zero productivity, this sensor-based evolution approach successfully increase the productivity to about 3mg/L after only three rounds with totally irrationally knowledge-free fashion. Meanwhile, the control group without bitter defender part showed no growth during the three rounds of evolution, which gave strong proof that it was our constructed system which contributed to the evolution process. | It was obvious that tryptophan productivity evolution indeed occurred with the increase productivity trend along the time course compared with the control group. From the wild type E. Coli BL21 (DE3) with nearly zero productivity, this sensor-based evolution approach successfully increase the productivity to about 3mg/L after only three rounds with totally irrationally knowledge-free fashion. Meanwhile, the control group without bitter defender part showed no growth during the three rounds of evolution, which gave strong proof that it was our constructed system which contributed to the evolution process. | ||
| - | However, the strains carrying mutation part showed no difference in final tryptophan titer than that of strains with naturally occurring mutation. According to the report of Leconte A. M.et. al<a>1</a>, in certain conditions, higher mutation rate contributed significantly to the final desired phenotype obtainment along the designed evolution process of biomolecule. However, for our whole-cell level evolution process, considering the inhibition caused by mutation to cell growth, it was possible that in our designed conditions the fitness of higher mutation was not such significant compared with inhibition in fitness. Thus, it was worthy considering resetting our evolution conditions to find the best ones for fast evolution derived by super mutator in the future work. | + | However, the strains carrying mutation part showed no difference in final tryptophan titer than that of strains with naturally occurring mutation. According to the report of Leconte A. M.et. al<html><a>[1]</a></html>, in certain conditions, higher mutation rate contributed significantly to the final desired phenotype obtainment along the designed evolution process of biomolecule. However, for our whole-cell level evolution process, considering the inhibition caused by mutation to cell growth, it was possible that in our designed conditions the fitness of higher mutation was not such significant compared with inhibition in fitness. Thus, it was worthy considering resetting our evolution conditions to find the best ones for fast evolution derived by super mutator in the future work. |
| - | We further plated the evolved strains on agar plate, and picked 24 single colonies to culture in 24-well plate for 48h and detected | + | |
| + | We further plated the evolved strains on agar plate, and picked 24 single colonies to culture in 24-well plate for 48h and detected tryptophan production by HPLC. | ||
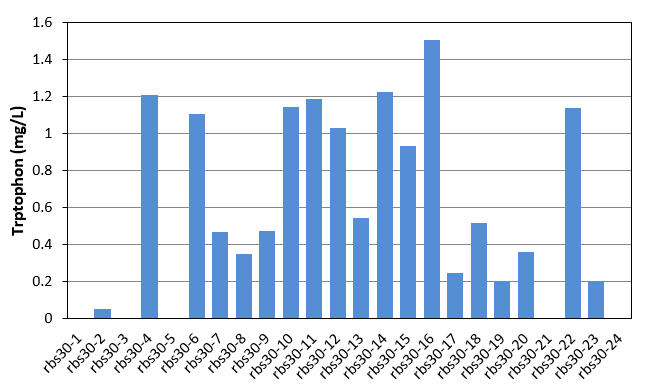
| + | [[File:Note0830.png|600px|thumb|center|Figure 1 Tryptophan production of rbs30 evolved stains]] | ||
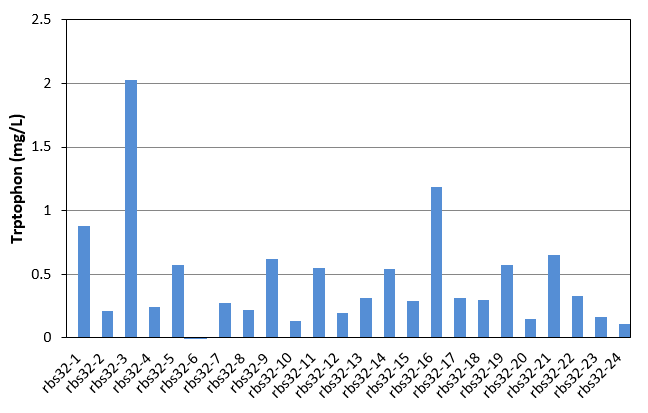
| + | [[File:Note0911.png|600px|thumb|center|Figure 2 Tryptophan production of rbs32 evolved stains]] | ||
As shown in Fig.1 and Fig.2, each single colony has different productivity of tryptophan, as the evolved strains shown in Table 1 and Table 2 are mixed culture. Unfortunately, as the amount of the selected strains was only 24, in these two figures, we did not get the productivity as high as that of mixed culture. We finally found that evolved strain of rbs30-16 and rbs32-3 have the highest tryptophan productivity. We then selected these two strain, and confirmed there productivity comparing with the controls. The result were shown in figure 3. | As shown in Fig.1 and Fig.2, each single colony has different productivity of tryptophan, as the evolved strains shown in Table 1 and Table 2 are mixed culture. Unfortunately, as the amount of the selected strains was only 24, in these two figures, we did not get the productivity as high as that of mixed culture. We finally found that evolved strain of rbs30-16 and rbs32-3 have the highest tryptophan productivity. We then selected these two strain, and confirmed there productivity comparing with the controls. The result were shown in figure 3. | ||
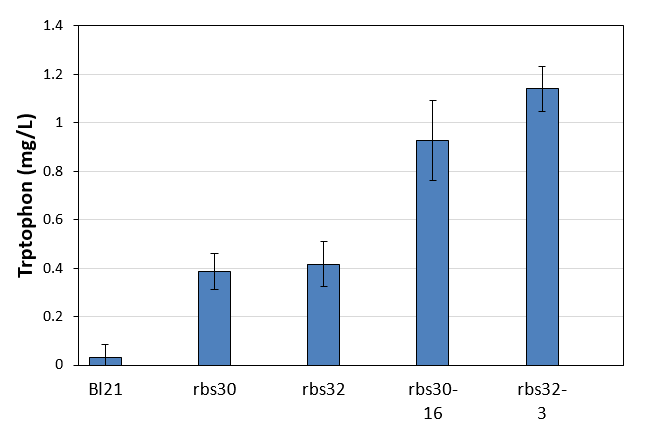
| + | [[File:Note0920.png|600px|thumb|center|Figure 3. Tryptophan production of control and mutation stains]] | ||
The control of E. coli Bl21 (ancestor of evolution) cannot produce tryptophan, but the other two controls with bitter defender part rbs30 and rbs32 showed very low tryptophan production of about 0.4mg/L. Obviously, the two evolved strains had much higher productivity of tryptophan. The productivity of the evolved strain of rbs30-16 was 2.4 times higher than that of control, while that of the evolved strain rbs32-3 was 2.7 times higher than the control. <strong>These results clearly proved our evolution strategy successfully evolved a strain with higher tryptophan from their ancestors which cannot produce tryptophan at all. </strong> | The control of E. coli Bl21 (ancestor of evolution) cannot produce tryptophan, but the other two controls with bitter defender part rbs30 and rbs32 showed very low tryptophan production of about 0.4mg/L. Obviously, the two evolved strains had much higher productivity of tryptophan. The productivity of the evolved strain of rbs30-16 was 2.4 times higher than that of control, while that of the evolved strain rbs32-3 was 2.7 times higher than the control. <strong>These results clearly proved our evolution strategy successfully evolved a strain with higher tryptophan from their ancestors which cannot produce tryptophan at all. </strong> | ||
| - | < | + | |
| + | |||
| + | |||
| + | <p><font style="font-size: 12px">[1] Leconte, A. M. et al. A Population-Based Experimental Model for Protein Evolution: Effects of Mutation Rate and Selection Stringency on Evolutionary Outcomes. <em>Biochemistry</em>52, 1490-1499, doi:10.1021/bi3016185 (2013).</font></p><br/> | ||
<html> | <html> | ||
</div> | </div> | ||
</html> | </html> | ||
Latest revision as of 09:52, 10 October 2013


Strains
BL21(DE3)(mut-bitter30(+))/pSC101wt-ori-mutD-sfGFP/pTrc99A-trpss-30-tetA
BL21(DE3)(mut-bitter32(+))/pSC101wt-ori-mutD-sfGFP/pTrc99A-trpss-32-tetA
Negative control:
BL21(DE3) pSC101wt-ori-sfGFP/pTrc99A-trpss-30-tetA
BL21(DE3) pSC101wt-ori-sfGFP/pTrc99A-trpss-32-tetA
Each evolution was conducted in three parallel with only one parallel of negative control.
Results
By using the parts constructed by us, following the protocol described, we conducted the continuous evolution derived by mutD based mutation for two E. Coli BL21 (DE3) strains carrying bitter defender part 30 and 32. The results were shown below:
Table1 Titer increase dynamics of different strains after different rounds of evolution (rbs30)
|
1st generation |
2nd generation |
3rd generation |
Control (only have mutation part) |
No growth |
No growth |
No growth |
Bitter defender part rbs30 (mg/L) |
0.791 |
3.578 |
3.119 |
Bitter defender part rbs30/mutation part (mg/L) |
0.500 |
0.919 |
2.245 |
Table2 Titer increase dynamics of different strains after different rounds of evolution (rbs32)
|
1st generation |
2nd generation |
3rd generation |
Control (only have mutation part) |
No growth |
No growth |
No growth |
Bitter defender part rbs32 (mg/L) |
0.673 |
1.063 |
3.433 |
Bitter defender part rbs32/mutation part (mg/L) |
3.142 |
0.766 |
2.540 |
It was obvious that tryptophan productivity evolution indeed occurred with the increase productivity trend along the time course compared with the control group. From the wild type E. Coli BL21 (DE3) with nearly zero productivity, this sensor-based evolution approach successfully increase the productivity to about 3mg/L after only three rounds with totally irrationally knowledge-free fashion. Meanwhile, the control group without bitter defender part showed no growth during the three rounds of evolution, which gave strong proof that it was our constructed system which contributed to the evolution process.
However, the strains carrying mutation part showed no difference in final tryptophan titer than that of strains with naturally occurring mutation. According to the report of Leconte A. M.et. al[1], in certain conditions, higher mutation rate contributed significantly to the final desired phenotype obtainment along the designed evolution process of biomolecule. However, for our whole-cell level evolution process, considering the inhibition caused by mutation to cell growth, it was possible that in our designed conditions the fitness of higher mutation was not such significant compared with inhibition in fitness. Thus, it was worthy considering resetting our evolution conditions to find the best ones for fast evolution derived by super mutator in the future work.
We further plated the evolved strains on agar plate, and picked 24 single colonies to culture in 24-well plate for 48h and detected tryptophan production by HPLC.
As shown in Fig.1 and Fig.2, each single colony has different productivity of tryptophan, as the evolved strains shown in Table 1 and Table 2 are mixed culture. Unfortunately, as the amount of the selected strains was only 24, in these two figures, we did not get the productivity as high as that of mixed culture. We finally found that evolved strain of rbs30-16 and rbs32-3 have the highest tryptophan productivity. We then selected these two strain, and confirmed there productivity comparing with the controls. The result were shown in figure 3.
The control of E. coli Bl21 (ancestor of evolution) cannot produce tryptophan, but the other two controls with bitter defender part rbs30 and rbs32 showed very low tryptophan production of about 0.4mg/L. Obviously, the two evolved strains had much higher productivity of tryptophan. The productivity of the evolved strain of rbs30-16 was 2.4 times higher than that of control, while that of the evolved strain rbs32-3 was 2.7 times higher than the control. These results clearly proved our evolution strategy successfully evolved a strain with higher tryptophan from their ancestors which cannot produce tryptophan at all.
[1] Leconte, A. M. et al. A Population-Based Experimental Model for Protein Evolution: Effects of Mutation Rate and Selection Stringency on Evolutionary Outcomes. Biochemistry52, 1490-1499, doi:10.1021/bi3016185 (2013).
 "
"


