Team:NCTU Formosa/results
From 2013.igem.org
(→Expected sRNA regulation efficiency) |
(→Expected sRNA regulation efficiency) |
||
| (29 intermediate revisions not shown) | |||
| Line 13: | Line 13: | ||
[[File:NCTU_result_Pred_biobrick.png|center|800px|Figure 1. Notice that P<sub>red</sub> includes a 37 °C RBS that is only activated above or at 37 °C.]] | [[File:NCTU_result_Pred_biobrick.png|center|800px|Figure 1. Notice that P<sub>red</sub> includes a 37 °C RBS that is only activated above or at 37 °C.]] | ||
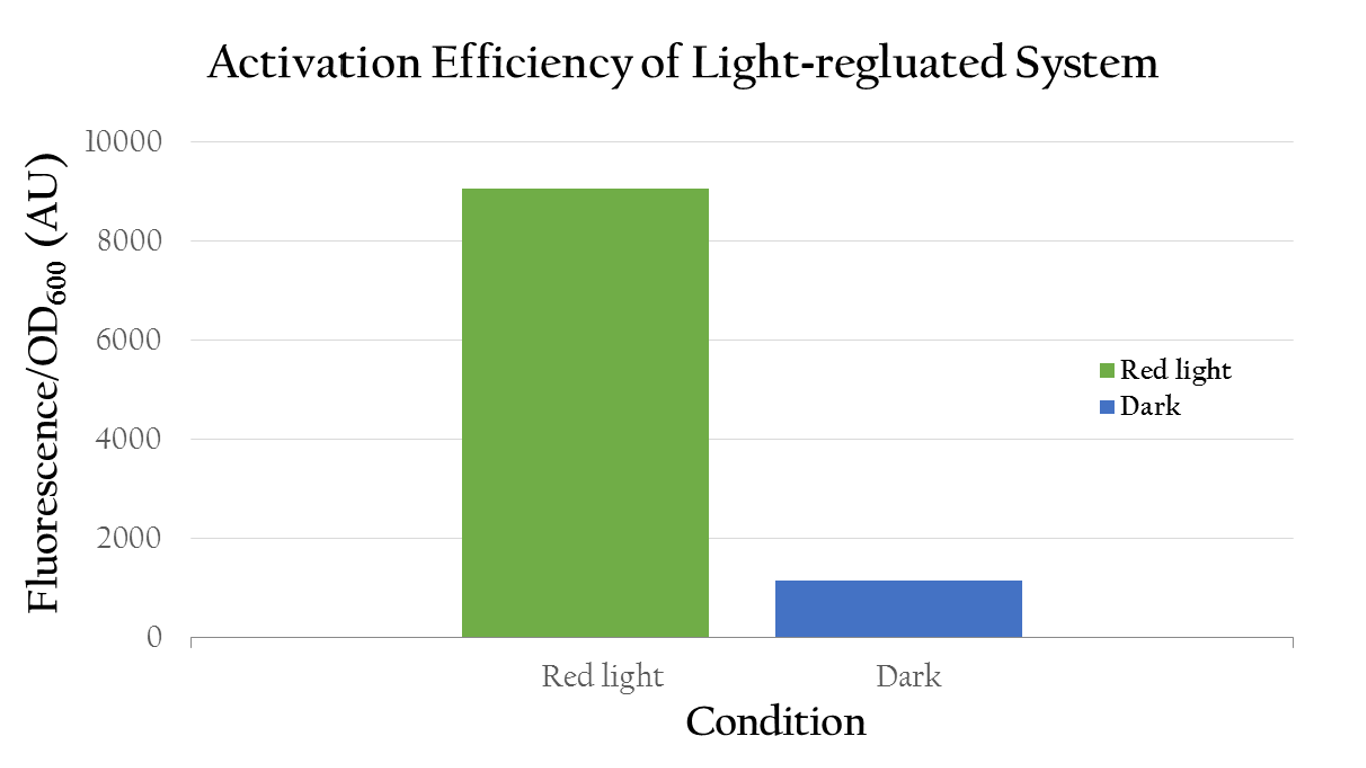
| - | <p>To test whether red light can regulate P<sub>red</sub> or not, we measured the florescence expression of ''E. coli'' that were exposed to red light | + | <p>To test whether red light can regulate P<sub>red</sub> or not, we measured the florescence expression of ''E. coli'' that were exposed to red light and dark. Figure 2 shows that red light can in fact activate P<sub>red</sub>. |
| - | + | The ''E. coli'' displays a high normalized expression under red light, suggesting that the biobrick was successfully activated by red light and we actually attain our aim - use red light to positively control gene expression through P<sub>red</sub>. On the contrary, it shows only little expression in dark. </p> | |
| - | [[File:NCTU_result_Activation_Efficiency_of_light_regulated_system.png|center|600px|Figure 2. | + | [[File:NCTU_result_Activation_Efficiency_of_light_regulated_system.png|center|600px|Figure 2. The OD value of our biobrick which include P<sub>red</sub> shows high expression under red light. It indicates that the reversion of P<sub>red</sub> is totally success.]] |
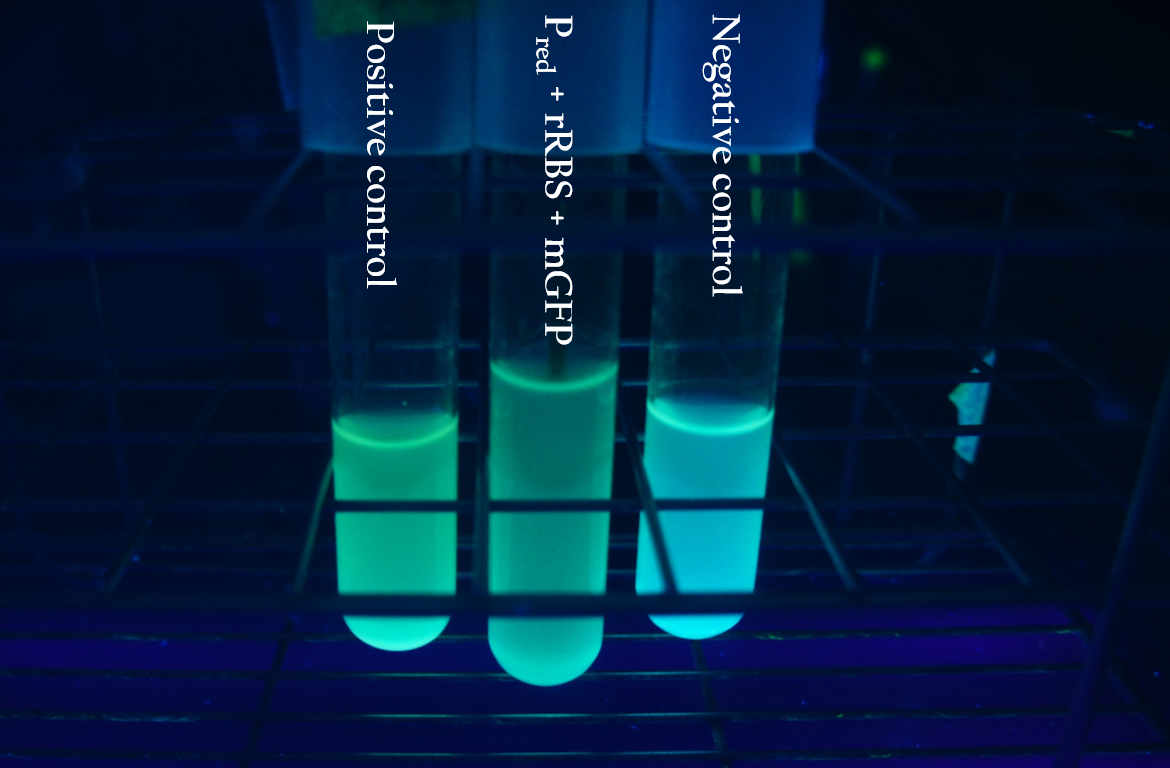
[[File:NCTU_result_Pred_fluo.png|center|600px|Figure 3. Positive control: P<sub>cons</sub> + mGFP. Negative control: tet 30. P<sub>red</sub> is activated by red light and shows strong GFP expression that is close to the expression of the positive control. ]] | [[File:NCTU_result_Pred_fluo.png|center|600px|Figure 3. Positive control: P<sub>cons</sub> + mGFP. Negative control: tet 30. P<sub>red</sub> is activated by red light and shows strong GFP expression that is close to the expression of the positive control. ]] | ||
| + | <p> We also use different light intensity to test whether P<sub>red</sub> would be affected by light intensity. We use different quantity of LED light to represent different light intensity. For example, we use one LED light to represent weak light intensity and four LED light to represent strong light intensity. As the result shown in Fig.4, we can clearly know that P<sub>red</sub>'s function is proportionate to light intensity. </p> | ||
| + | [[File:NCTU_result_Activation_Efficiency_of_light_regulated_system_3.png|center|600px|Figure 4. The Activity efficiency of P<sub>red</sub> under different light intensity. ]] | ||
</div></div> | </div></div> | ||
| Line 27: | Line 29: | ||
====37 °C RBS==== | ====37 °C RBS==== | ||
<p>Using biobrick, P<sub>cons</sub> + 37 °C RBS + mGFP+J61048, we tested the function of the 37 °C RBS at 25 °C and at 37 °C.</p> | <p>Using biobrick, P<sub>cons</sub> + 37 °C RBS + mGFP+J61048, we tested the function of the 37 °C RBS at 25 °C and at 37 °C.</p> | ||
| - | [[File:NCTU_37RBS_biobrick.png|center|400px|Figure | + | [[File:NCTU_37RBS_biobrick.png|center|400px|Figure 5. The biobrick for testing the function of 37 °C RBS.]] |
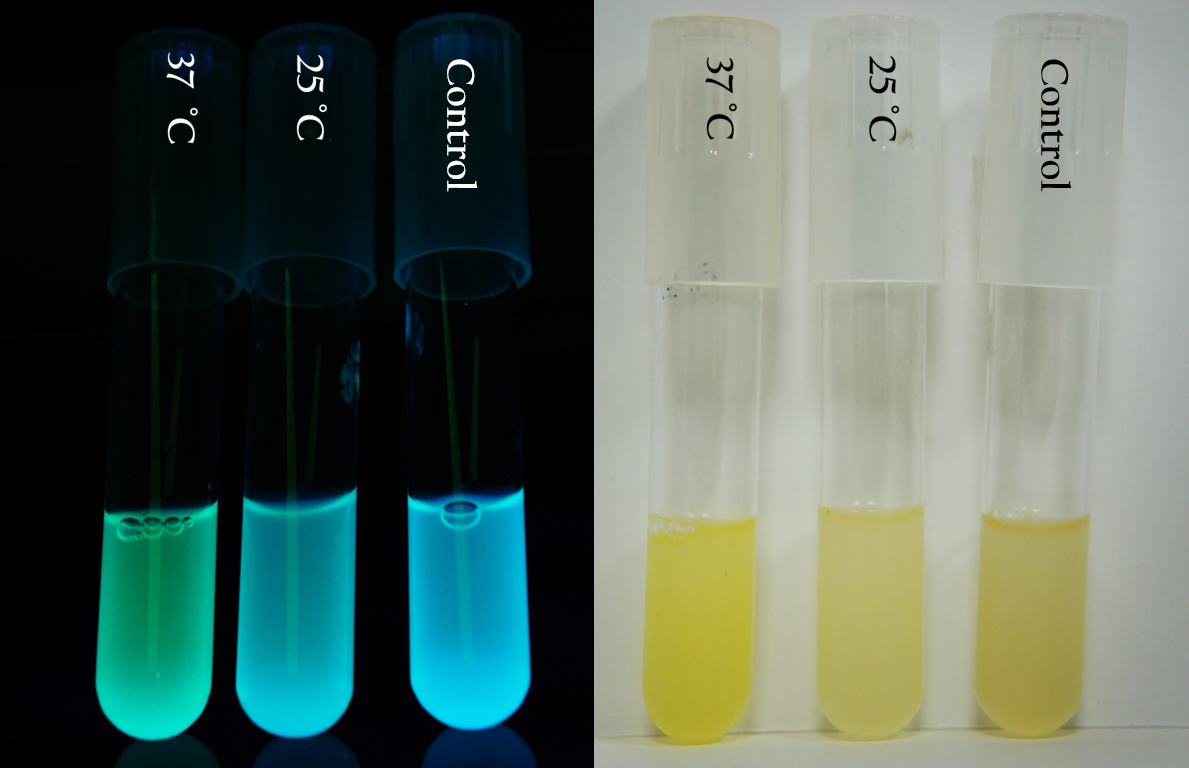
| - | [[File:NCTU_Test_37RBS_fluo_pic.png|center|600px|Figure | + | [[File:NCTU_Test_37RBS_fluo_pic.png|center|600px|Figure 6. The differences between the level of GFP expressions can be easily observed under UV light.]] |
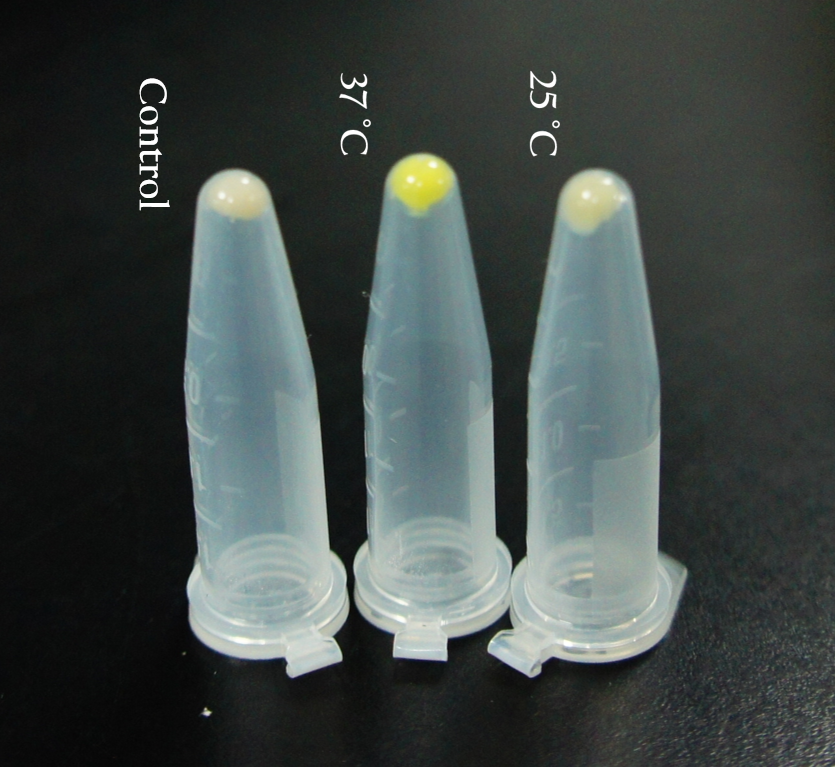
| - | [[File:NCTU_Test_37RBS_ependorf.png|center|600px|Figure | + | [[File:NCTU_Test_37RBS_ependorf.png|center|600px|Figure 7. The differences between the level of GFP expressions.]] |
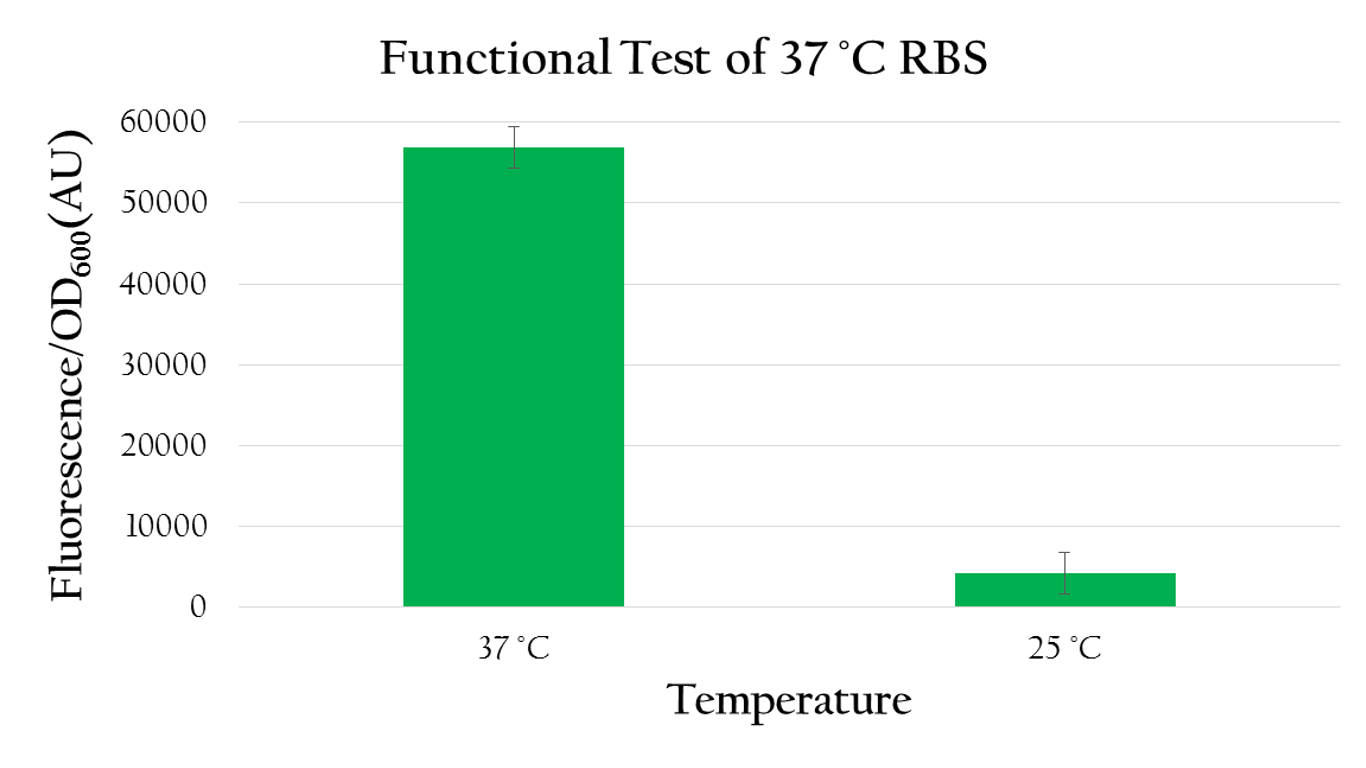
| - | As shown in Figure | + | As shown in Figure 8 the normalized expression, obtained by dividing the florescence expression (emmision 612 nm and excitation 584 nm) with the OD<sub>600</sub> value, of GFP under 37 °C is much higher than the expression under 25 °C. Such result demonstrates the fact that 37 °C RBS can effectively regulate gene expression by responding to temperature. The increased kinetic energy at 37 °C is sufficient to cause the 37 °C RBS to unfold and become available for ribosome binding. At 25 °C, however, there isn't sufficient kinetic energy to unfold the hairpin structure and the structure is preserved. As a result, the translational efficiency is very low at 25 °C. |
| - | [[File:NCTU_Test_functional_test_of_37RBS.png|center|600px|Figure | + | [[File:NCTU_Test_functional_test_of_37RBS.png|center|600px|Figure 8. The normalized expression (florescence expression/ OD value) under 37 °C is higher than the expression under room temperature by about 6 folds.]] |
| Line 52: | Line 54: | ||
</p> | </p> | ||
| - | <p> As you can see from Figure | + | <p> As you can see from Figure 9, Figure 10, and Figure 11, the bacterial pellet and liquid of each biobrick shows different level of RFP expressions as the RBS of each biobrick provides a different translation efficiency. The deeper the red color is, the higher the level of expression is. </p> |
| - | [[File:NCTU_Test_RBS_pic.png|center|600px|Figure | + | [[File:NCTU_Test_RBS_pic.png|center|600px|Figure 9. B0034 clearly expressed more ''RFP'' compared to others.]] |
| - | [[File:NCTU_Test_RBS_flo_pic.png|center|600px|Figure | + | [[File:NCTU_Test_RBS_flo_pic.png|center|600px|Figure 10. K1017202 shows moderate RFP expression that can be distinguished from the expressions B0030 and B0032 ]] |
| - | [[File:NCTU_Test_RBS_ependorf.png|center|600px|Figure | + | [[File:NCTU_Test_RBS_ependorf.png|center|600px|Figure 11. From left to right, the ribosome binding sites respectively: B0032, K1017202, B0030, B0034, control.]] |
| - | <p> We measured the normalized expression for each biobrick mentioned above. We calculated the normalized expression by dividing fluorescence expression with the OD value measured, since the higher the OD value is, the larger the amount of bacteria that can express florescence would be. As shown in Figure | + | <p> We measured the normalized expression for each biobrick mentioned above. We calculated the normalized expression by dividing fluorescence expression with the OD value measured, since the higher the OD value is, the larger the amount of bacteria that can express florescence would be. As shown in Figure 12, the normalized expression of the biobrick with B0034 is the highest and the one with K1017202 (rRBS) is the second highest, while the other two of B0032 and B0030 show weak expressions. This result implies that K1017202 can, in fact, serve as a functional RBS. In comparison to other RBS, K1017202 can provide moderate translational efficiency that is just lower than that of the highly efficient B0034. </p> |
| - | [[File:NCTU_Test_functional_test_of_different_RBS.png|center|600px|Figure | + | [[File:NCTU_Test_functional_test_of_different_RBS.png|center|600px|Figure 12. K1017202 shows moderate expression compared to the others.]] |
====Effect on ''E. Coli'' Growth==== | ====Effect on ''E. Coli'' Growth==== | ||
| - | <p>To test whether or not our sRNA would effect the growth of ''E. Coli'', we compared the growth of ''E. Coli'' with PSB1C3 (without RFP) and the ''E. Coli'' growth with P<sub>cons</sub> + sRNA. It can be observed from Figure | + | <p>To test whether or not our sRNA would effect the growth of ''E. Coli'', we compared the growth of ''E. Coli'' with PSB1C3 (without RFP) and the ''E. Coli'' growth with P<sub>cons</sub> + sRNA. It can be observed from Figure 13 that the resultant growth curves are similar, showing no signs of growth interference. This result proves that our sRNA regulated system can be integrated into bacteria. </p> |
| - | [[File:NCTU_sRNA_growth.JPG|center|600px|Figure | + | [[File:NCTU_sRNA_growth.JPG|center|600px|Figure 13. The growth curve of the ''E. Coli'' with sRNA shows uninterrupted growth curve that is similar to the growth curve of the ''E. Coli'' with PSB1C3]] |
====Expected sRNA regulation efficiency==== | ====Expected sRNA regulation efficiency==== | ||
| - | <p>We employed the following biobricks to test the regulation efficiency of the sRNA we designed :<br> P<sub>cons</sub> + rRBS + mRFP + J61048 and <br>P<sub>cons</sub> + | + | <p>We employed the following biobricks to test the regulation efficiency of the sRNA we designed :<br> P<sub>cons</sub> + rRBS + mRFP + J61048 and <br>P<sub>cons</sub> + rRBS + mRFP + J61048 with P<sub>cons</sub> + sRNA.</p> |
| - | [[File:NCTU_sRNA_regulation_biobrick.png|center|600px|Figure | + | [[File:NCTU_sRNA_regulation_biobrick.png|center|600px|Figure 14. The biobrick of testing the sRNA.]] |
| - | [[File:NCTU_sRNA_regulation_plate.JPG|center|600px|Figure | + | [[File:NCTU_sRNA_regulation_plate.JPG|center|600px|Figure 15. The bacterial colonies with sRNA shows no clear sign of RFP expression, while the colonies without sRNA do.]] |
| - | <p> From Figure | + | <p> From Figure 15, it can be observed that sRNA can regulate RFP expression. The bacterial colonies without sRNA are red, showing high RFP expression. The bacterial colonies with sRNA, however, are white, suggesting that sRNA has regulated the RFP expression by base pairing to rRBS. The normalized expression without sRNA must be much higher than the expression with sRNA, or else we would not be able to easily distinguish the difference in RFP expression through the colors of the colonies. </p> |
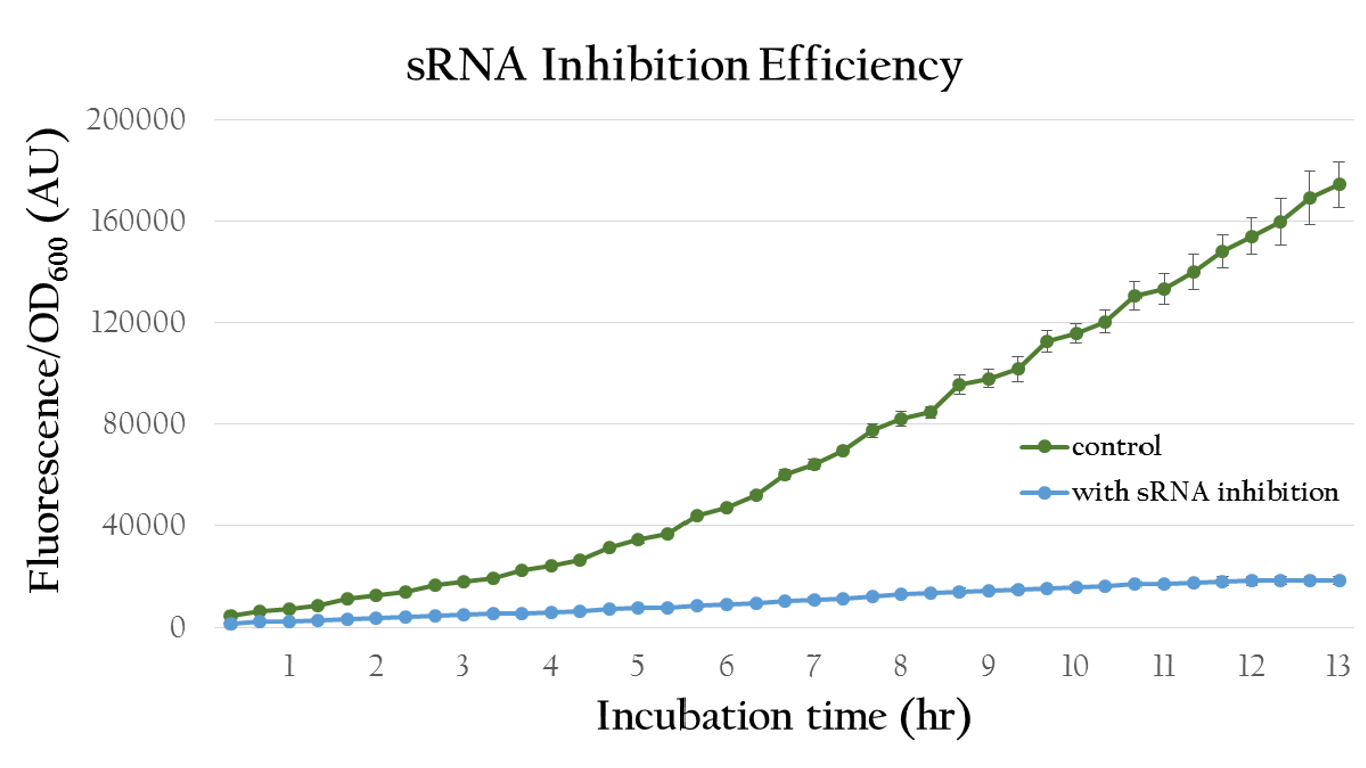
| - | [[File:NCTU_result_sRNA_Inhibit_Efficiency.png|center|650px|Figure | + | [[File:NCTU_result_sRNA_Inhibit_Efficiency.png|center|650px|Figure 16. The OD value of the colony which with our sRNA is much lower.]] |
| - | + | Figure 16 shows quantitative analysis of the sRNA regulation efficiency. As shown in the figure, the normalized fluorescence expression of the colony which insert our artificial sRNA gene is much lower then the one without our artificial sRNA, indicating that our artificial sRNA can effectively suppress gene expression. | |
| + | <p>Besides, we also created an inducible sRNA inhibitory system, in order to further prove its function by integrating the LuxR-Plux system into it. This way, we could control its inhibitory time point and observe it's efficiency under certain concentration of AHL.</p> | ||
| + | [[File:Figure2_NCTU_Formosa.png|center|400px|Figure 17. The biobrick of inducible sRNA.]] | ||
| + | |||
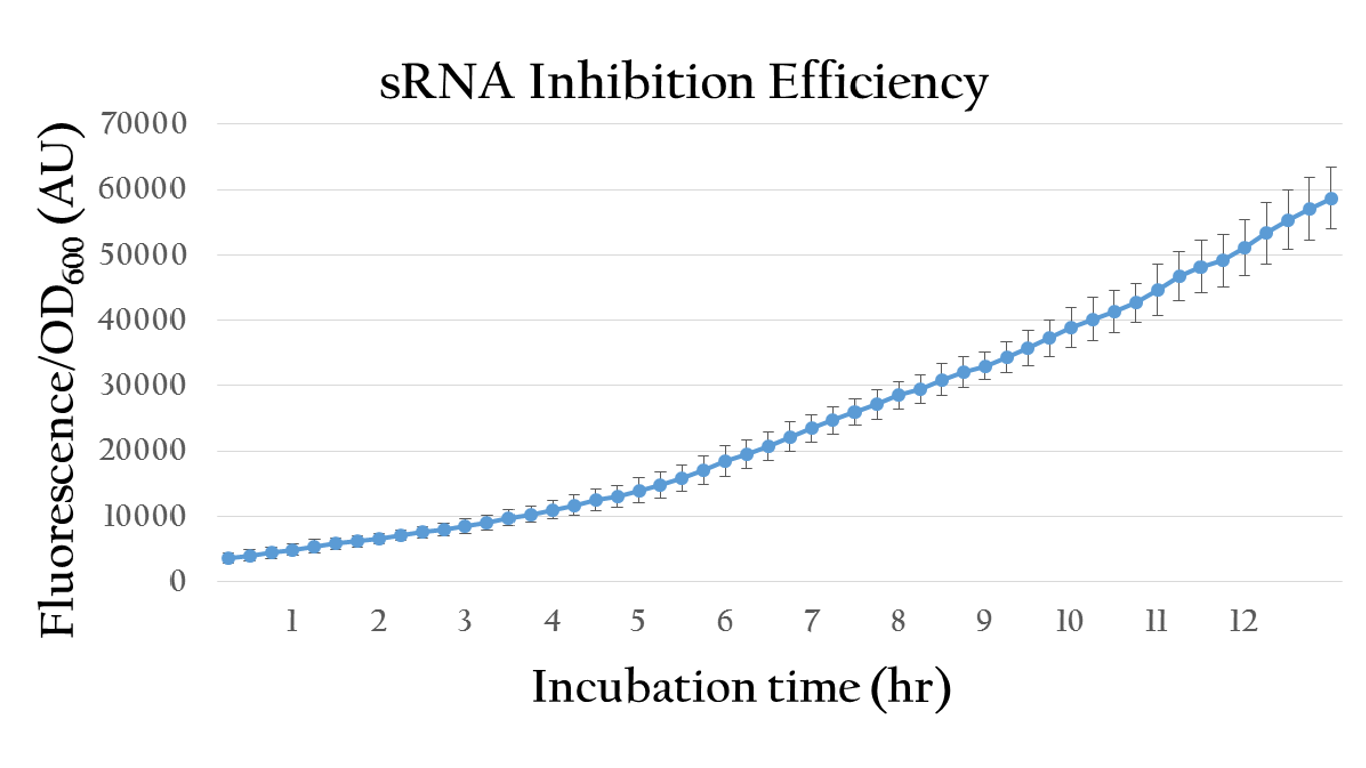
| + | [[File:Nctu_srna_withoutAHL.png|center|700px|Figure 18. The sRNA inhibition efficiency without AHL induction]] | ||
| + | |||
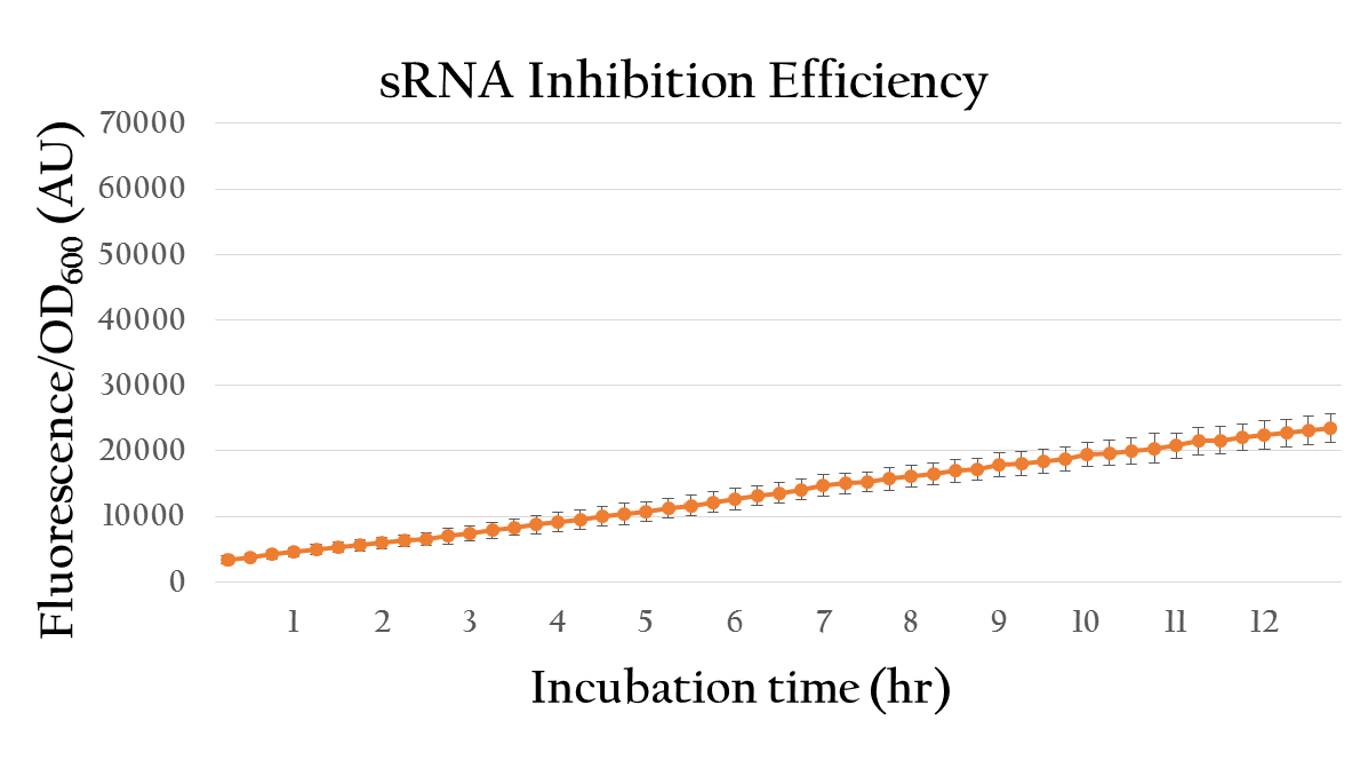
| + | [[File:Nctu_srnainduce_withAHl.png|center|700px|Figure 19. The sRNA inhibition efficiency under 10^(-6) M of AHL induction]] | ||
| + | |||
| + | <p>By comparing the normalized expression of Figure 18 (bacteria incubation without AHL addition) and Figure 19 (bacteria incubation with 10<sup>-6</sup> M AHL addition), we can conclude that our sRNA system does work greatly under AHL induction to inhibit the downstream genes of rRBS.</p> | ||
</div></div> | </div></div> | ||
Latest revision as of 03:37, 29 October 2013
The current progress of our project, including detailed information of the experimental data and the overall evaluation of the practicability of this project.
Contents |
Light-regulated System
Red Promoter
In order to positively regulate gene expression with red light, we employed the light receptor biobrick (K1017301) to give E. coli light sensing ability, and Pred biobrick for E. coli to respond to red light, both depicted in Figure 1. Pred is repressed in the dark and activated by red light.
To test whether red light can regulate Pred or not, we measured the florescence expression of E. coli that were exposed to red light and dark. Figure 2 shows that red light can in fact activate Pred. The E. coli displays a high normalized expression under red light, suggesting that the biobrick was successfully activated by red light and we actually attain our aim - use red light to positively control gene expression through Pred. On the contrary, it shows only little expression in dark.
We also use different light intensity to test whether Pred would be affected by light intensity. We use different quantity of LED light to represent different light intensity. For example, we use one LED light to represent weak light intensity and four LED light to represent strong light intensity. As the result shown in Fig.4, we can clearly know that Pred's function is proportionate to light intensity.
Temperature-regulated System
37 °C RBS
Using biobrick, Pcons + 37 °C RBS + mGFP+J61048, we tested the function of the 37 °C RBS at 25 °C and at 37 °C.
As shown in Figure 8 the normalized expression, obtained by dividing the florescence expression (emmision 612 nm and excitation 584 nm) with the OD600 value, of GFP under 37 °C is much higher than the expression under 25 °C. Such result demonstrates the fact that 37 °C RBS can effectively regulate gene expression by responding to temperature. The increased kinetic energy at 37 °C is sufficient to cause the 37 °C RBS to unfold and become available for ribosome binding. At 25 °C, however, there isn't sufficient kinetic energy to unfold the hairpin structure and the structure is preserved. As a result, the translational efficiency is very low at 25 °C.
Small RNA-regulated System
rRBS efficiency
We used the following biobrick to test the translational efficiency of K1017202 (rRBS) compared to the efficiency of other RBSs:
- Pcons + BBa_B0034 + mRFP + Ter
- Pcons + [http://parts.igem.org/wiki/index.php?title=Part:BBa_K1017202 BBa_K1017202]+mRFP+Ter
- Pcons + BBa_B0030 + mRFP + Ter
- Pcons + BBa_B0032 + mRFP + Ter
- control: pet 30
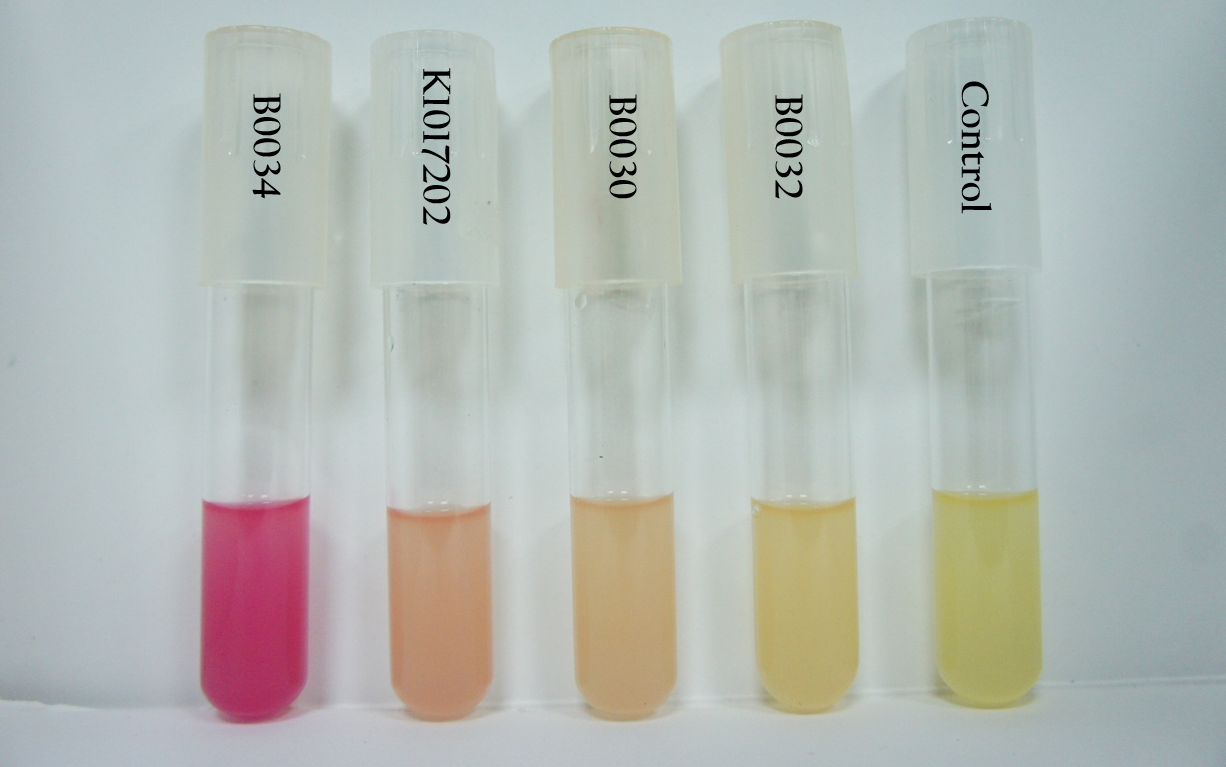
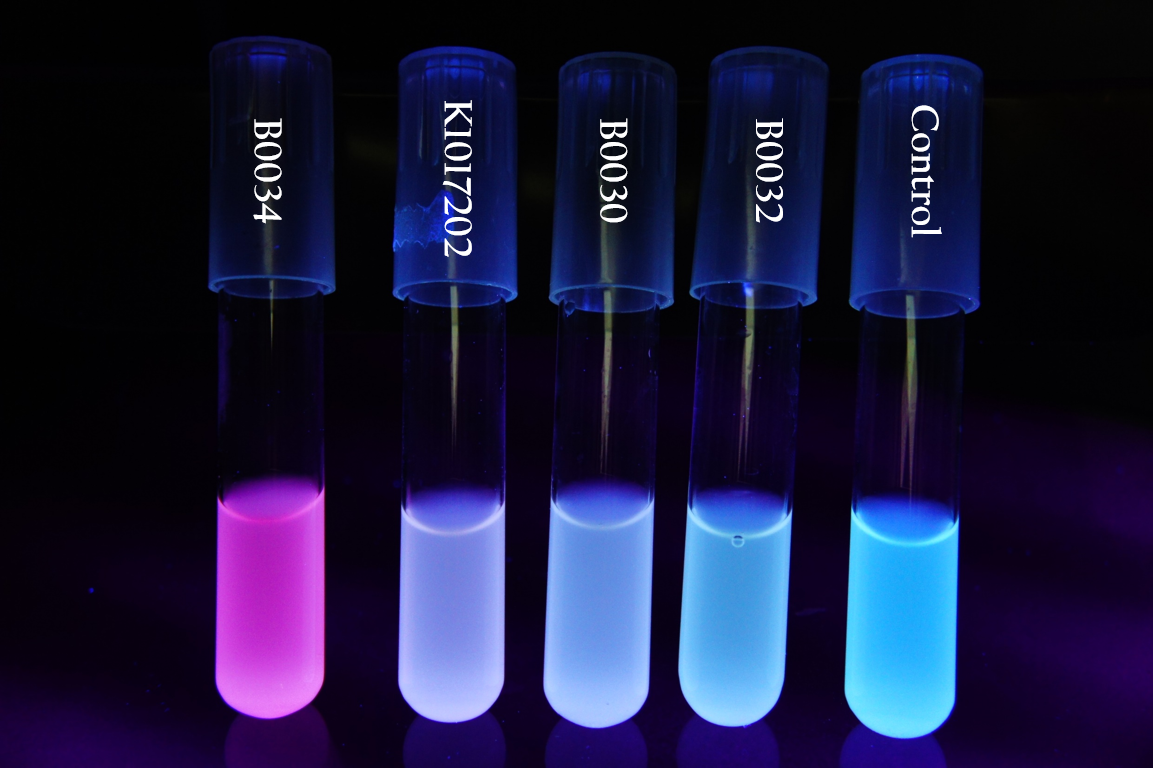
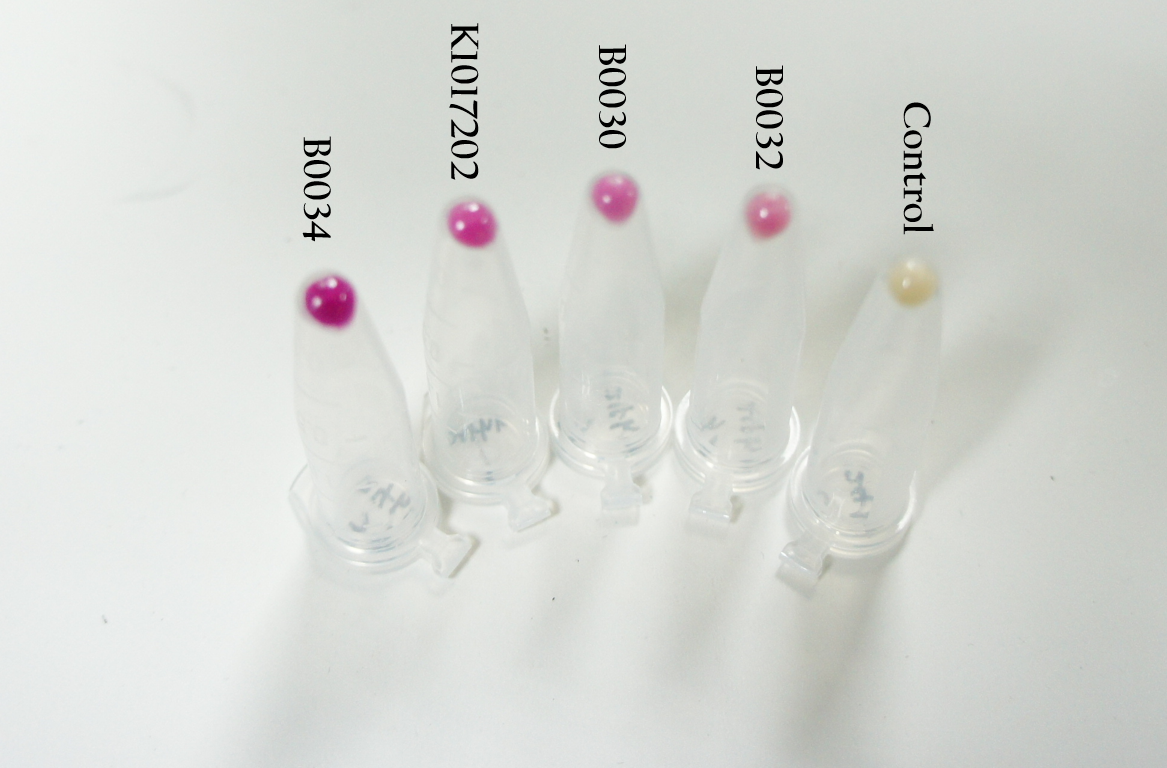
As you can see from Figure 9, Figure 10, and Figure 11, the bacterial pellet and liquid of each biobrick shows different level of RFP expressions as the RBS of each biobrick provides a different translation efficiency. The deeper the red color is, the higher the level of expression is.
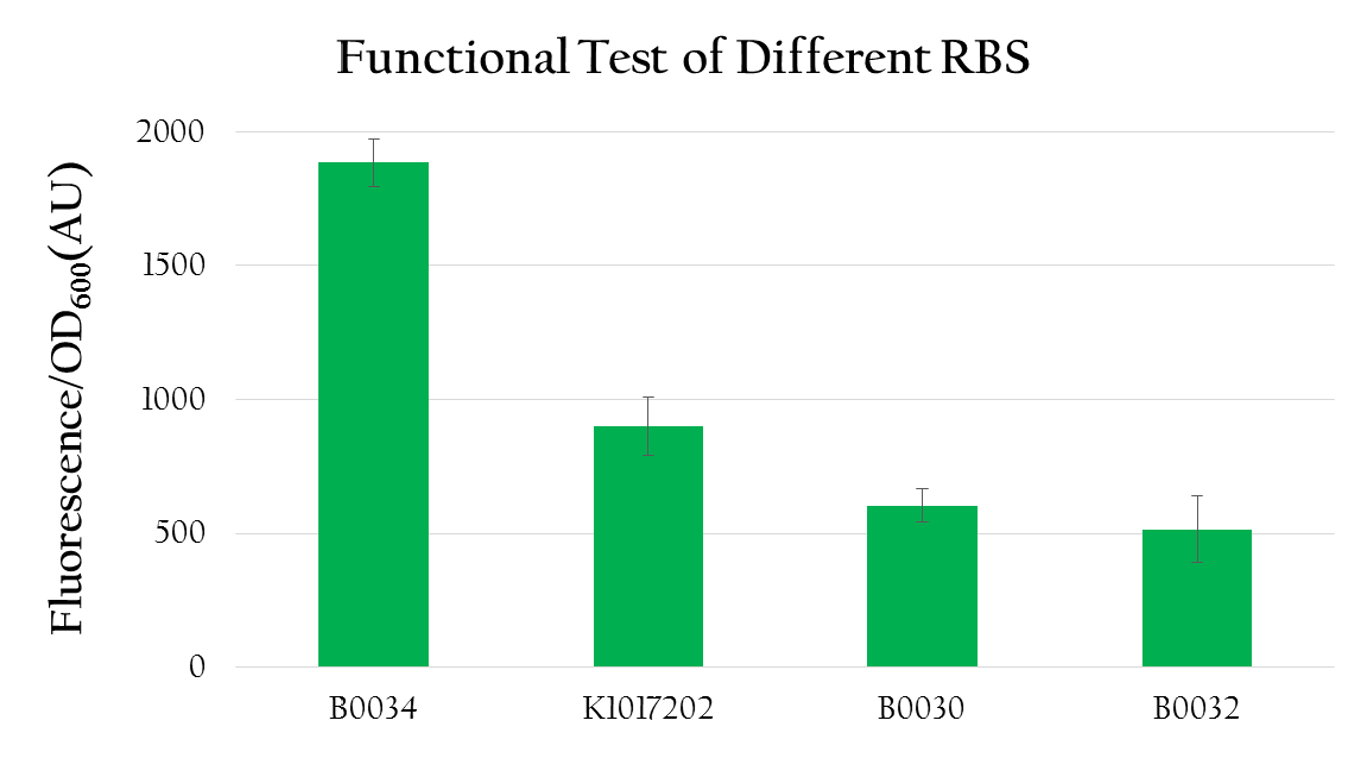
We measured the normalized expression for each biobrick mentioned above. We calculated the normalized expression by dividing fluorescence expression with the OD value measured, since the higher the OD value is, the larger the amount of bacteria that can express florescence would be. As shown in Figure 12, the normalized expression of the biobrick with B0034 is the highest and the one with K1017202 (rRBS) is the second highest, while the other two of B0032 and B0030 show weak expressions. This result implies that K1017202 can, in fact, serve as a functional RBS. In comparison to other RBS, K1017202 can provide moderate translational efficiency that is just lower than that of the highly efficient B0034.
Effect on E. Coli Growth
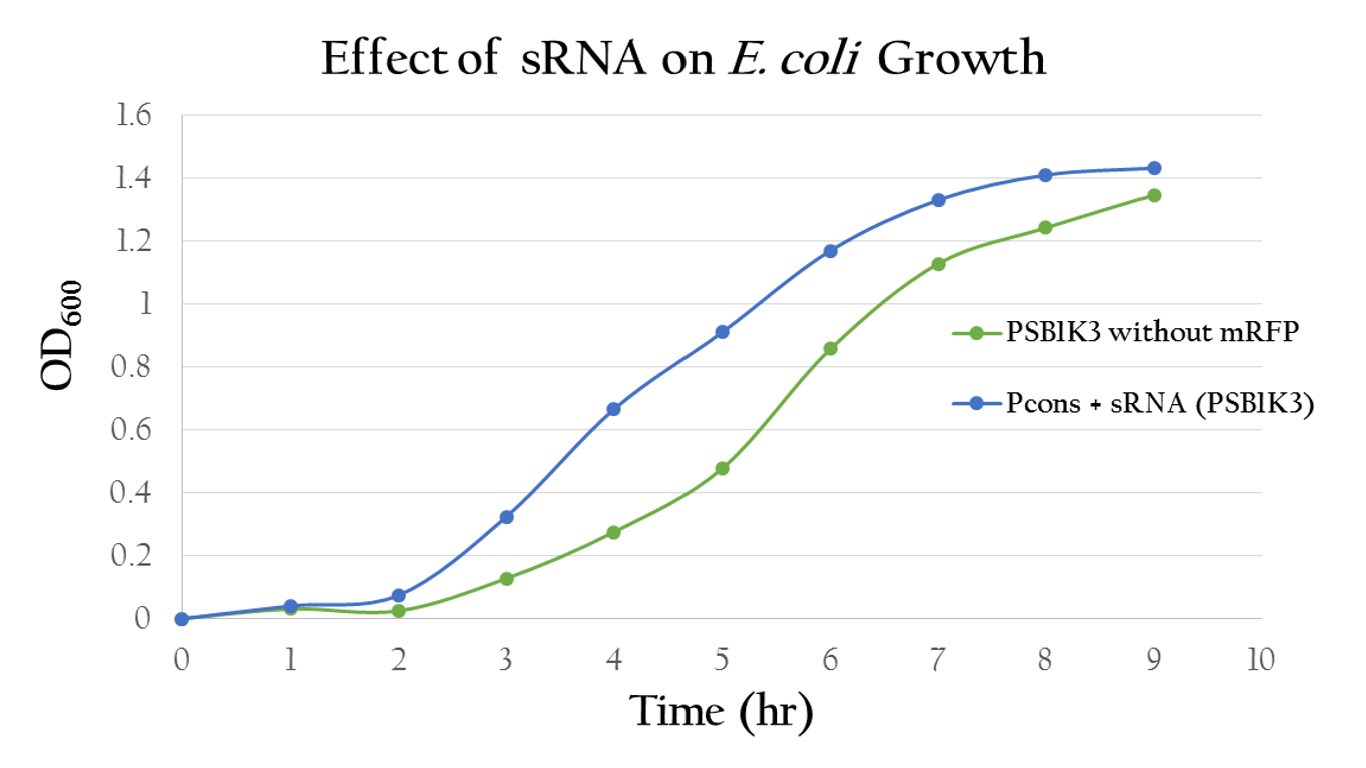
To test whether or not our sRNA would effect the growth of E. Coli, we compared the growth of E. Coli with PSB1C3 (without RFP) and the E. Coli growth with Pcons + sRNA. It can be observed from Figure 13 that the resultant growth curves are similar, showing no signs of growth interference. This result proves that our sRNA regulated system can be integrated into bacteria.
Expected sRNA regulation efficiency
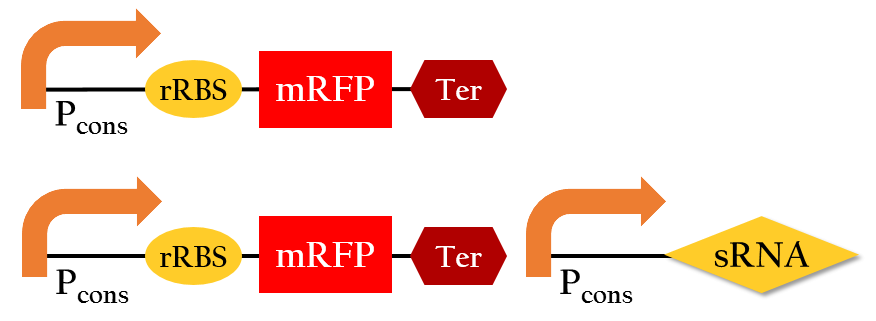
We employed the following biobricks to test the regulation efficiency of the sRNA we designed :
Pcons + rRBS + mRFP + J61048 and
Pcons + rRBS + mRFP + J61048 with Pcons + sRNA.
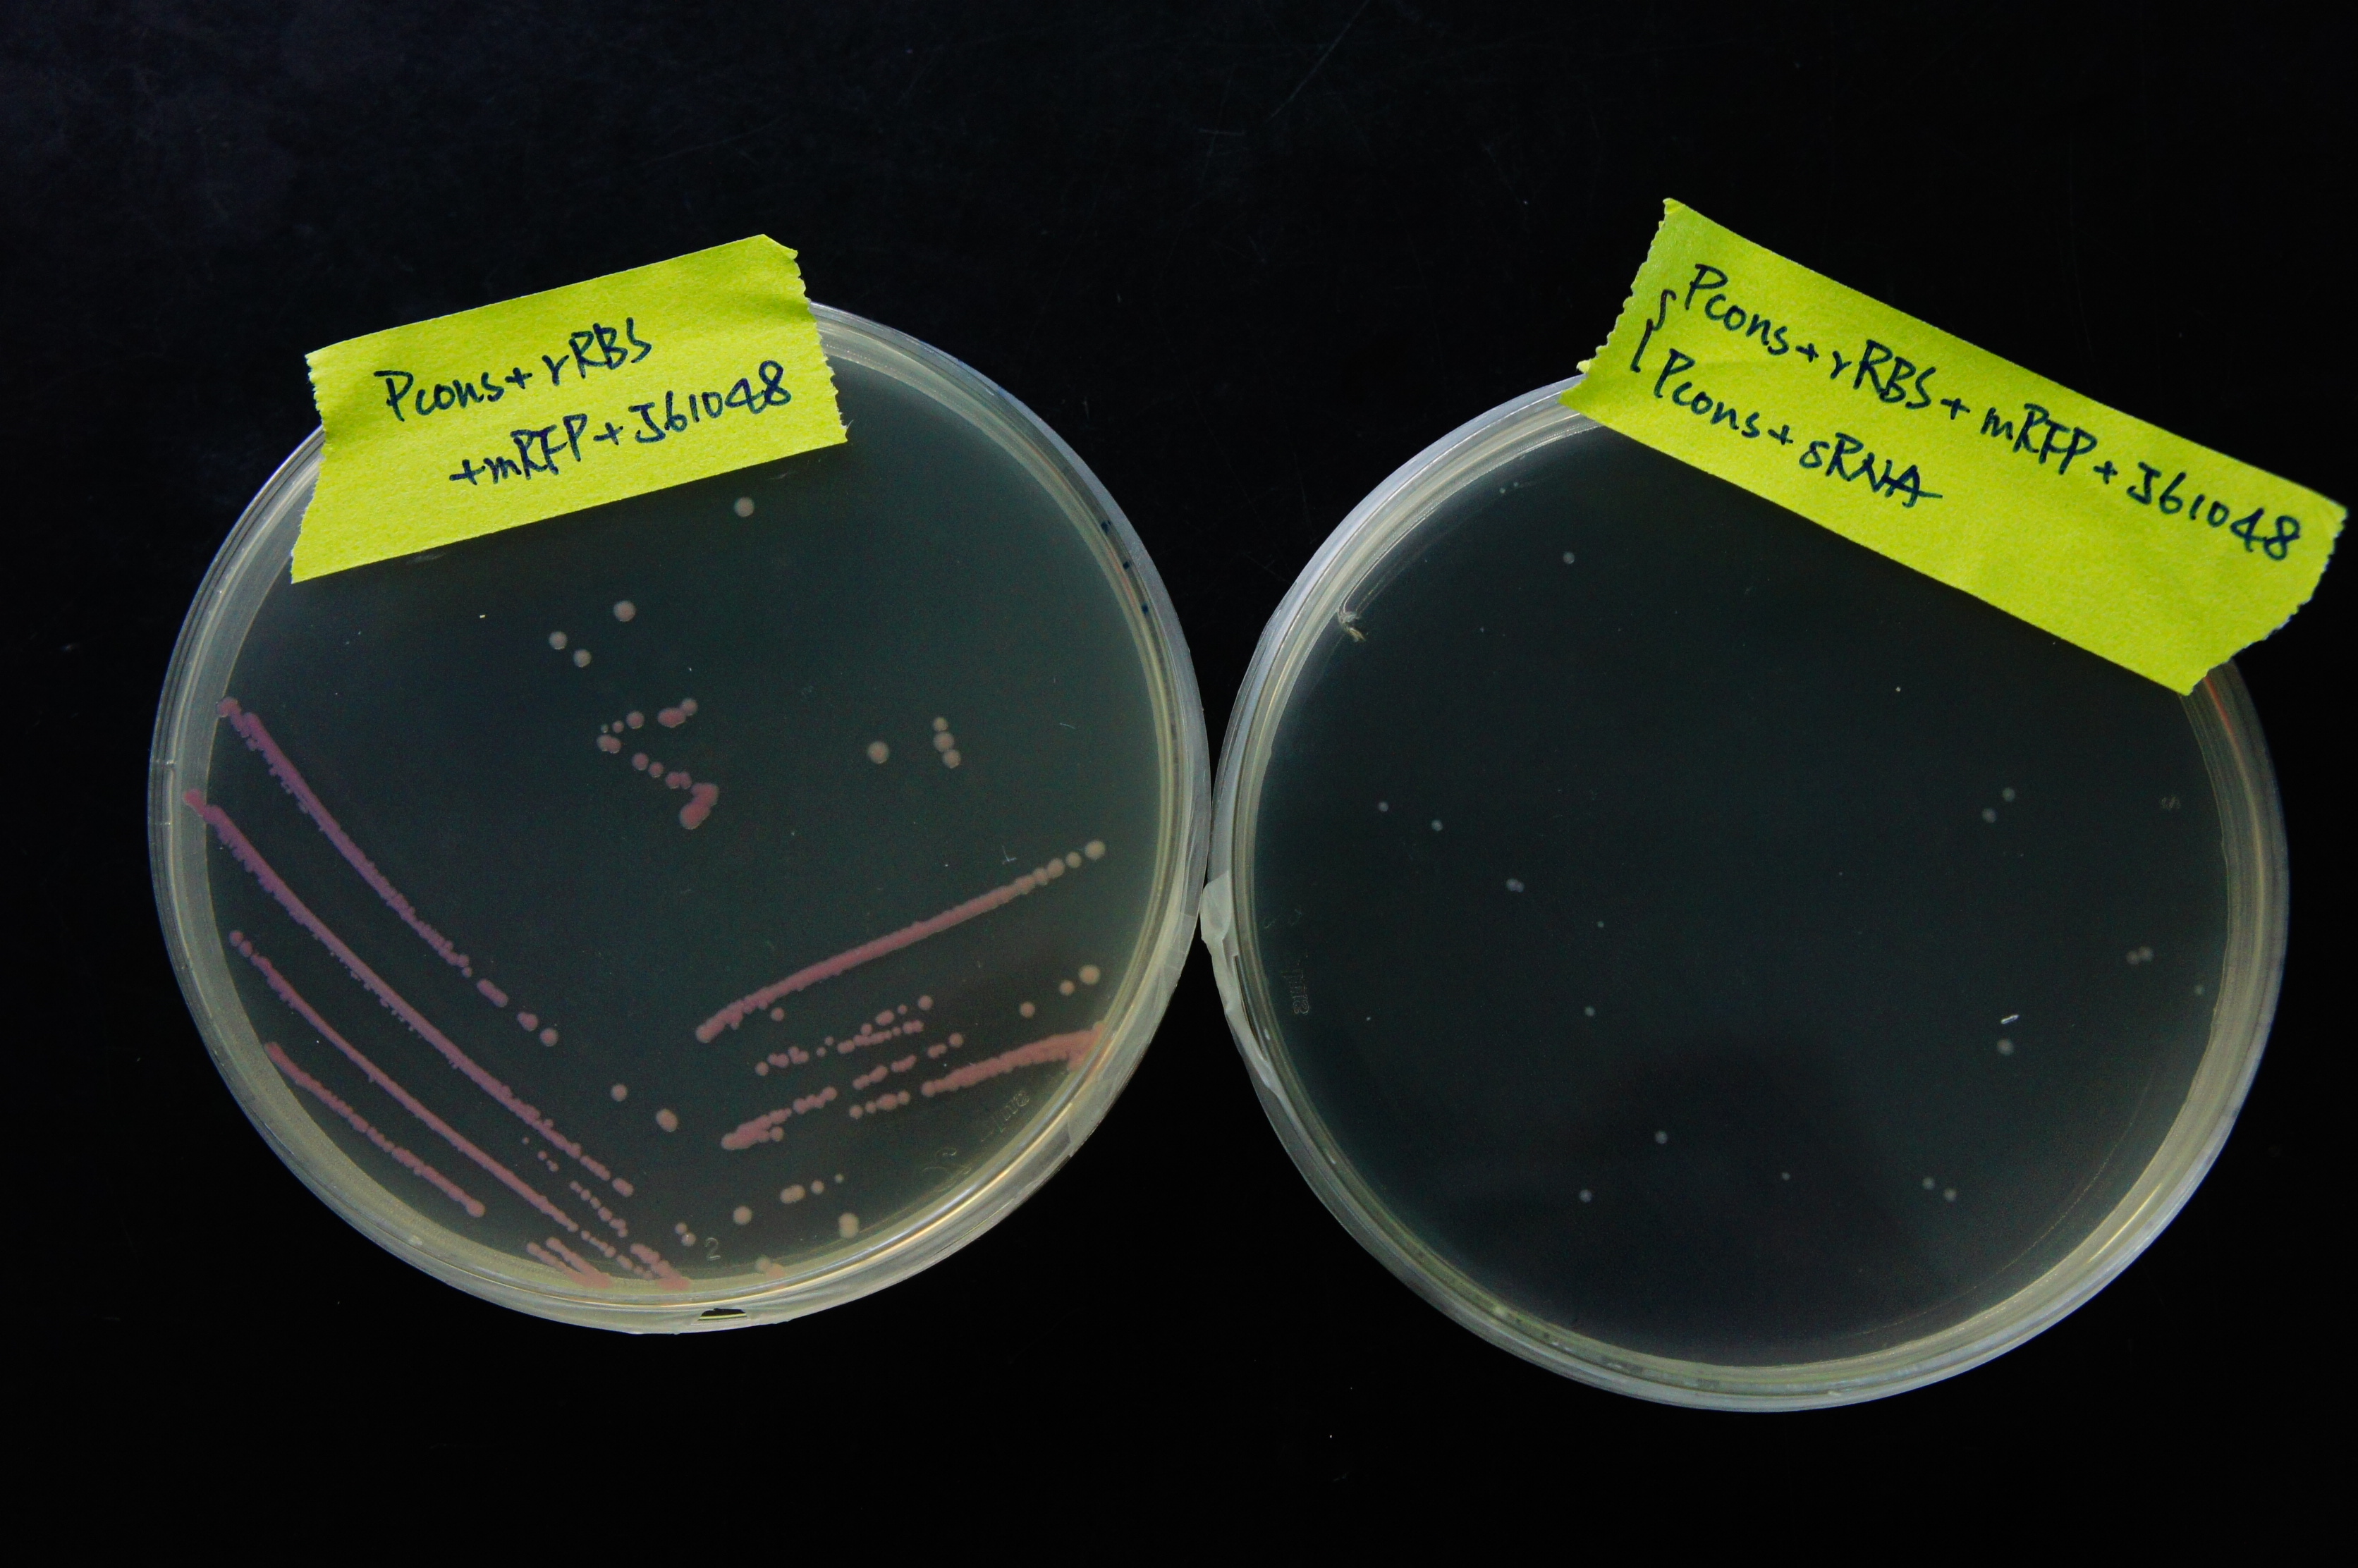
From Figure 15, it can be observed that sRNA can regulate RFP expression. The bacterial colonies without sRNA are red, showing high RFP expression. The bacterial colonies with sRNA, however, are white, suggesting that sRNA has regulated the RFP expression by base pairing to rRBS. The normalized expression without sRNA must be much higher than the expression with sRNA, or else we would not be able to easily distinguish the difference in RFP expression through the colors of the colonies.
Figure 16 shows quantitative analysis of the sRNA regulation efficiency. As shown in the figure, the normalized fluorescence expression of the colony which insert our artificial sRNA gene is much lower then the one without our artificial sRNA, indicating that our artificial sRNA can effectively suppress gene expression.
Besides, we also created an inducible sRNA inhibitory system, in order to further prove its function by integrating the LuxR-Plux system into it. This way, we could control its inhibitory time point and observe it's efficiency under certain concentration of AHL.
By comparing the normalized expression of Figure 18 (bacteria incubation without AHL addition) and Figure 19 (bacteria incubation with 10-6 M AHL addition), we can conclude that our sRNA system does work greatly under AHL induction to inhibit the downstream genes of rRBS.
 "
"

