Team:DTU-Denmark/Notebook/3 July 2013
From 2013.igem.org
(Difference between revisions)
(→Conclusion from today) |
|||
| Line 1: | Line 1: | ||
| - | {{:Team:DTU-Denmark/Templates/StartPage|}} | + | {{:Team:DTU-Denmark/Templates/StartPage|3_July_2013}} |
| Line 26: | Line 26: | ||
No results from restriction analysis because we saw no bands on the gel. We assume that this is caused by the low DNA concentration. | No results from restriction analysis because we saw no bands on the gel. We assume that this is caused by the low DNA concentration. | ||
| + | |||
| + | |||
| + | |||
| + | |||
| + | |||
| + | |||
| + | |||
| + | |||
| + | |||
| + | |||
| + | |||
| + | |||
| + | |||
| + | |||
| + | |||
| + | |||
| + | |||
| + | |||
Revision as of 17:12, 15 August 2013
3_July_2013
Contents |
208 lab
Main purposes today
Verify insert plated made Sunday. Run BioLector experiment.
who were in the lab
Kristian, Ariadni
Procedure
Gel on colony PCR from yesterday.
Setup of BioLector experiment.
MiniPrep selected colonies and make restriction digest analysis.
Results

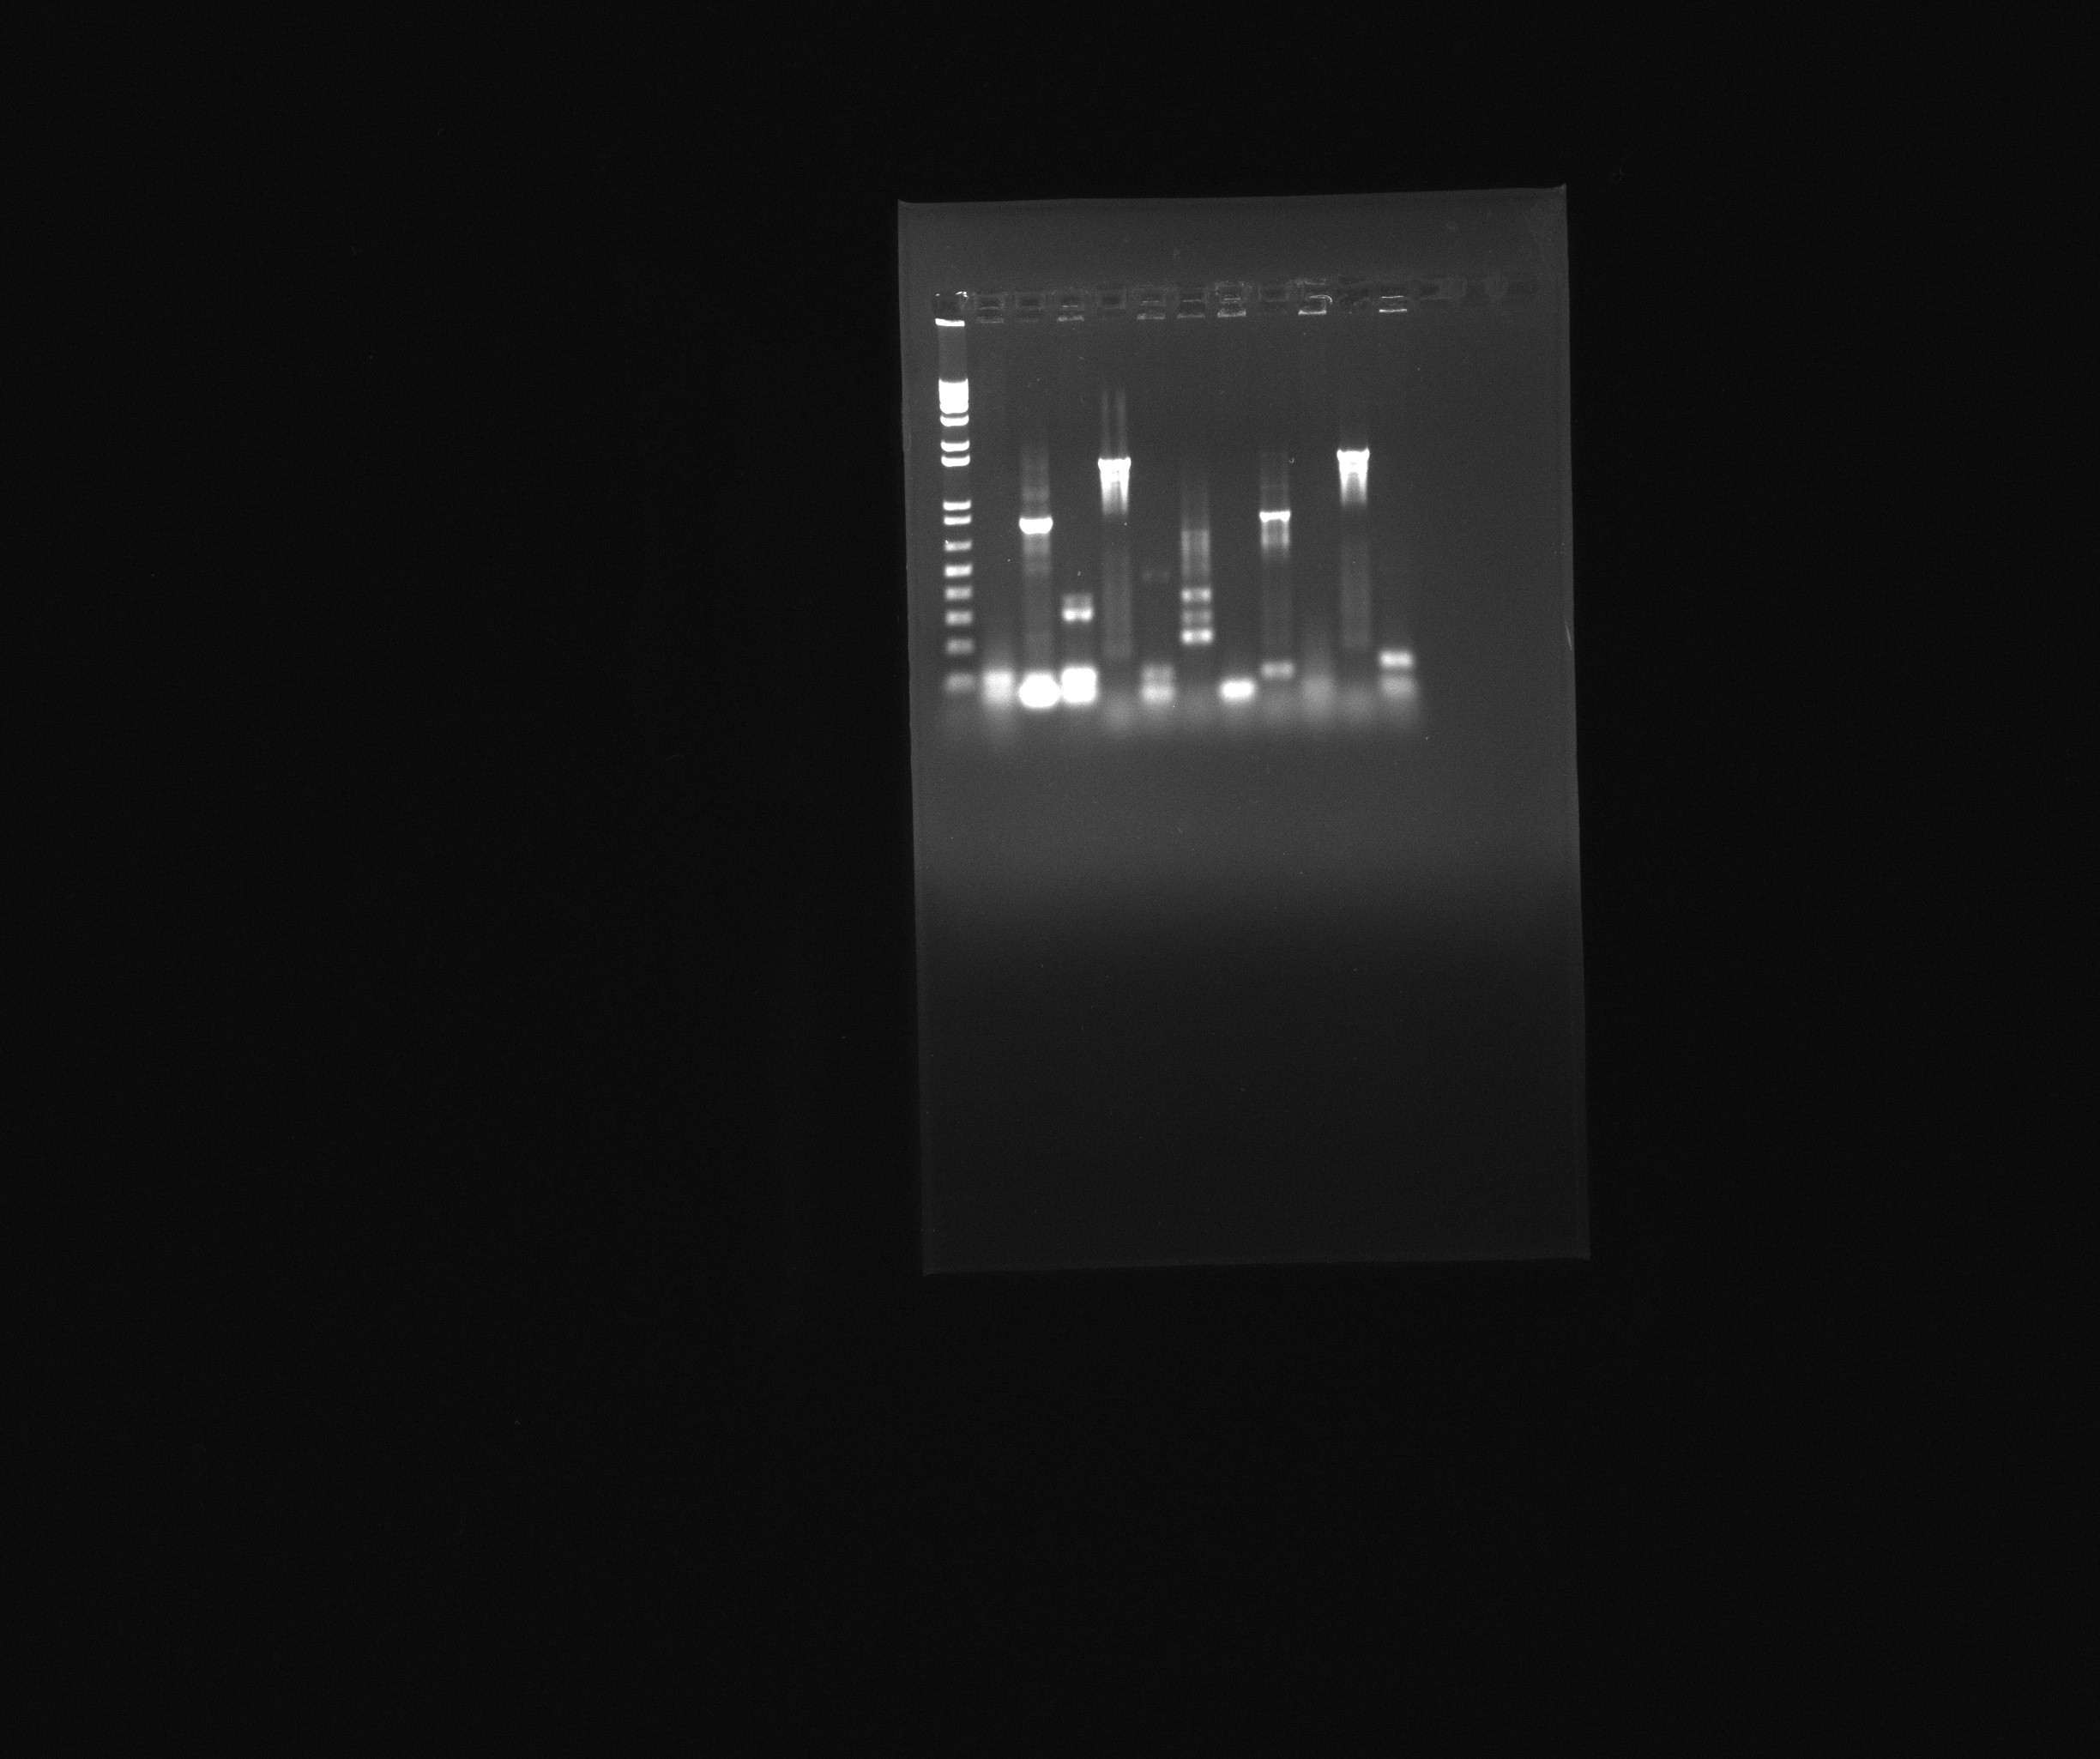
The gel from colony PCR. From left to right; Sec1, Sec2, Sec3, TAT2 1, TAT2 2, TAT2 3, TAT3 1, TAT3 2, TAT3 3, TAT3 1a, TAT3 2a. Where the different TATs are either with(TAT2) or without insertion of 2 additional amino acids to ease the primer design. 1kb plus ladder([http://www.invitrogen.com/site/us/en/home/Products-and-Services/Applications/DNA-RNA-Purification-Analysis/Nucleic-Acid-Gel-Electrophoresis/DNA-Ladders/Track-IT-Ladders.html invitrogen])
No results from restriction analysis because we saw no bands on the gel. We assume that this is caused by the low DNA concentration.
Conclusion from today
TAT2 1 and TAT3 1a have the right bands on colony PCR and will be further analyzed.
Navigate to the Previous or the Next Entry
 "
"


