Team:BYU Provo/Results/Experimental
From 2013.igem.org
(→Electron micrograph) |
|||
| (79 intermediate revisions not shown) | |||
| Line 36: | Line 36: | ||
<font face="Calibri" size="3"> | <font face="Calibri" size="3"> | ||
| - | __NOTOC__ | + | __NOTOC__=Phage Team= |
| + | |||
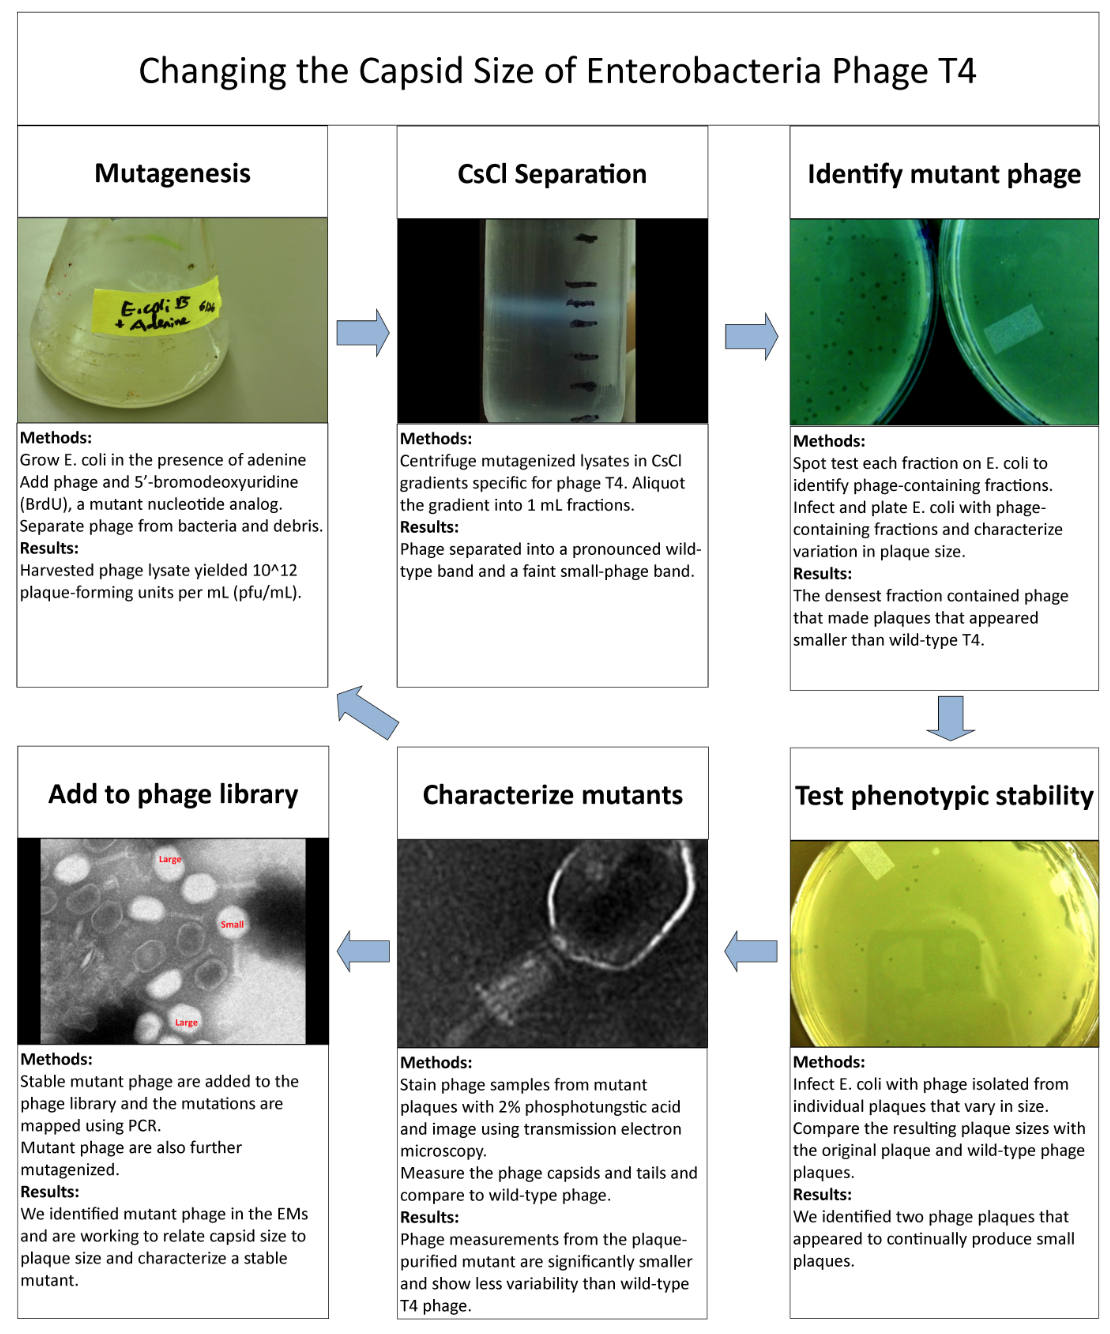
===Isolation of Phage Library=== | ===Isolation of Phage Library=== | ||
| + | [[File:Changethecapsidsize.png|550px|center|link=https://static.igem.org/mediawiki/2013/3/36/Changethecapsidsize.png]] | ||
| + | <br> | ||
<br> | <br> | ||
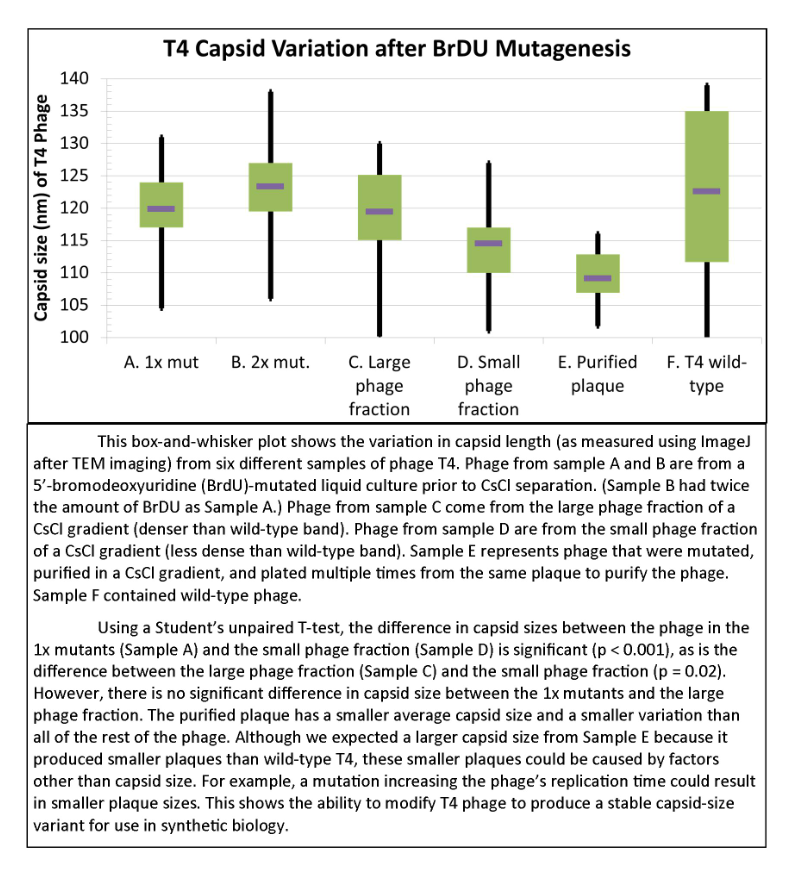
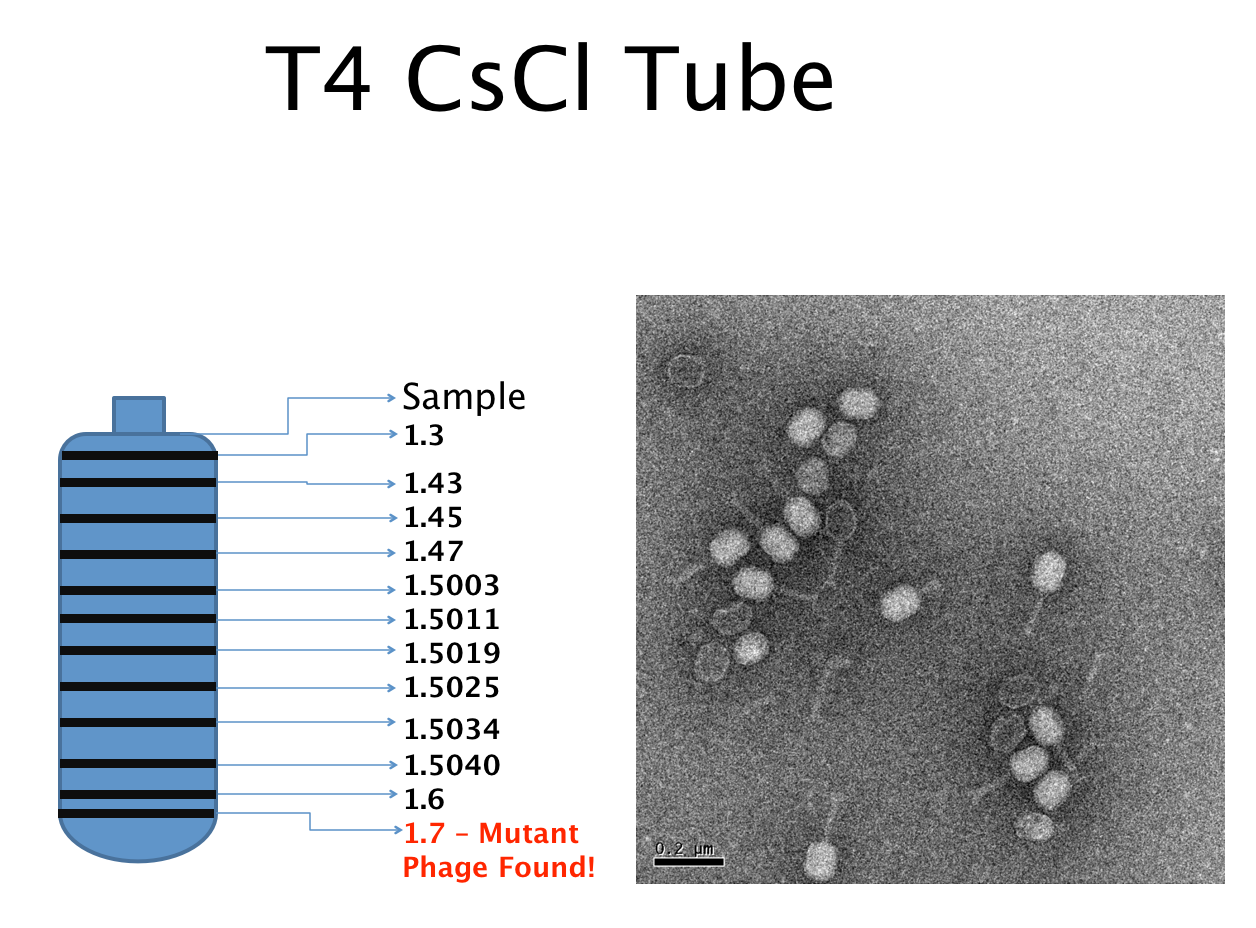
===Results of Mutant T4 Phage Isolation=== | ===Results of Mutant T4 Phage Isolation=== | ||
| + | [[File:T4capsidvariation.png|550px|center|link=https://static.igem.org/mediawiki/2013/4/4e/T4capsidvariation.png]] | ||
| + | |||
| + | |||
| + | [[File:T4CsClTube.png|550px|center|link=https://static.igem.org/mediawiki/2013/9/98/T4CsClTube.png]] | ||
| + | <br> | ||
<br> | <br> | ||
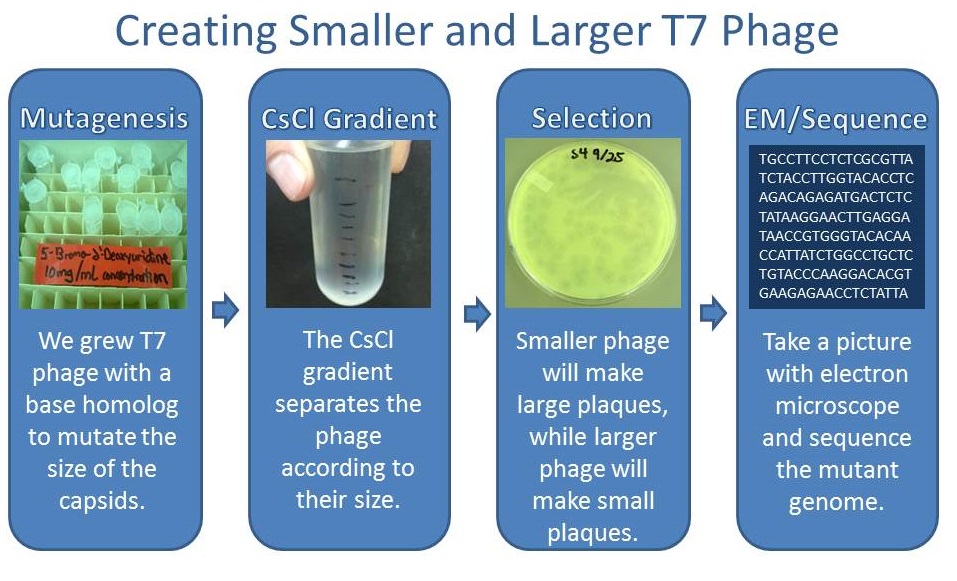
===Results of Mutant T7 Phage Isolation=== | ===Results of Mutant T7 Phage Isolation=== | ||
| + | ====Pre Regional Jamboree==== | ||
| + | |||
| + | [[File:T7protocol.png|550px|center|link=https://static.igem.org/mediawiki/2013/6/62/T7protocol.png]] | ||
| + | |||
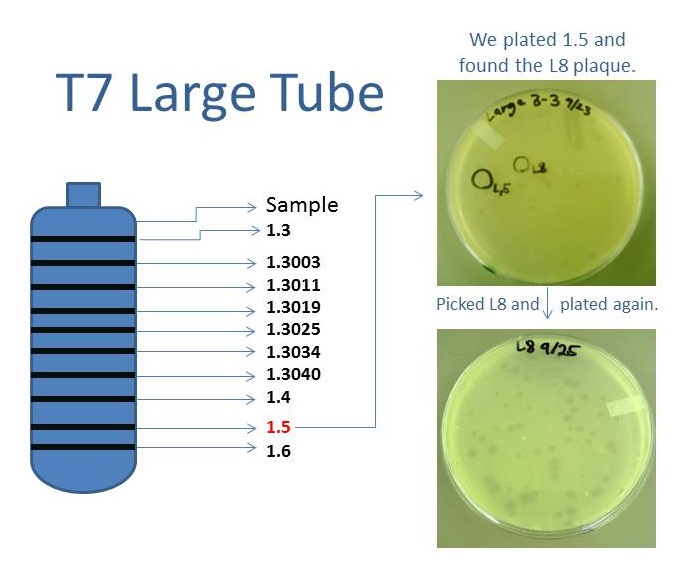
| + | As part of creating our bacteriophage library, we wanted to isolate both smaller and larger T7 bacteriophages. To do so, we first mutagenized T7 by growing it in the presence of 5-bromodeoxyuridine, a mutagenic base analog. This produced many mutant T7 bacteriophages, but they were hard to find amongst all the wild type T7. Therefore the phage purification team ran the mutagenized bacteriophage through a cesium chloride gradient. This separated the phage according to size, with the biggest phage traveling farther down. After determining where the mutant phage was in the gradient, we then plated the phage and looked for plaques that were smaller or larger than normal. Out of the 31 plaques we selected, two of them reproduced their plaque sizes, revealing that they were indeed mutant T7 bacteriophage! This can be seen in the two pictures below. The S4 plate with small phage produced larger plaques that were 0.592cm on average in diameter, while the L8 plate with large phage produced smaller plaques that were 0.264cm on average in diameter (Wild type T7 made plaques 0.388cm on average in diameter). The next step will be to get pictures of the phage with an electron microscope and sequence the genome to determine where the mutations occurred. | ||
| + | |||
| + | [[File:SmallResults.png|550px|center|link=https://static.igem.org/mediawiki/2013/f/fb/SmallResults.png]] | ||
| + | |||
| + | [[File:LargeResults.png|550px|center|link=https://static.igem.org/mediawiki/2013/8/81/LargeResults.png]] | ||
| + | |||
| + | ====Post Regional Jamboree==== | ||
| + | |||
| + | After returning from the Regional Jamboree, we focused on sequencing the major and minor capsid protein gene of our mutant phage and acquiring electron micrograph. This following section will present our newest findings up to Monday Oct 28. | ||
| + | |||
| + | =====Sequencing===== | ||
| + | |||
| + | We discovered that our S4 mutant (discussed above) contain a nucleotide insertion at position 407. In theory, this will lead to premature termination and truncated capsid protein. Below are figures comparing the gene and protein sequences of our mutant phage to that of WT. | ||
| + | |||
| + | [[File:S4geneseq.JPG|500px|center|link=]] | ||
| + | |||
| + | [[File:S4proteinseq.JPG|500px|center|link=]] | ||
| + | |||
| + | =====Protein Modeling===== | ||
| + | |||
| + | We tried to map the mutation we discovered. The following are figures displaying the amino acid residue where mutation/frameshift took place. As can be seen from these figures, our mutation are placed at the interface of where capsid proteins interact. In theory, this will alter protein interactions, which will lead to altered capsid size for T7. We are currently working on identifying the mechanism behind this mutation (insertion). | ||
| + | |||
| + | [[File:S4singlepeptide.JPG|500px|center|link=]] | ||
<br> | <br> | ||
| + | [[File:S4multiplepeptide.JPG|500px|center|link=]] | ||
| + | =====Electron micrograph===== | ||
| + | |||
| + | The following is one of the electron micrographs that we obtained of our S4 mutant. | ||
| + | |||
| + | [[File:S4electronmicrograph.JPG|400px|center|link=]] | ||
| + | <br> | ||
| + | <br> | ||
<br> | <br> | ||
| - | + | =Cholera Team= | |
| - | ===Cholera | + | ===Cholera Induces Bacteriophage Lambda From Lysogeny to its Lytic Cycle=== |
| + | [[File:byuk.jpg|250px|right|link=https://static.igem.org/mediawiki/2013/5/52/Byuk.jpg]] | ||
| + | |||
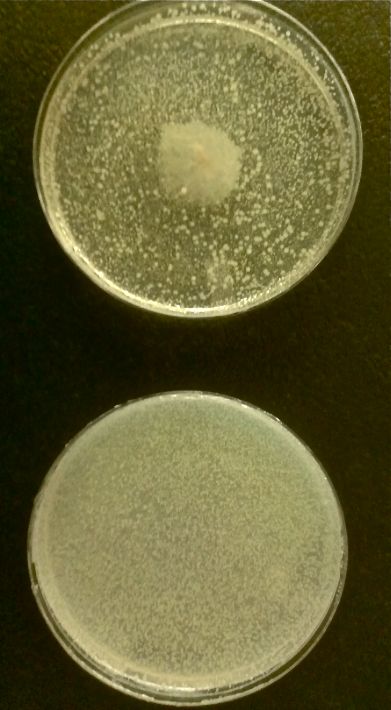
| + | We discovered that lysogenic bacteriophage lambda responds to ''V. cholerae'' by lysing its host. The picture to the right is of ''E.coli'' with integrated lambda prophage, plated as a top agar lawn. To the top plate we streaked cholera in the center, while the bottom plate had no cholera. | ||
| + | |||
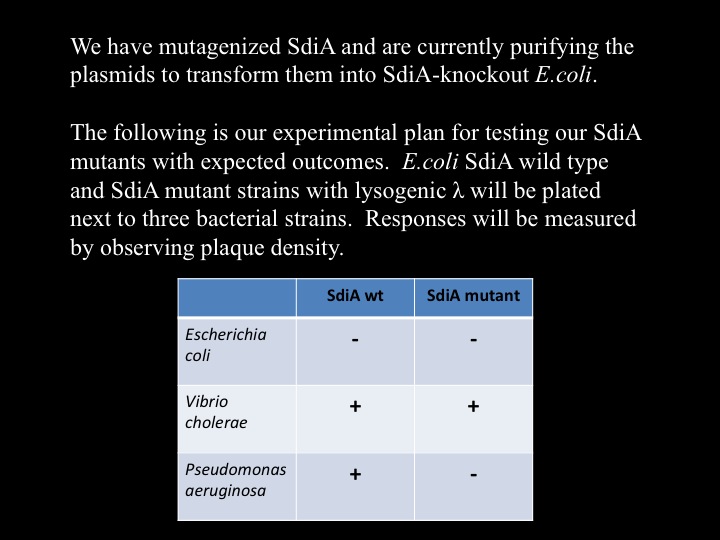
| + | We hypothesize that SdiA, a transcriptional activator in ''E.Coli'', senses cholera's autoinducer molecules. To test this, we have infected SdiA wild type and SdiA-knockout ''E.coli'' with bacteriophage lambda, and are in the process of performing top agar plaque-assay tests to confirm that lambda induction is SdiA-dependent. This image is in preparation. | ||
| + | |||
| + | Furthermore, we are researching an alternative method for lambda induction. Two proteins, cI and cro, are pivotal in determining whether lambda assumes, respectively, a lysogenic or lytic state. We hypothesize that overexpression of the cro protein will influence lambda into its lytic cycle. We have cloned CRO behind an arabinose-inducible promoter, transformed the plasmid into ''E.coli'', and infected with lambda. We will plate top agar lawns of this strain with and without arabinose, and anticipate results within the week. This image is in preparation. | ||
| + | |||
| + | <br> | ||
<br> | <br> | ||
===Designing SdiA to be Specific for Cholera=== | ===Designing SdiA to be Specific for Cholera=== | ||
| + | |||
| + | [[File:BYUK Apr10-4.JPG|250px|left|link=https://static.igem.org/mediawiki/2013/f/fc/BYUK_Apr10-4.JPG]] | ||
| + | |||
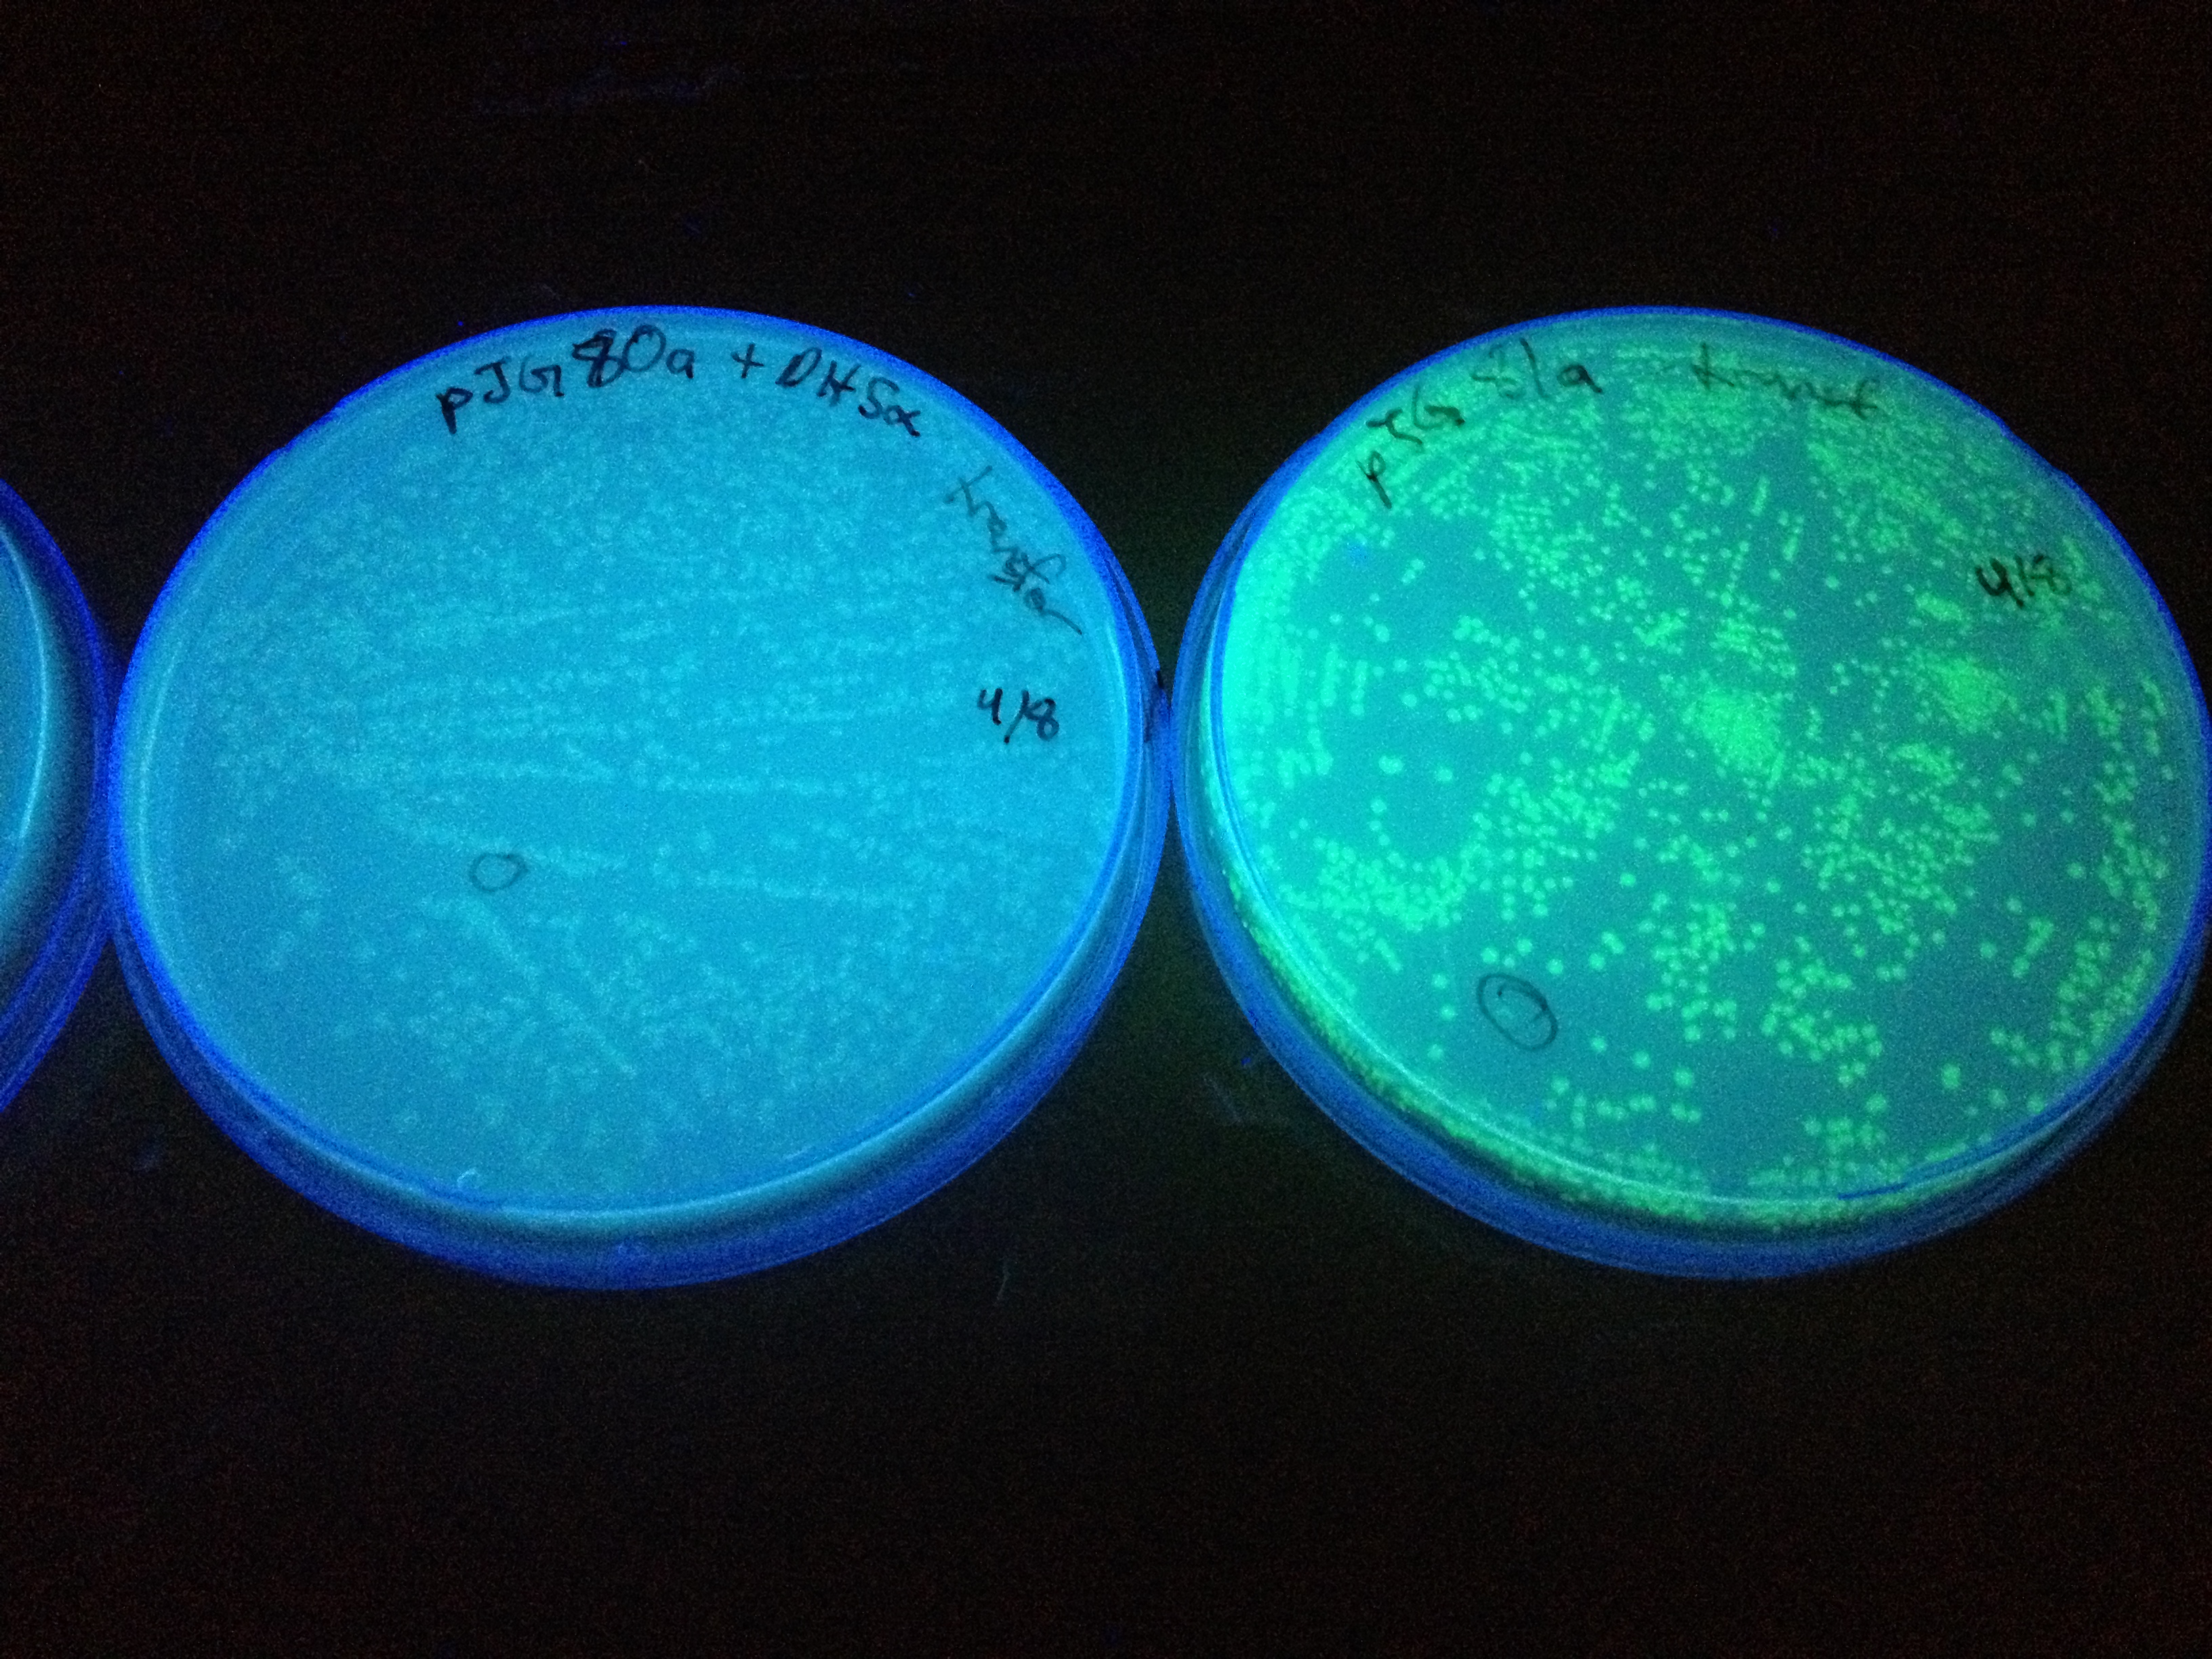
| + | In the beginning our plan was to transform into ''E.coli'' the most essential parts of the ''V.cholerae'' quorum sensing system. This was done, but our response proteins GFP and RFP did not work as expected.Shown above are colonies that were not supposed to be glowing. So we decided to try mutating the quorum sensing system ''E.coli'' already has such that it senses only CAI-1 which is an auto-inducer specific to ''V.cholerae''. The following is a schematic of our approach. | ||
| + | |||
| + | |||
| + | [[File:BYU slide 4 again.jpg|550px|center|link=https://static.igem.org/mediawiki/2013/6/67/BYU_slide_4_again.jpg]] | ||
| + | |||
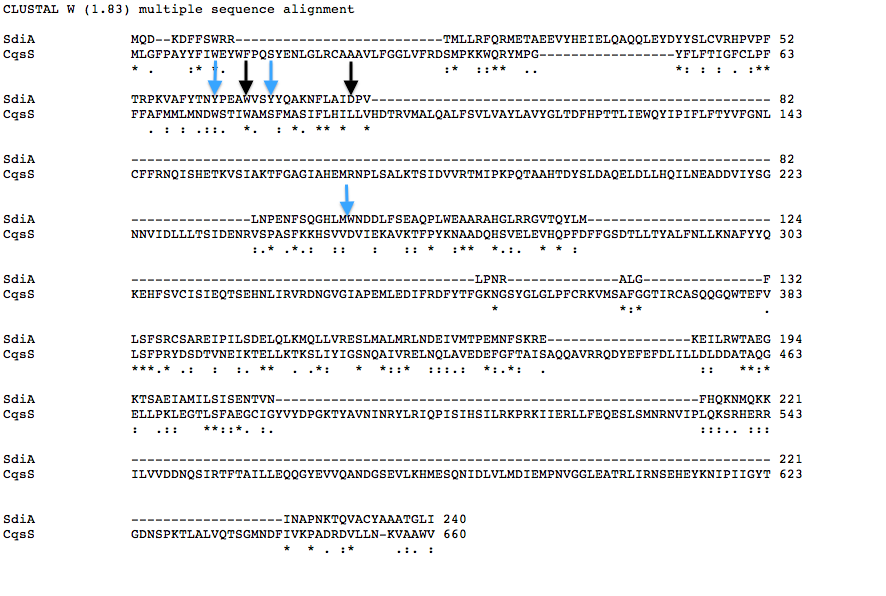
| + | Below is a T coffee alignment of SdiA (''E.coli'' protein involved in quorum sensing response) and CqsS (receptor protein in V.cholerae that can only sense CAI-1). It was found that the amino acids corresponding to the binding pocket for auto-inducers of both proteins lined up in the alignment indicating a similar structure. We hypothesized that if the five amino acids in SdiA that are known to be important in autoinducer molecule binding were changed we could make SdiA a more specific receptor instead of a promiscuous one. According to our alignment two of the five amino acids were already the same between SdiA and CqsS (black arrows). The other three amino acids we decided to change in SdiA through site directed mutagenesis to be the same as CqsS (blue arrows). | ||
| + | |||
| + | [[File:BYU CqsS SdiA binding pocket.png|550px|center|link=https://static.igem.org/mediawiki/2013/d/dc/BYU_CqsS_SdiA_binding_pocket.png]] | ||
| + | [[File:BYU planned experiment SdiAmutant.jpg|550px|center|link=https://static.igem.org/mediawiki/2013/4/48/BYU_planned_experiment_SdiAmutant.jpg]] | ||
<br> | <br> | ||
| + | <br> | ||
| + | |||
| + | ===Biofilm Inhibition by α-Amylase and Dispersin B=== | ||
| + | |||
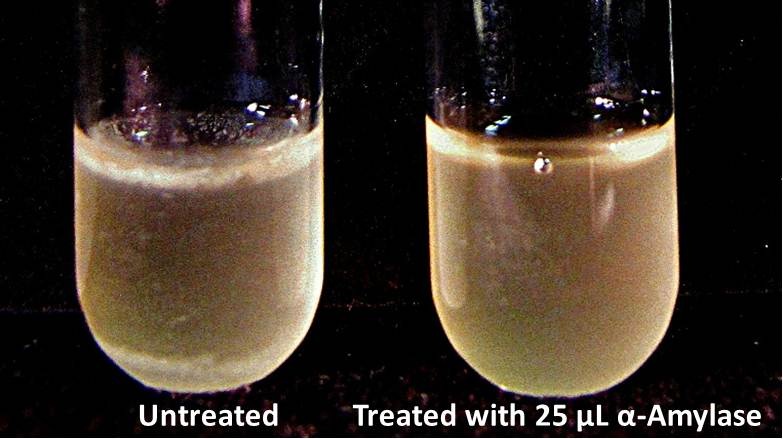
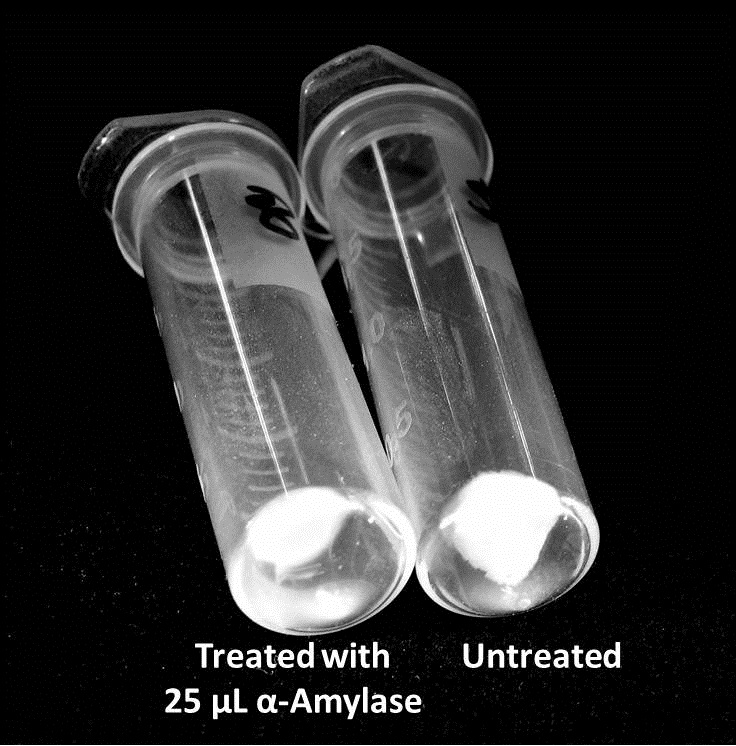
| + | The enzymatic activity of α-Amylase was characterized to determine its capacity to inhibit biofilm formation by ''V. cholerae''. Samples were prepared by adding 50 µL of ''V. cholerae'' culture to 1 mL of a high salt LB. The samples were then treated by the addition of purified α-Amylase in various concentrations and allowed to incubate at 30°C for 48 hours. After 48 hours the samples were examined and a distinct difference was seen in the amount of biofilm formed in the treated and untreated samples. | ||
| + | |||
| + | <div style="text-align:center;">[[Image:BYU2013-BiofilmAssay1.jpg|450 px|link=https://static.igem.org/mediawiki/2013/2/2e/BYU2013-BiofilmAssay1.jpg]] [[File:BYU2013-BiofilmAssay2.JPG|249 px|link=https://static.igem.org/mediawiki/2013/e/ea/BYU2013-BiofilmAssay2.JPG]]</div> | ||
| + | |||
| + | The samples were then transferred to eppendorf tubes and centrifuged at 16,000 × g for two minutes, the supernatant was discarded to remove the growth media, and the samples were resuspended in 200 µL ddH2O. The samples were then stained with 50 µL of a 0.03% CV solution and allowed to incubate for five minutes. The samples were again centrifuged at 16,000 × g for two minutes and the supernatant containing excess CV was discarded. The pelleted biofilm was then washed with 800 µL of 95% EtOH without resuspension, centrifuged for 30 seconds, and the EtOH was discarded. The EtOH wash was repeated twice more for a total of three washes. The samples were then resuspended in 200 µL EtOH, transferred to a 96-well plate, and incubated for five minutes. The plate was then shaken for ten seconds and absorbance readings were taken for each sample at 540 nm, the absorbance wavelength of CV. | ||
| + | |||
| + | <div style="text-align:center;">[[Image:BYU2013-BiofilmAssayGraph1.jpg|link=https://static.igem.org/mediawiki/2013/2/21/BYU2013-BiofilmAssayGraph1.jpg]]</div> | ||
| + | |||
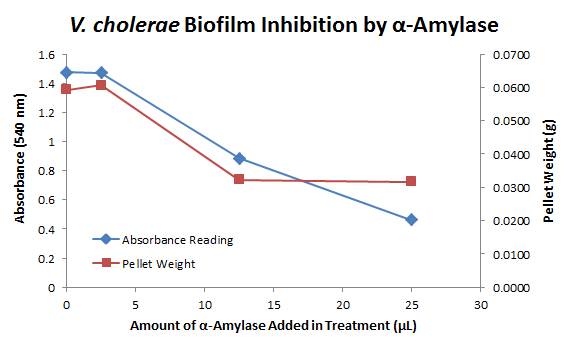
| + | The above graph shows both the average pellet weight and the average absorbance readings for samples treated with 0, 2.5, 12.5, and 25 µL of α-Amylase. There is a distinct reduction in the amount of biofilm growth between untreated and treated samples, with samples treated with 25 µL α-Amylase showing a 65.8% decrease in biofilm formation after 48 hours. While this clearly shows the ability of α-Amylase to inhibit biofilm formation by ''V. cholerae'', further characterization is needed to determine the capacity of α-Amylase to degrade preexisting biofilms. | ||
| + | |||
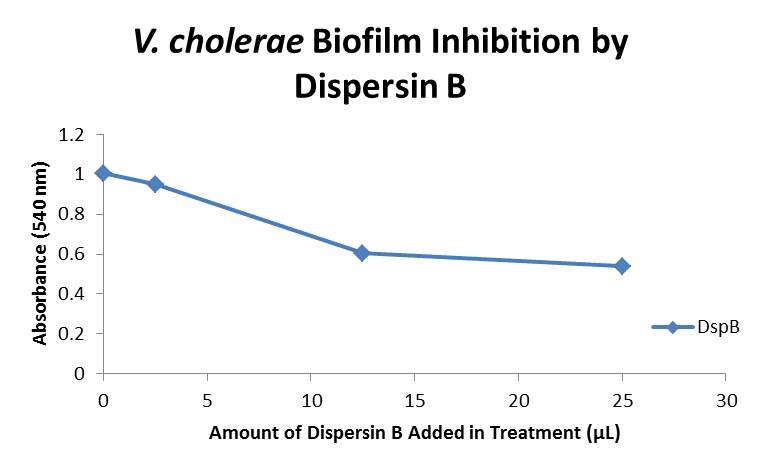
| + | The biofilm assay was again run with Dispersin B as the treatment enzyme, and similar data was gathered: | ||
| - | = | + | <div style="text-align:center;">[[File:BYU2013-BiofilmAssayGraph3.jpg | 500 px]]</div> |
| + | The above graph shows the average absorbance readings for samples treated with 0, 2.5, 12.5, and 25 µL of Dispersin B. There is a distinct reduction in the amount of biofilm growth between untreated and treated samples, with samples treated with 25 µL Dispersin B showing a 40.0% decrease in biofilm formation after 48 hours. While this clearly shows the ability of DspB to inhibit biofilm formation by V. cholerae, we did not see any degradation of the biofilm at treatment T = 48 with one hour of treatment incubation. Further characterization is needed to determine the capacity of Dispersin B to degrade preexisting biofilms. | ||
</font> | </font> | ||
Latest revision as of 03:49, 29 October 2013
| |
|
|
Phage TeamIsolation of Phage Library
Results of Mutant T4 Phage Isolation
Results of Mutant T7 Phage IsolationPre Regional JamboreeAs part of creating our bacteriophage library, we wanted to isolate both smaller and larger T7 bacteriophages. To do so, we first mutagenized T7 by growing it in the presence of 5-bromodeoxyuridine, a mutagenic base analog. This produced many mutant T7 bacteriophages, but they were hard to find amongst all the wild type T7. Therefore the phage purification team ran the mutagenized bacteriophage through a cesium chloride gradient. This separated the phage according to size, with the biggest phage traveling farther down. After determining where the mutant phage was in the gradient, we then plated the phage and looked for plaques that were smaller or larger than normal. Out of the 31 plaques we selected, two of them reproduced their plaque sizes, revealing that they were indeed mutant T7 bacteriophage! This can be seen in the two pictures below. The S4 plate with small phage produced larger plaques that were 0.592cm on average in diameter, while the L8 plate with large phage produced smaller plaques that were 0.264cm on average in diameter (Wild type T7 made plaques 0.388cm on average in diameter). The next step will be to get pictures of the phage with an electron microscope and sequence the genome to determine where the mutations occurred. Post Regional JamboreeAfter returning from the Regional Jamboree, we focused on sequencing the major and minor capsid protein gene of our mutant phage and acquiring electron micrograph. This following section will present our newest findings up to Monday Oct 28. SequencingWe discovered that our S4 mutant (discussed above) contain a nucleotide insertion at position 407. In theory, this will lead to premature termination and truncated capsid protein. Below are figures comparing the gene and protein sequences of our mutant phage to that of WT. 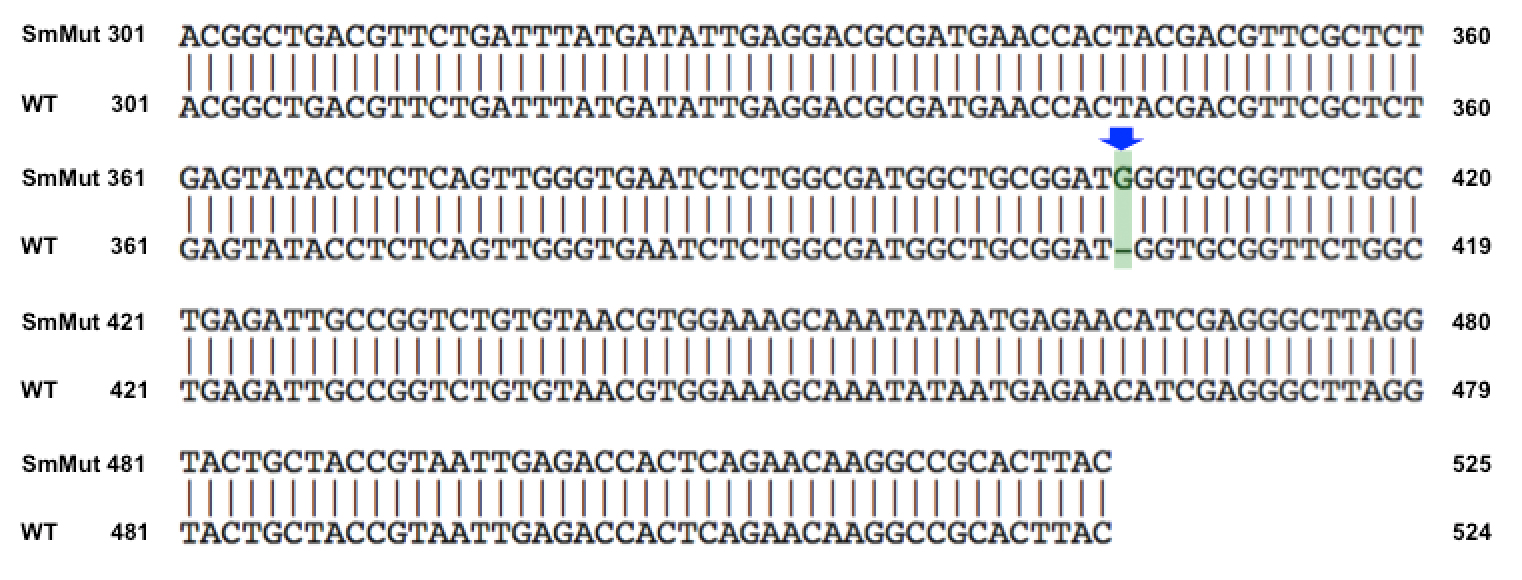  Protein ModelingWe tried to map the mutation we discovered. The following are figures displaying the amino acid residue where mutation/frameshift took place. As can be seen from these figures, our mutation are placed at the interface of where capsid proteins interact. In theory, this will alter protein interactions, which will lead to altered capsid size for T7. We are currently working on identifying the mechanism behind this mutation (insertion). 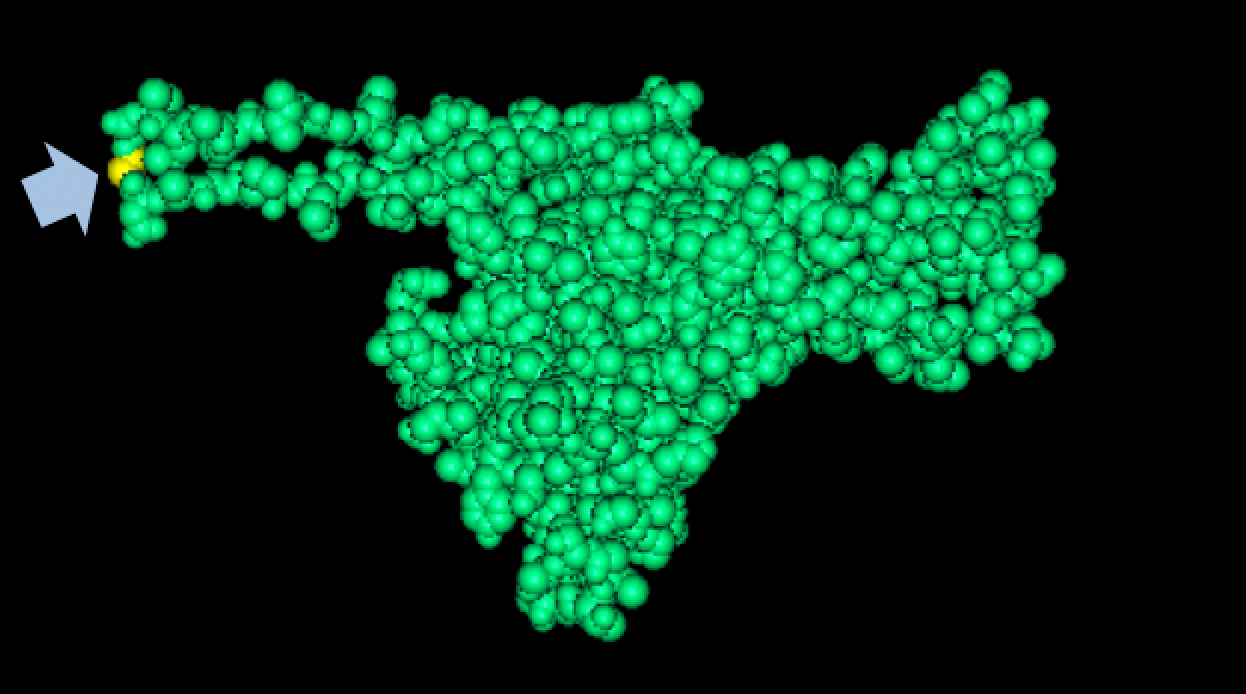
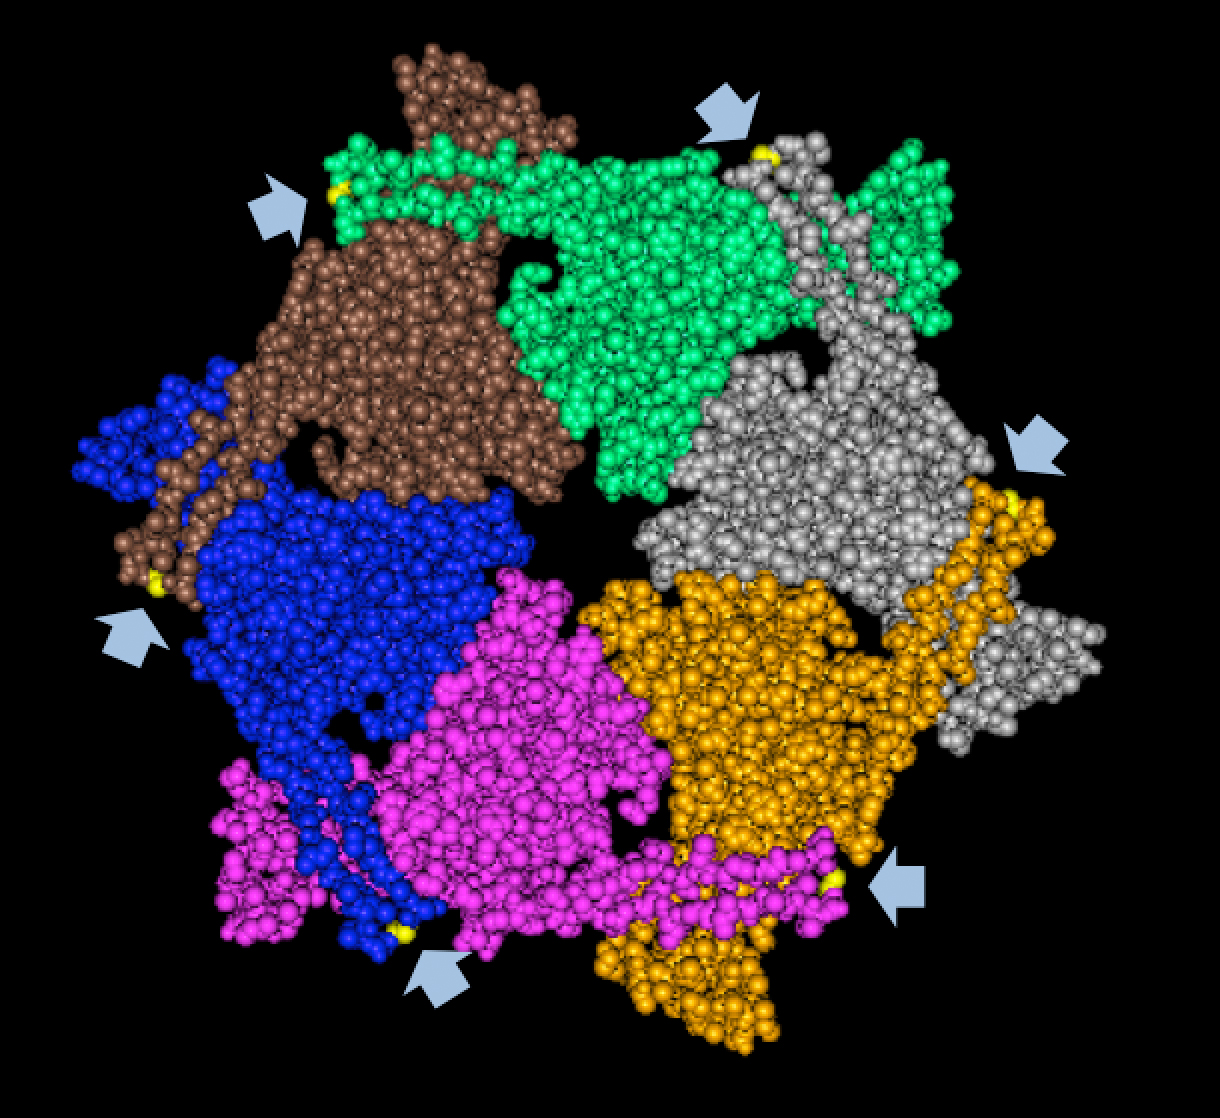 Electron micrographThe following is one of the electron micrographs that we obtained of our S4 mutant. 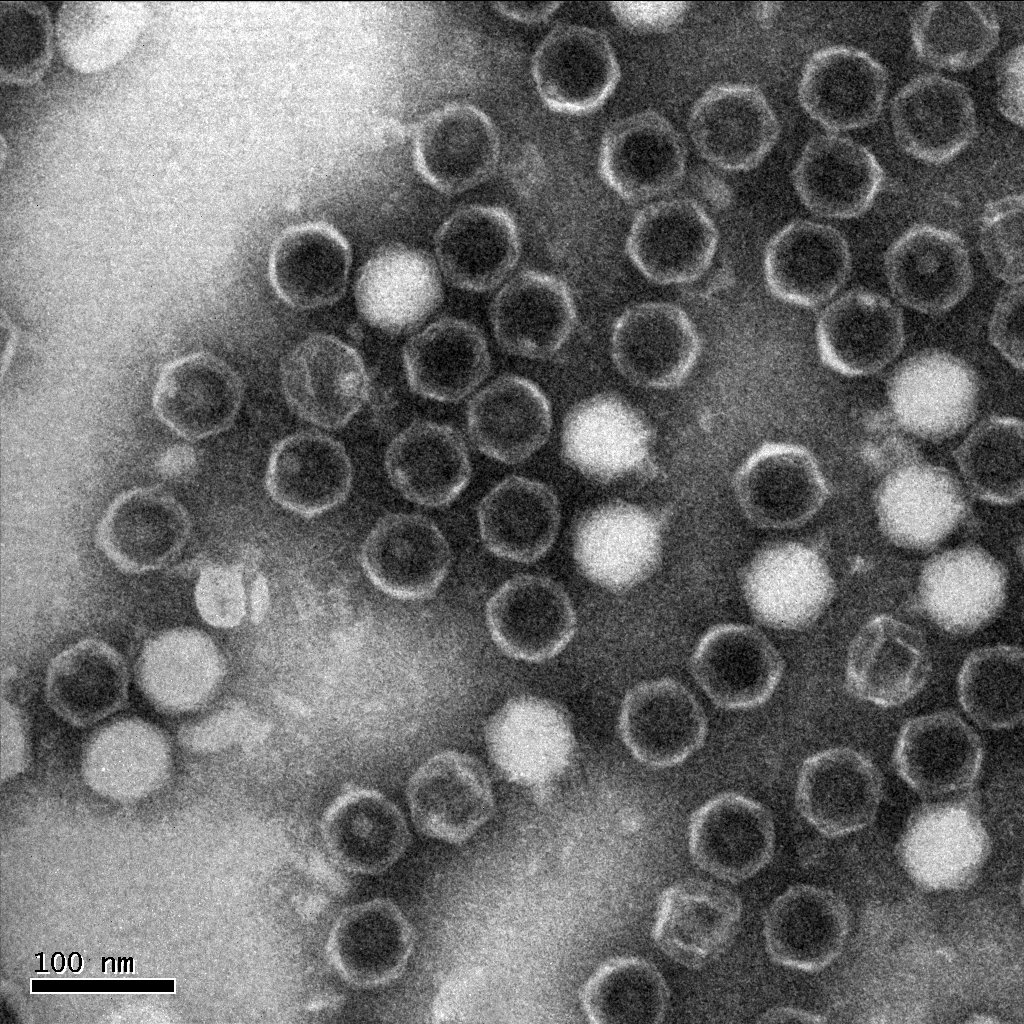
Cholera TeamCholera Induces Bacteriophage Lambda From Lysogeny to its Lytic CycleWe discovered that lysogenic bacteriophage lambda responds to V. cholerae by lysing its host. The picture to the right is of E.coli with integrated lambda prophage, plated as a top agar lawn. To the top plate we streaked cholera in the center, while the bottom plate had no cholera. We hypothesize that SdiA, a transcriptional activator in E.Coli, senses cholera's autoinducer molecules. To test this, we have infected SdiA wild type and SdiA-knockout E.coli with bacteriophage lambda, and are in the process of performing top agar plaque-assay tests to confirm that lambda induction is SdiA-dependent. This image is in preparation. Furthermore, we are researching an alternative method for lambda induction. Two proteins, cI and cro, are pivotal in determining whether lambda assumes, respectively, a lysogenic or lytic state. We hypothesize that overexpression of the cro protein will influence lambda into its lytic cycle. We have cloned CRO behind an arabinose-inducible promoter, transformed the plasmid into E.coli, and infected with lambda. We will plate top agar lawns of this strain with and without arabinose, and anticipate results within the week. This image is in preparation.
Designing SdiA to be Specific for CholeraIn the beginning our plan was to transform into E.coli the most essential parts of the V.cholerae quorum sensing system. This was done, but our response proteins GFP and RFP did not work as expected.Shown above are colonies that were not supposed to be glowing. So we decided to try mutating the quorum sensing system E.coli already has such that it senses only CAI-1 which is an auto-inducer specific to V.cholerae. The following is a schematic of our approach.
Below is a T coffee alignment of SdiA (E.coli protein involved in quorum sensing response) and CqsS (receptor protein in V.cholerae that can only sense CAI-1). It was found that the amino acids corresponding to the binding pocket for auto-inducers of both proteins lined up in the alignment indicating a similar structure. We hypothesized that if the five amino acids in SdiA that are known to be important in autoinducer molecule binding were changed we could make SdiA a more specific receptor instead of a promiscuous one. According to our alignment two of the five amino acids were already the same between SdiA and CqsS (black arrows). The other three amino acids we decided to change in SdiA through site directed mutagenesis to be the same as CqsS (blue arrows).
Biofilm Inhibition by α-Amylase and Dispersin BThe enzymatic activity of α-Amylase was characterized to determine its capacity to inhibit biofilm formation by V. cholerae. Samples were prepared by adding 50 µL of V. cholerae culture to 1 mL of a high salt LB. The samples were then treated by the addition of purified α-Amylase in various concentrations and allowed to incubate at 30°C for 48 hours. After 48 hours the samples were examined and a distinct difference was seen in the amount of biofilm formed in the treated and untreated samples. The samples were then transferred to eppendorf tubes and centrifuged at 16,000 × g for two minutes, the supernatant was discarded to remove the growth media, and the samples were resuspended in 200 µL ddH2O. The samples were then stained with 50 µL of a 0.03% CV solution and allowed to incubate for five minutes. The samples were again centrifuged at 16,000 × g for two minutes and the supernatant containing excess CV was discarded. The pelleted biofilm was then washed with 800 µL of 95% EtOH without resuspension, centrifuged for 30 seconds, and the EtOH was discarded. The EtOH wash was repeated twice more for a total of three washes. The samples were then resuspended in 200 µL EtOH, transferred to a 96-well plate, and incubated for five minutes. The plate was then shaken for ten seconds and absorbance readings were taken for each sample at 540 nm, the absorbance wavelength of CV. The above graph shows both the average pellet weight and the average absorbance readings for samples treated with 0, 2.5, 12.5, and 25 µL of α-Amylase. There is a distinct reduction in the amount of biofilm growth between untreated and treated samples, with samples treated with 25 µL α-Amylase showing a 65.8% decrease in biofilm formation after 48 hours. While this clearly shows the ability of α-Amylase to inhibit biofilm formation by V. cholerae, further characterization is needed to determine the capacity of α-Amylase to degrade preexisting biofilms. The biofilm assay was again run with Dispersin B as the treatment enzyme, and similar data was gathered: The above graph shows the average absorbance readings for samples treated with 0, 2.5, 12.5, and 25 µL of Dispersin B. There is a distinct reduction in the amount of biofilm growth between untreated and treated samples, with samples treated with 25 µL Dispersin B showing a 40.0% decrease in biofilm formation after 48 hours. While this clearly shows the ability of DspB to inhibit biofilm formation by V. cholerae, we did not see any degradation of the biofilm at treatment T = 48 with one hour of treatment incubation. Further characterization is needed to determine the capacity of Dispersin B to degrade preexisting biofilms.
|
 "
"
