Team:Lethbridge/results
From 2013.igem.org
(corrected methods description) |
|||
| (4 intermediate revisions not shown) | |||
| Line 53: | Line 53: | ||
<td>Harland Brandon</td> | <td>Harland Brandon</td> | ||
<td>828</td> | <td>828</td> | ||
| + | <td> </td> | ||
| + | </tr> | ||
| + | <tr> | ||
| + | <td>[http://parts.igem.org/Part:BBa_K1210003 BBa_K1210003]</td> | ||
| + | <td>Device</td> | ||
| + | <td>Tagged dual coding test construct</td> | ||
| + | <td>Harland Brandon</td> | ||
| + | <td>1850</td> | ||
<td> </td> | <td> </td> | ||
</tr> | </tr> | ||
| Line 64: | Line 72: | ||
<p><b>PK401 Overexpression</b></p> | <p><b>PK401 Overexpression</b></p> | ||
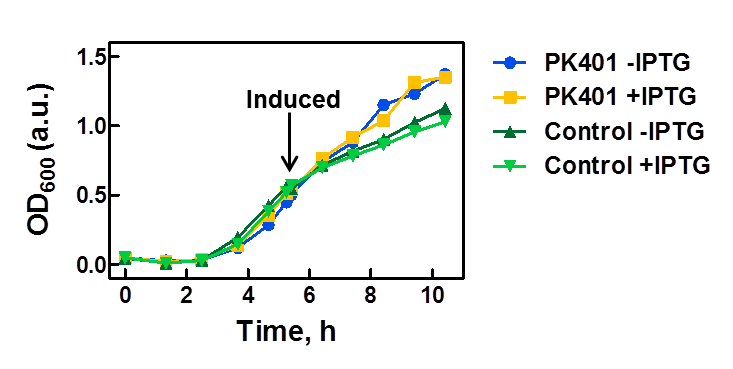
| - | <p>The PK401 construct was overexpressed to test and characterize the construct for frameshifting ability. To do this, cultures of E. coli DH5α containing either the PK401 plasmid or an empty control plasmid were grown from glycerol stocks overnight at 37°C in 50 mL LB media containing Kanamycin ( | + | <p>The PK401 construct was overexpressed to test and characterize the construct for frameshifting ability. To do this, cultures of E. coli DH5α containing either the PK401 plasmid or an empty control plasmid were grown from glycerol stocks overnight at 37°C in 50 mL LB media containing Kanamycin (50 µg/mL). These cultures were used the next day to inoculate 500 mL of LB media to a starting optical density at 600 nm (OD600) near 0.05. The OD600 was monitored and induced with 1 mM IPTG once reaching an OD600 of 0.6 (Fig. 1). Growth was monitored hourly, and equivalent amounts of cells were taken as samples for SDS-PAGE analysis up to 5 h after induction. The cultures were harvested by centrifuging at 5000 x g and shock frozen to store at -80°C.</p> |
<center>[[File:ULeth2013_PK401-overexpression.png|600px]]</center> | <center>[[File:ULeth2013_PK401-overexpression.png|600px]]</center> | ||
| Line 78: | Line 86: | ||
<br> | <br> | ||
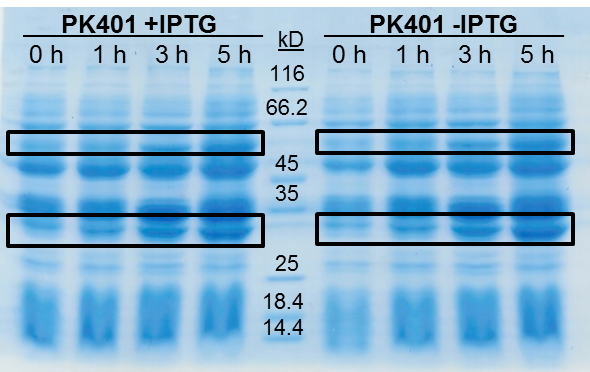
| - | <p><b>Figure 2. | + | <p><b>Figure 2. Overexpression of non-frameshifted and -1 frameshifted protein products from the PK401 construct.</b> Equivalent amounts of cells at 0, 1, 3, and 5 h after induction with IPTG (PK401 +IPTG) were analyzed by 12% SDS-PAGE. The same time samples from the uninduced culture were also analyzed (PK401 –IPTG). Black boxes indicate bands of increasing intensity that migrated with an approximate molecular weight of 60 kD and 30 kD, corresponding to the -1 frameshifted CFP-PK401-YFP fusion product and the non-frameshifted CFP product, respectively.</p><br> |
| + | |||
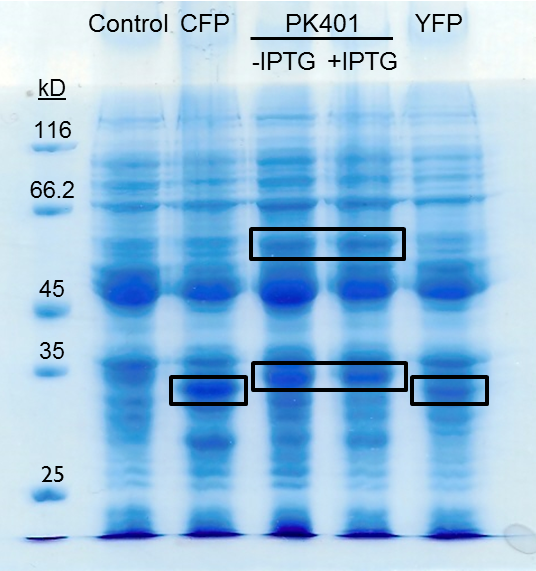
| + | <p>The PK401 overexpression products were directly compared to the overexpression of CFP (BBa_K331033) and YFP (BBa_K331031) (Fig. 3). The smaller product from PK401 expression (non-frameshifted CFP) appears slightly larger in size than either CFP or YFP alone. This is likely due to the additional amino acids that are translated in the zero frame before encountering the stop codon after the pseudoknot.</p> | ||
| + | |||
| + | <br> | ||
| + | <center>[[Image:ULeth2013_PK401expression.png|400px]]</center> | ||
| + | <br> | ||
| + | |||
| + | <p><b>Figure 3. Comparison of PK401 over-expression products to CFP and YFP.</b> Equivalent amounts of cells from the expression of CFP (BBa_K331033), YFP (BBa_K331031), PK401 before (-IPTG) and after induction (+IPTG), and a non-expressing YFP construct (BBa_K331035) were analyzed by 12% SDS-PAGE. Black boxes indicate over-expressed protein products, including CFP and YFP at approximately 29 kD, the non-frameshifted CFP product from BBa_K1210000 around 30 kD, and -1 frameshifted CFP-PK401-YFP fusion product at 60 kD.</p><br> | ||
<p><b>CFP and YFP Fluorescence from PK401 Overexpression</b></p> | <p><b>CFP and YFP Fluorescence from PK401 Overexpression</b></p> | ||
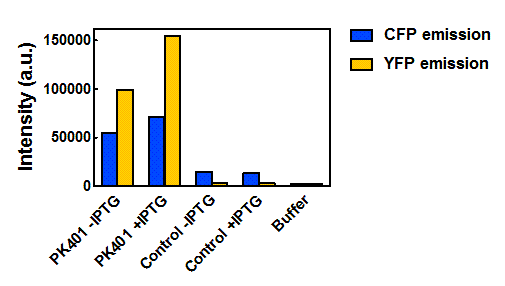
<p>To confirm that the protein products seen in the overexpression of the PK401 construct corresponded to the expected fluorescent proteins, fluorescence spectra of the cell lysates from overexpression were measured. The cells from the overexpression were lysed using 1 mg/mL lysozyme and 12.5 mg/g sodium deoxycholate. DNase was added to degrade the DNA followed by centrifugation at 3000 x g for 30 min. The supernatant was collected and centrifuged further at 30 000 x g for 45 min. This supernatant was then used for fluorescence measurements.</p> | <p>To confirm that the protein products seen in the overexpression of the PK401 construct corresponded to the expected fluorescent proteins, fluorescence spectra of the cell lysates from overexpression were measured. The cells from the overexpression were lysed using 1 mg/mL lysozyme and 12.5 mg/g sodium deoxycholate. DNase was added to degrade the DNA followed by centrifugation at 3000 x g for 30 min. The supernatant was collected and centrifuged further at 30 000 x g for 45 min. This supernatant was then used for fluorescence measurements.</p> | ||
| - | <p>The supernatants were diluted 100-fold in the buffer used for cell opening. Excitation and emission scans were measured for all samples in the CFP and YFP range in order to confirm the presence of both fluorescent proteins. CFP was excited at 430 nm, and emission was monitored from 445-650 nm | + | <p>The supernatants were diluted 100-fold in the buffer used for cell opening. Excitation and emission scans were measured for all samples in the CFP and YFP range in order to confirm the presence of both fluorescent proteins. CFP was excited at 430 nm, and emission was monitored from 445-650 nm. YFP was excited at 510 nm, and emission was monitored from 525-650 nm. These spectra were measured for the cell opening buffer, the induced and uninduced samples of the cells that contained the PK401 construct, the CFP and YFP cell lysates, as well as the cells containing the control plasmid.</p> |
| + | |||
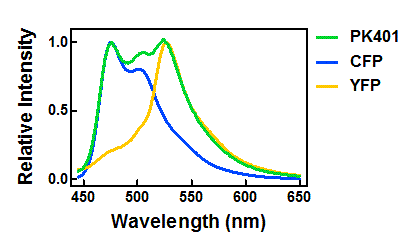
| + | <p>The relative fluorescence intensity of CFP and YFP after direct excitation were compared to the relative fluorescence of the PK401 cell lysate (Fig. 4). The cell lysate from the PK401 overexpression show the characteristic emission spectrum of CFP upon excitation at 430 nm. There is an additional peak in the spectrum at 527 nm, which is the emission maximum of YFP. Direct excitation of YFP from the PK401 overexpression sample also showed the characteristic emission spectrum of YFP, indicating that both CFP and YFP were expressed in this sample. The fluorescence from YFP could only result from a frameshift during expression of the PK401 transcript, indicating that the pseudoknot worked as expected to induce a -1 frameshift during translation. </p> | ||
<br> | <br> | ||
| - | <center>[[Image:ULeth2013_PK401- | + | <center>[[Image:ULeth2013_PK401-CFP-YFP_relative.png|600px]]</center> |
| - | <p><b>Figure | + | <p><b>Figure 4. Relative fluorescence intensity of CFP, YFP, and P401 overexpression samples.</b> Cell lysates from the cultures used for overexpression were excited near the excitation maximum of CFP (at 430 nm) and the emission was monitored from 445-650 nm (K1210000, green; CFP, blue; YFP, yellow).</p><br> |
| - | |||
| - | |||
| - | |||
| - | |||
| - | + | <p>Upon excitation of the cell lysates from the control plasmid cultures at 430 nm, a very low fluorescence signal was observed that did not resemble the emission spectrum of CFP, and was likely due to other cellular components. Additionally, when the sample was excited at 510 nm, there was no detectable emission signal, indicating that YFP was not present in these samples. </p> | |
| - | + | ||
| - | <p>Upon excitation of the cell lysates from the control plasmid cultures at 430 nm, a fluorescence signal | + | |
<br> | <br> | ||
Latest revision as of 22:48, 21 January 2014

 "
"
