Team:Tianjin/Project/Characterization
From 2013.igem.org
(→Construction:) |
Zengbouxan (Talk | contribs) (→b. Sensitive interval determination) |
||
| (12 intermediate revisions not shown) | |||
| Line 333: | Line 333: | ||
==Test process and Result:== | ==Test process and Result:== | ||
| - | Then we fermented these three strain in M9 media with proper concentration of antibiotics(34ug/ml Cm and 50ug/ml Km) for about 48 hours. We can find that the strains which can produce | + | Then we fermented these three strain in M9 media with proper concentration of antibiotics(34ug/ml Cm and 50ug/ml Km) for about 48 hours. We can find that the strains which can produce alkanes are red and the red is deeper than control, the strain with high alkane productivity has the deepest red. And then we measured the fluorescent intensity of the 3 strains, the result showed in Figure 2. Although the control one still has a severe leakage of the expression of RFP, it’s obvious the fluorescent intensity per OD<sub>600</sub> of strain with alkane producing module is higher than the control, and the strain with higher alkane productivity got a higher fluorescent intensity per OD<sub>600</sub>. |
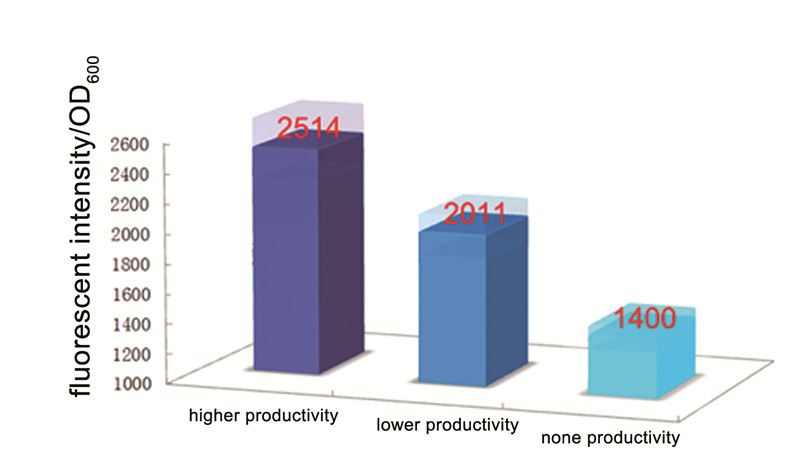
| - | [[Image:TJU-PROJECT-C2.jpg|thumb|600px|center|<b>Figure 2.</b> | + | [[Image:TJU-PROJECT-C2.jpg|thumb|600px|center|<b>Figure 2.</b> Fluorescent Indensity per OD<sub>600</sub> measured for 3 strains with different alkane productivity.]] |
==Conclusion:== | ==Conclusion:== | ||
| Line 346: | Line 346: | ||
<br> | <br> | ||
| - | + | We have proved that Alk-Sensor can detect the alkane produce by engineered strain, but it is still difficult to measure the concentration of alkane just according to the fluorescent intensity, so the Alk-Sensor needs more characterization. So we did two tests to characterize the Alk-Sensor through exogenous alkane induction, these results will help us get more information of the relationship between input (Alkane concentration) and output (RFP). | |
| - | ==a. Alkane | + | ==a. Alkane specificity of our Alk-Sensor== |
| - | The | + | The alkanes biosynthesized in <i>E. coli</i> is a mixture of alkanes with different carbon chain lengths, so it is important to know the specific alkane that the Alk-Sensor has the strongest response to, so that we can build an accurate relationship between the input and output. So we test the response of Alk-Sensor to different kinds of alkanes. We chose octane(C8), decane(C10), dodecane(C12), tetradecane(C14) and hexadecane(C16) as our targets and use full dose alkanes to induce the expression of RFP. The results are shown in Figure 3. The response to different alkanes is C8>C12>C14>C10>C16>control. Because of the low solubility of alkanes, especially longer chain alkanes, the response of Alk-Sensor may not be so sensitive. So the response to the hexadecane(C16) is near to the control. |
| - | [[Image:TJU-PROJECT-C3.jpg|thumb|600px|center|<b>Figure 3.</b> The visible color change of the strain cultured in | + | [[Image:TJU-PROJECT-C3.jpg|thumb|600px|center|<b>Figure 3.</b> The visible color change of the strain cultured in 3mL M9 medium with different alkanes induced for 12 hours.]] |
| + | ==b. Sensitive interval determination== | ||
| - | + | For a biosensor, it is important to know its sensitive interval. Different strength of input can be distinguished accurately only when they are in the sensitive internal. To determination the sensitive interval of Alk-Sensor, we first used different concentration of octane and pentadecane to induce the expression of RFP. In the first round of induction, the concentration of octane we set are 10nM, 100nM, 1uM, 10uM, 100uM and 1mM. The alkanes we used are dissolved in the ethanol, and to improve the absorption of the alkane into the cell, we added 1% DMSO to increase the permeability of the cell membrane. The result shows in Figure 4 and Figure 5. According to the data, we find the Alk-Sensor is more sensitive when the concentration of the alkane is below 100nM. | |
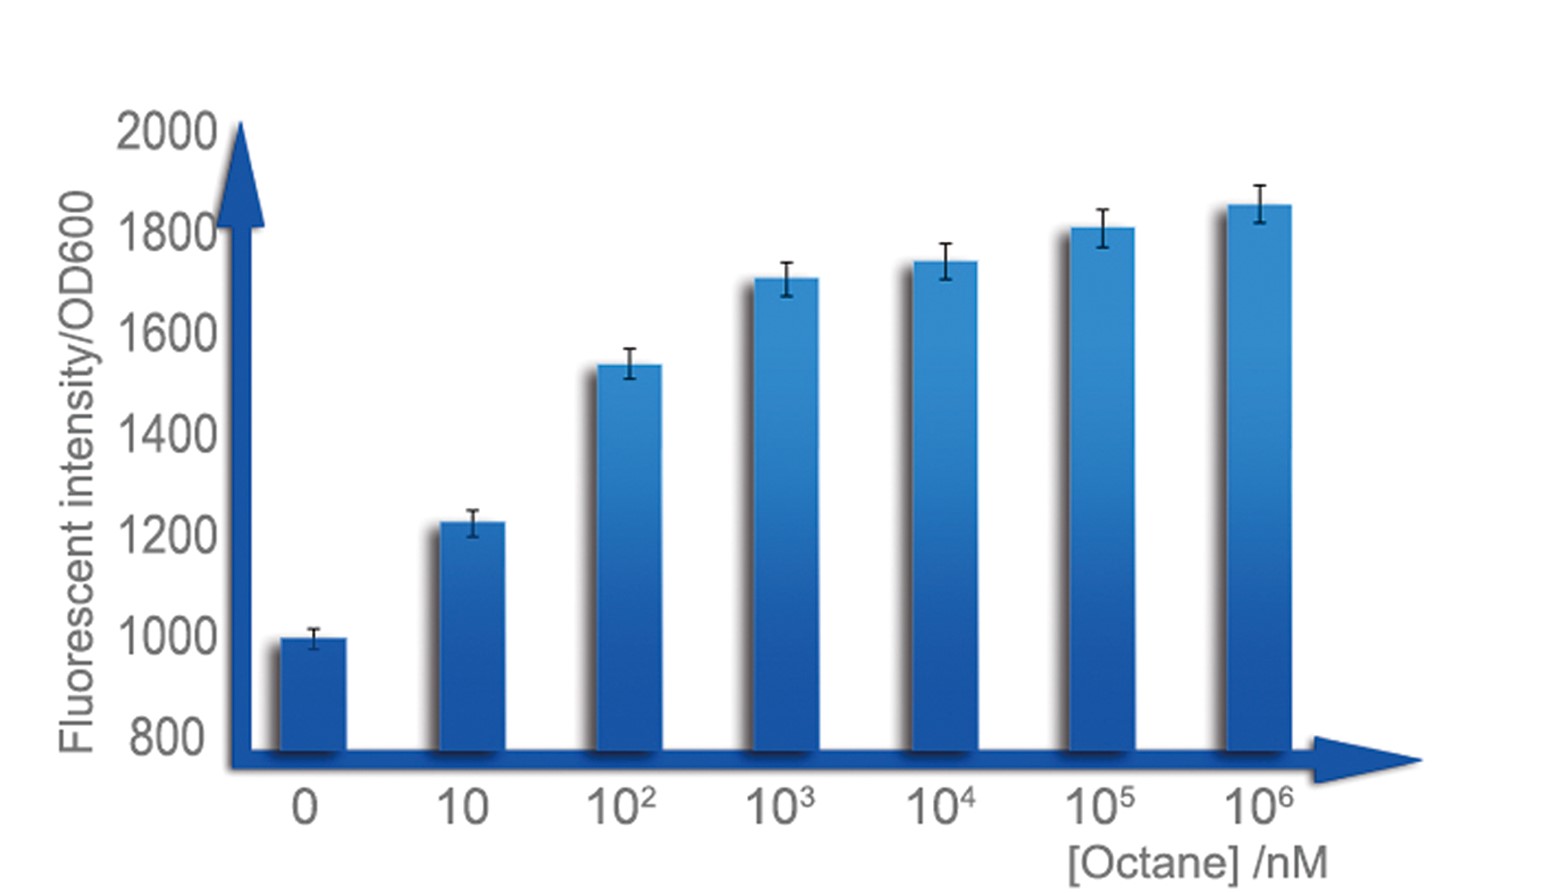
| - | + | [[Image:TJU-PROJECT-C5.jpg|thumb|550px|center|<b>Figure 4.</b> We cultured our strain in 3mL LB medium with 1%DMSO, which can facilitate solution of alkane in water, until OD reaches 0.6, add octane of a concentration range from 100nmol/L to 1mmol/L, over-night cultured. All of them are utilized to measure fluorescent intensity of cells.]] | |
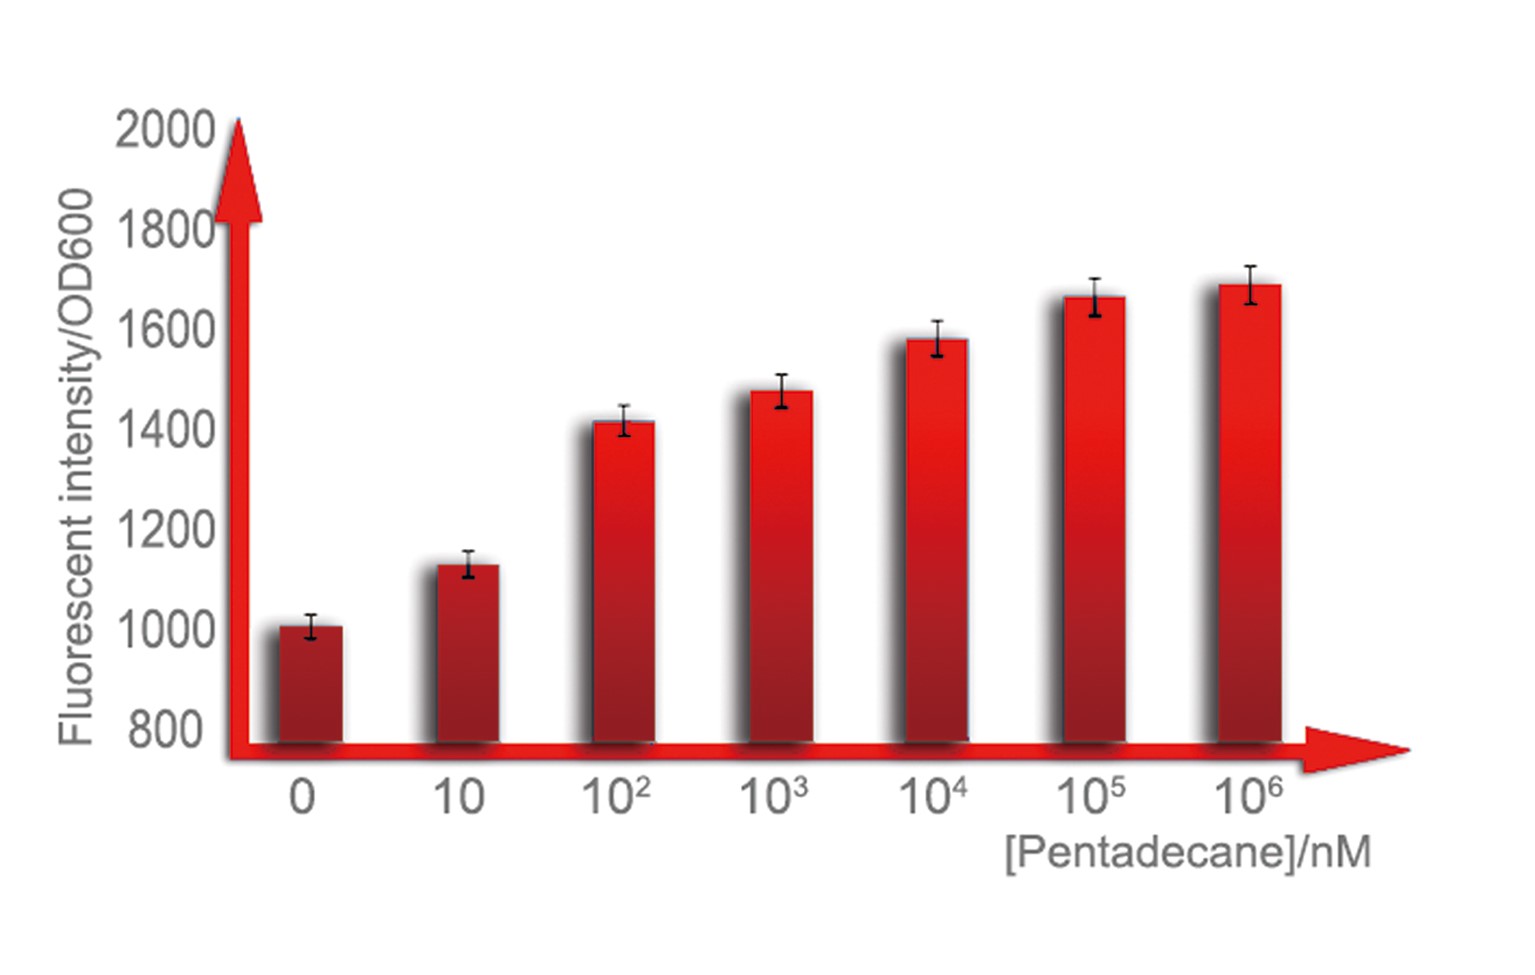
| - | [[Image:TJU-PROJECT- | + | [[Image:TJU-PROJECT-C6.jpg|thumb|550px|center|<b>Figure 5.</b> We cultured our strain in 3mL LB medium with 1%DMSO, which can facilitate solution of alkane in water, until OD reaches 0.6, add pentadecane of a concentration range from100nmol/L to 1mmol/L, over-night cultured. All of them are utilized to measure fluorescent intensity of cells.]] |
| - | + | Then we chose 20nM, 40nM, 60nM, 80nM and 100nM alkane to induce the Alk-Sensor again, to find the working curve in the sensitive interval. The result showed in Figure 6. This data may help us calculate the concentration of alkanes according to the fluorescent intensity. | |
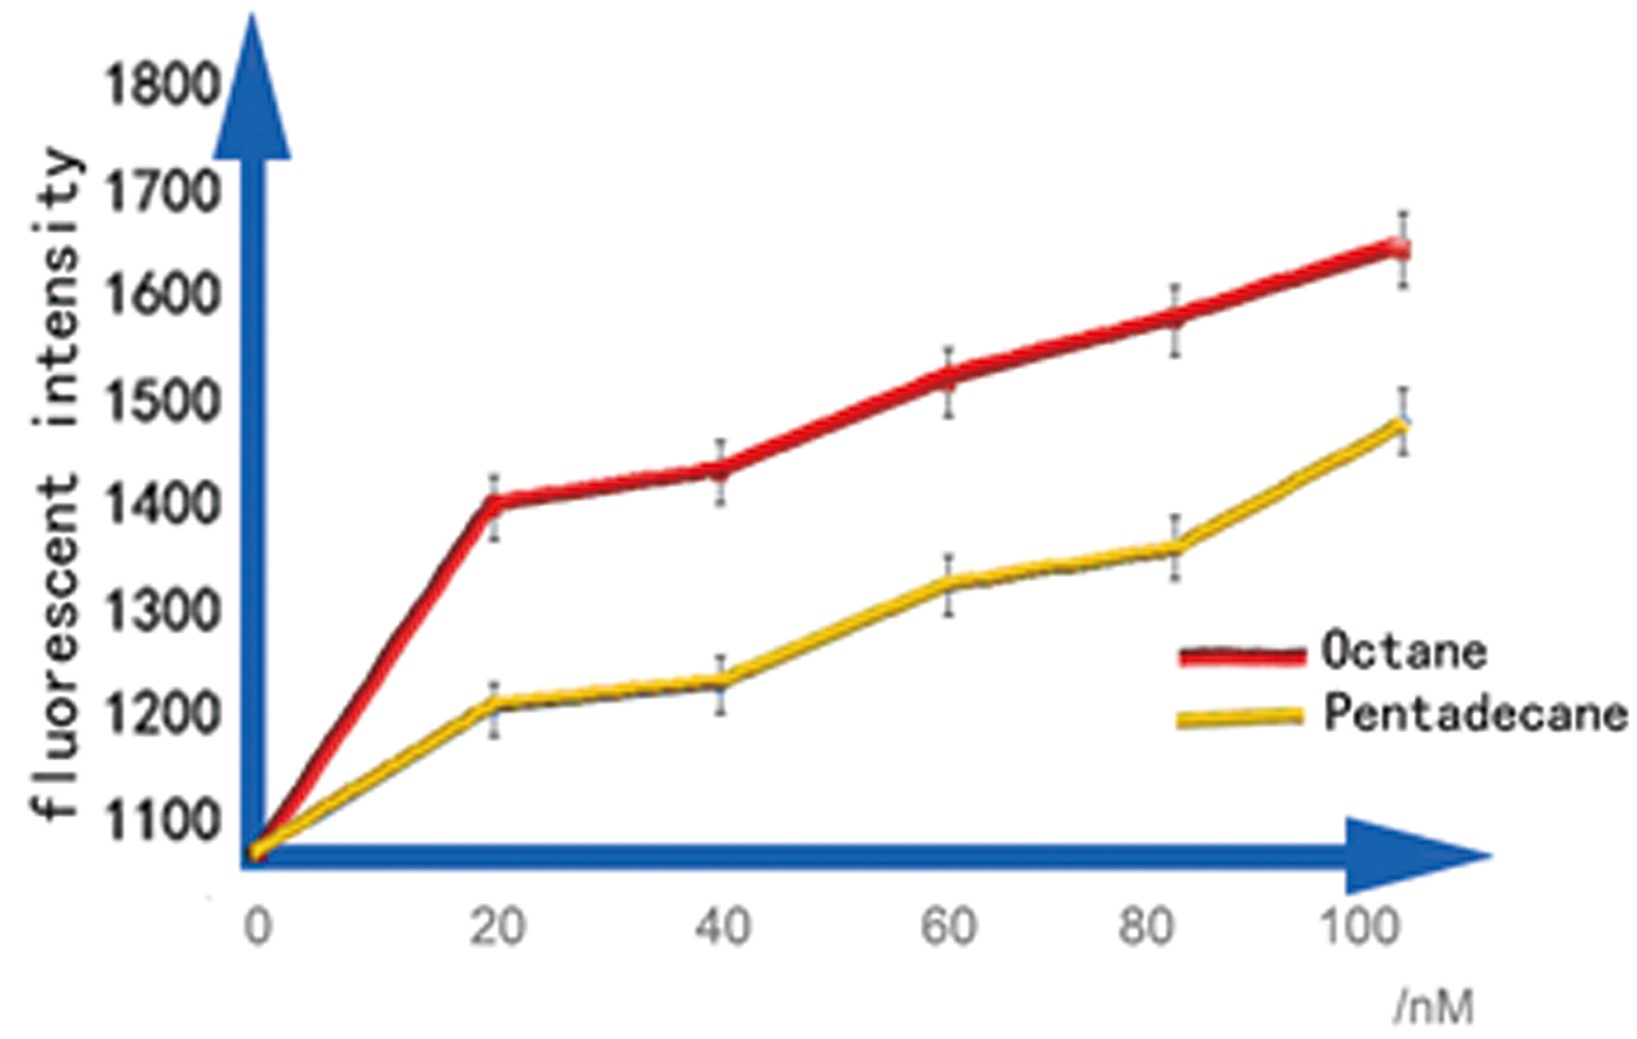
| - | + | [[Image:TJU-PROJECT-C7.jpg|thumb|550px|center|<b>Figure 6.</b> We cultured our strain in 3mL LB medium with 1% DMSO until OD reaches 0.6, add octane and pentadecane of a concentration range from 0nmol/L to 100nmol/L, over-night cultured. All of them are utilized to measure fluorescent intensity of cells.]] | |
| - | + | ||
| - | [[Image:TJU-PROJECT-C7.jpg|thumb|550px|center|<b>Figure 6.</b> We | + | |
Latest revision as of 01:32, 29 October 2013
After finishing our final construction of our Alk-Sensor, we wanted to know its more property and funtions. So we did several test around it. The Figure below showed the test we did, click the picture for more details for the test.
Contents |
Alkane Detection For Alkane Producer
Construction:
In this test, we try to use our Alk-Sensor to “mark” the alkane molecules which are produced by E. coli with different alkane productivity. In our project, we choose NPDC and AAR gene to construct the alkane producing module. We choose a strong promoter (BBa_J23100) and a weaker promoter (BBa_J23114) respectively to control the NPDC-AAR transcription unit, to obtain modules with different alkane productivity. At the same time, we build a control plasmid which didn’t contain any alkane producing part. Then we cotransform the alkane producing module and our Alk-Sensor to E. coli BL21 to build the strains with different alkane productivity. (All construct process showed in Figure 1)

Test process and Result:
Then we fermented these three strain in M9 media with proper concentration of antibiotics(34ug/ml Cm and 50ug/ml Km) for about 48 hours. We can find that the strains which can produce alkanes are red and the red is deeper than control, the strain with high alkane productivity has the deepest red. And then we measured the fluorescent intensity of the 3 strains, the result showed in Figure 2. Although the control one still has a severe leakage of the expression of RFP, it’s obvious the fluorescent intensity per OD600 of strain with alkane producing module is higher than the control, and the strain with higher alkane productivity got a higher fluorescent intensity per OD600.
Conclusion:
This test proved that our Alk-Sensor can be the “marker” which could transform the signal of Alkane which is small inconspicuous molecular to the signal (RFP) which can be detected by ourselves more easily. And the relationship between the input and output was positive.
Exogenous Alkane Induction
We have proved that Alk-Sensor can detect the alkane produce by engineered strain, but it is still difficult to measure the concentration of alkane just according to the fluorescent intensity, so the Alk-Sensor needs more characterization. So we did two tests to characterize the Alk-Sensor through exogenous alkane induction, these results will help us get more information of the relationship between input (Alkane concentration) and output (RFP).
a. Alkane specificity of our Alk-Sensor
The alkanes biosynthesized in E. coli is a mixture of alkanes with different carbon chain lengths, so it is important to know the specific alkane that the Alk-Sensor has the strongest response to, so that we can build an accurate relationship between the input and output. So we test the response of Alk-Sensor to different kinds of alkanes. We chose octane(C8), decane(C10), dodecane(C12), tetradecane(C14) and hexadecane(C16) as our targets and use full dose alkanes to induce the expression of RFP. The results are shown in Figure 3. The response to different alkanes is C8>C12>C14>C10>C16>control. Because of the low solubility of alkanes, especially longer chain alkanes, the response of Alk-Sensor may not be so sensitive. So the response to the hexadecane(C16) is near to the control.
b. Sensitive interval determination
For a biosensor, it is important to know its sensitive interval. Different strength of input can be distinguished accurately only when they are in the sensitive internal. To determination the sensitive interval of Alk-Sensor, we first used different concentration of octane and pentadecane to induce the expression of RFP. In the first round of induction, the concentration of octane we set are 10nM, 100nM, 1uM, 10uM, 100uM and 1mM. The alkanes we used are dissolved in the ethanol, and to improve the absorption of the alkane into the cell, we added 1% DMSO to increase the permeability of the cell membrane. The result shows in Figure 4 and Figure 5. According to the data, we find the Alk-Sensor is more sensitive when the concentration of the alkane is below 100nM.
Then we chose 20nM, 40nM, 60nM, 80nM and 100nM alkane to induce the Alk-Sensor again, to find the working curve in the sensitive interval. The result showed in Figure 6. This data may help us calculate the concentration of alkanes according to the fluorescent intensity.
 "
"


