Team:DTU-Denmark/HelloWorld
From 2013.igem.org
(→Model of "Hello World" construct) |
(→Model of "Hello World" construct) |
||
| Line 127: | Line 127: | ||
<script src="http://dworzynski.eu/visualization_logic.js"></script> | <script src="http://dworzynski.eu/visualization_logic.js"></script> | ||
<script src="http://dworzynski.eu/visualization_main.js"></script> | <script src="http://dworzynski.eu/visualization_main.js"></script> | ||
| + | |||
| + | |||
</html> | </html> | ||
Revision as of 08:29, 4 October 2013
Hello World Pilot Project
Contents |
Introduction
‘Hello World!’ are the first words a programmer prints when learning a new programming language. In analogy to this our team decided to do a ‘Hello World’ project in order to familiarize ourselves with lab techniques that we used later on to construct plasmids. Specifically we were performing PCR with uracil-containing primers, purifying PCR products and ligating them by means of USER cloning (Nour-Eldin, H. H.).
Since we are working with many periplasmic proteins, we wanted to try to target proteins to the periplasm. To do this, we used periplasmic signal peptides from the TAT and Sec pathways, and with a translational fusion of the signal peptide to GFP, we expressed GFP in the periplasm. Simultaneously, we expressed RFP in the cytoplasm as a background color, inspired by Skoog, Karl, et al.
Methods
Construction
The overal goal was to test the twin arginine pathway (TAT) and whether this signal peptide could transport GFP SF into the periplasm. The reason why we choose to use GFP superfolder (SF) was that this variant has been shown to fold faster than the E. coli transport system is at translocation, (Fisher, Adam C., and Matthew P. DeLisa.). This assures that the GFP will form its fluorophore before translocation to the more reductive periplasmic space. Thus it will not be inactivated by the inhibition of fluorophore formation as seen in other oxidative compartments like ER (Aronson, Deborah E., Lindsey M. Costantini, and Erik L. Snapp.).
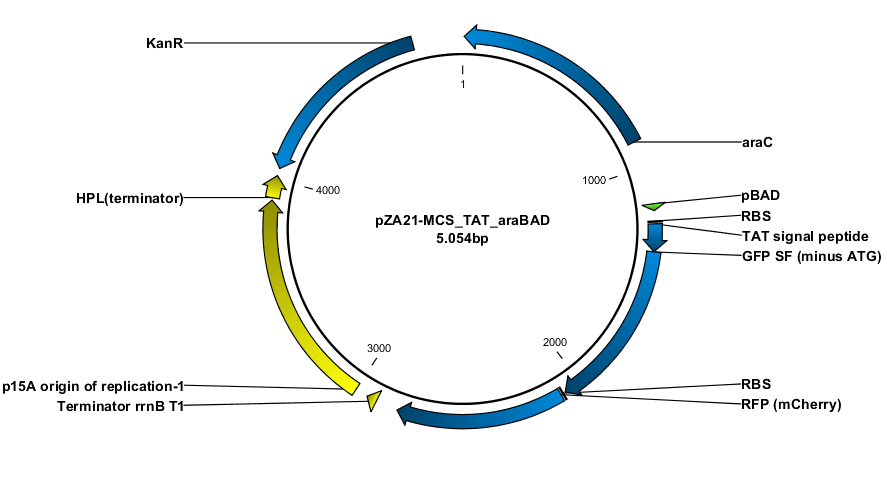
Construction of the plasmids was done with USER-cloning and assembly of 3 fragments. The starting point was a plasmid construct with RFP and GFP SF respectively. The RFP and GFP SF were amplified out with their associated RBS (the same in both cases).
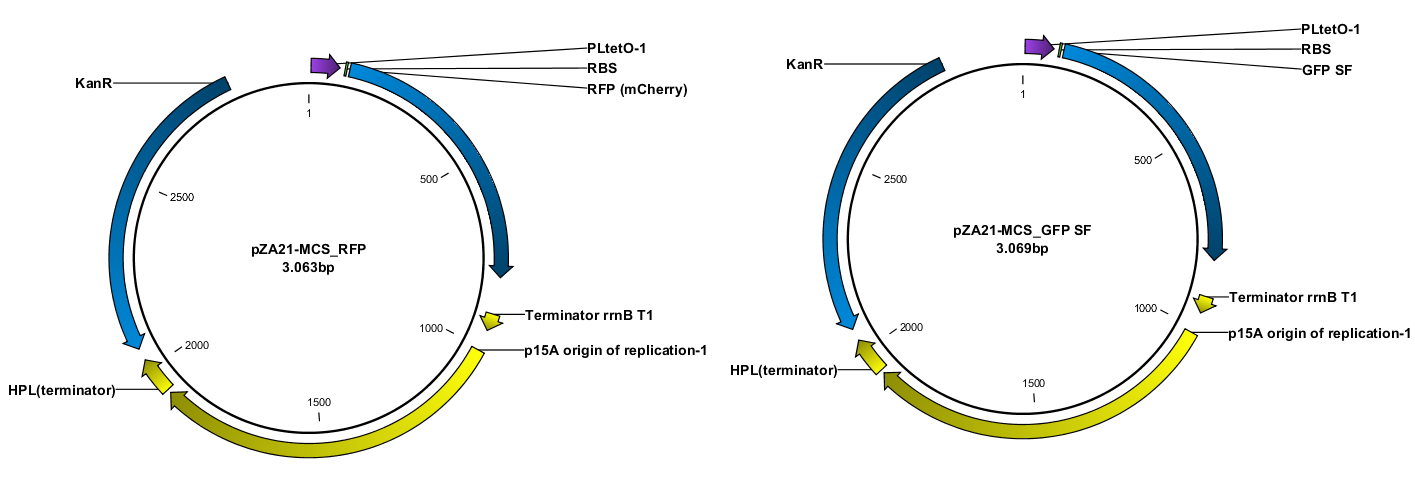
The TAT signal peptide was bought as a gBlock from IDT. All fragments were assembled into an expression vector specially designed to have a tight on/off mechanism ([http://parts.igem.org/Part:BBa_K1067007 BBa_K1067007]). Primers were design by the program [http://www.cbs.dtu.dk/services/PHUSER-2.0/web/ PHUSER] (Olsen, Lars Rønn, et al.) so that we got a seamless assembly.
Visualization
To visualize that GFP SF actually is exported we constructed a procedure for growing the cells and tracing the GFP SF to the periplasm (Skoog, Karl, et al.). It turns out that if you just grow cells in LB and induce the GFP SF/RFP expression there will be too much GFP SF in the cytoplasm to get a good resolution between cytoplasm and periplasm. That is why it’s important to devise a procedure for stopping the production for GFP SP and thereafter tracing it from the cytoplasm into the periplasm. This underlines the importance of having a non-leaky inducible expression system; when expression is stopped by removing the inducer it would spoil the procedure if the system kept leaking out GFP SF into the cytoplasm.
After optimizing the procedure we made a final version which can be found in the methods page. This also includes how to use background subtraction to get a better resolution.
Modeling
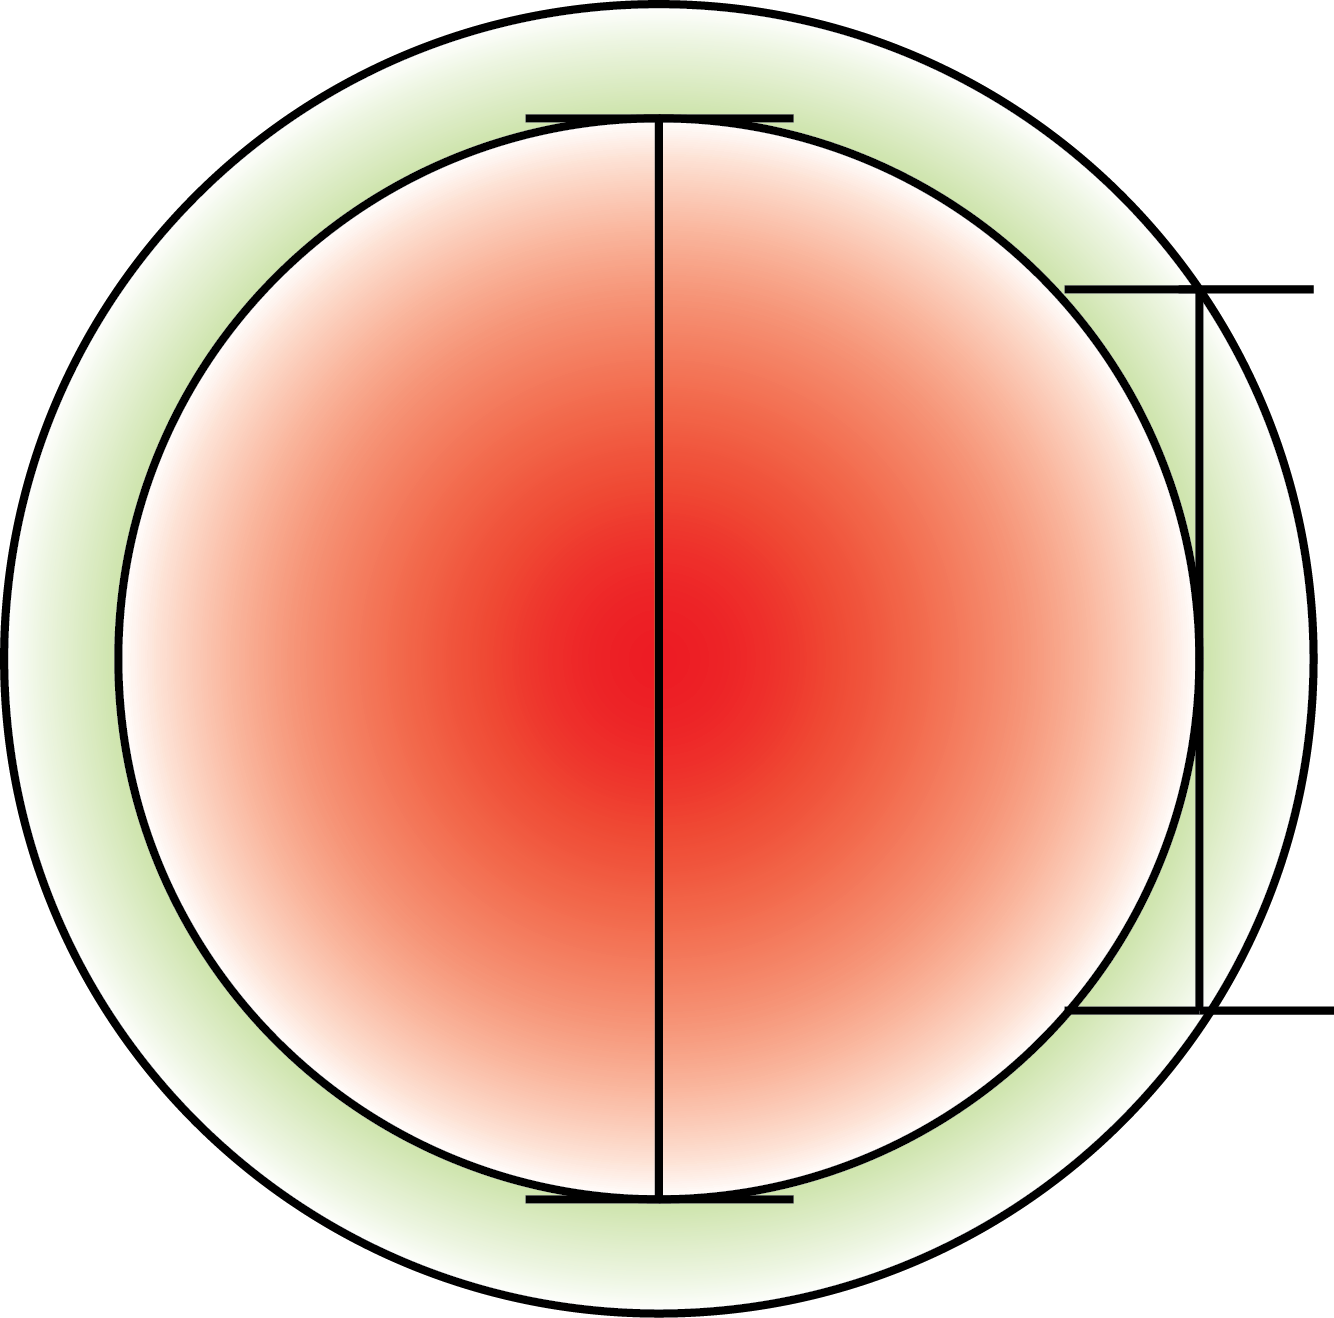
To assess the ability to distinguish the periplasmic from the cytoplasmic space we made a model which is based on a perfect spherical cell with and even layer between inner and outer membrane.
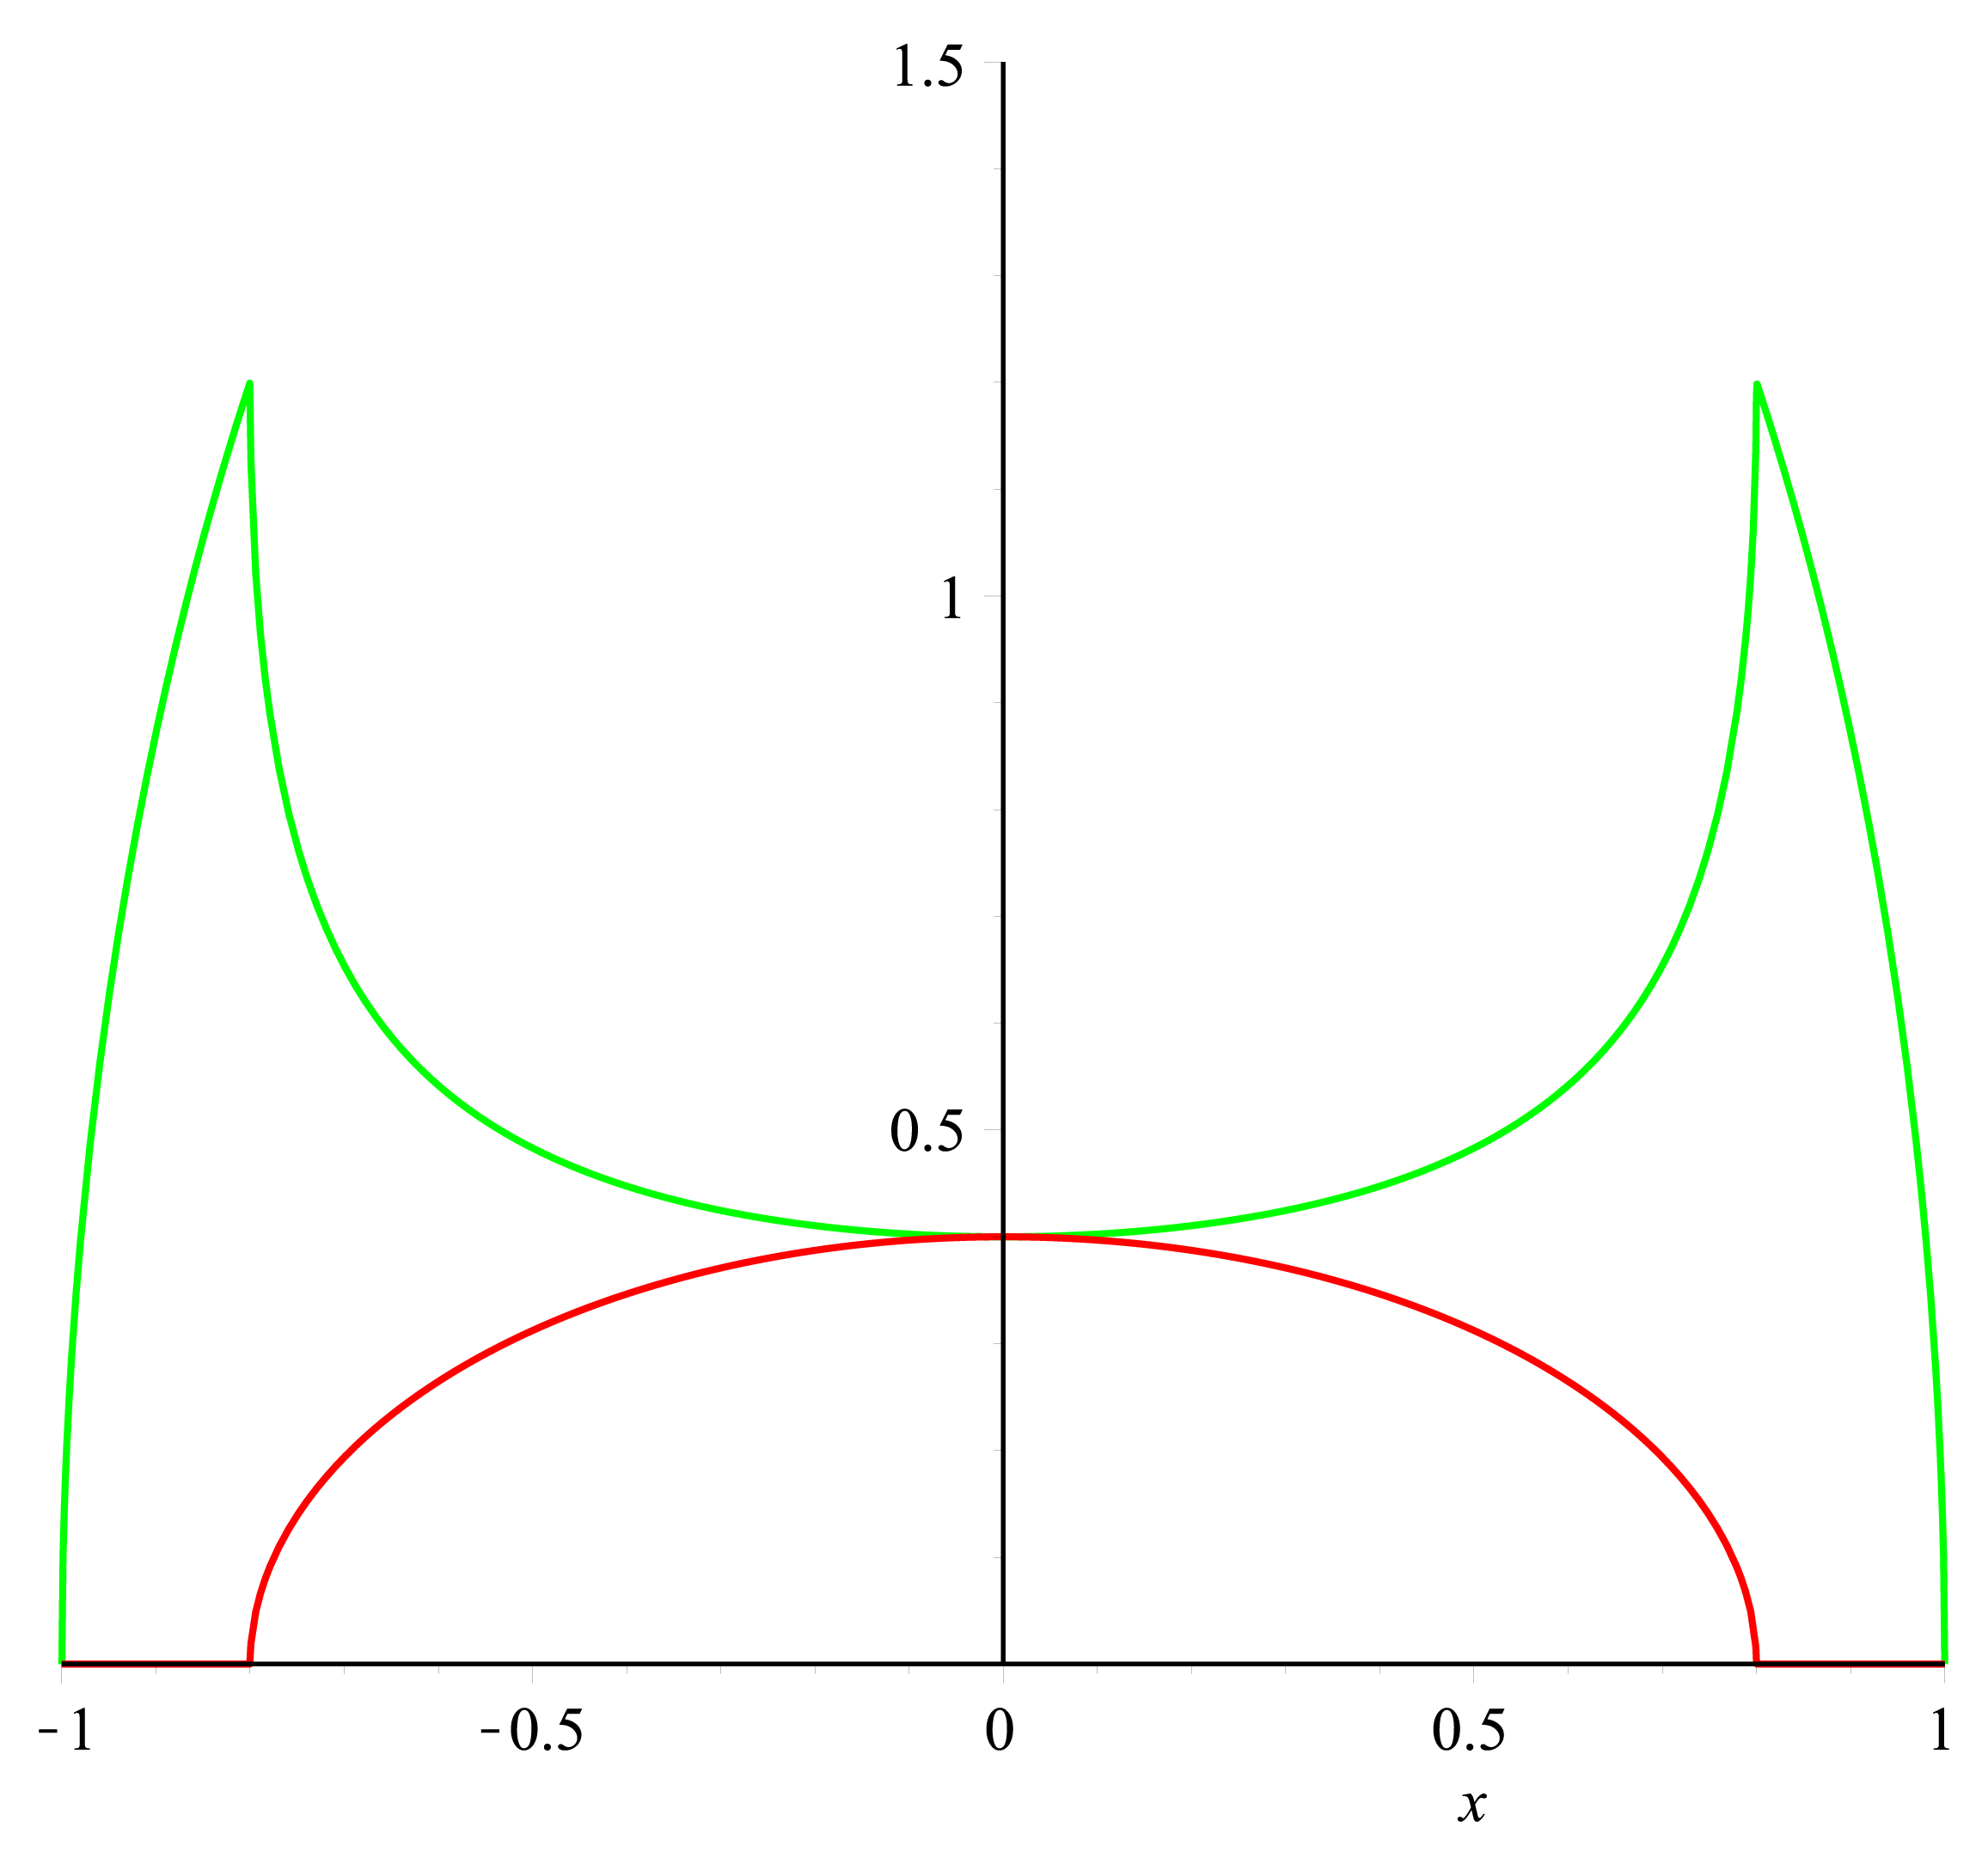
To get a value of the RFP and GFP signal we used a cross section of the spherical cell and measured the length of RFP and GFP going across this section; see the measurement bars at the figure. The make a graph of this we set the middle of the cell to be 0 on the x-axis. On the y-axis we let two lines show the value of GFP and RFP in the cross section.
The first graph can be seen below:
Results
We used different methods for testing that our construct actually did work and also for verifying the model we did before the test.
Periplasmic vs. cytoplasmic fraction
The first test we did was to purify the periplasmic fraction of the cells and then comparing with the cytoplasmic (link to notebook). We did this with the cold osmotic shock method and viewed the fraction under UV-light.
Fluorescent microscope images
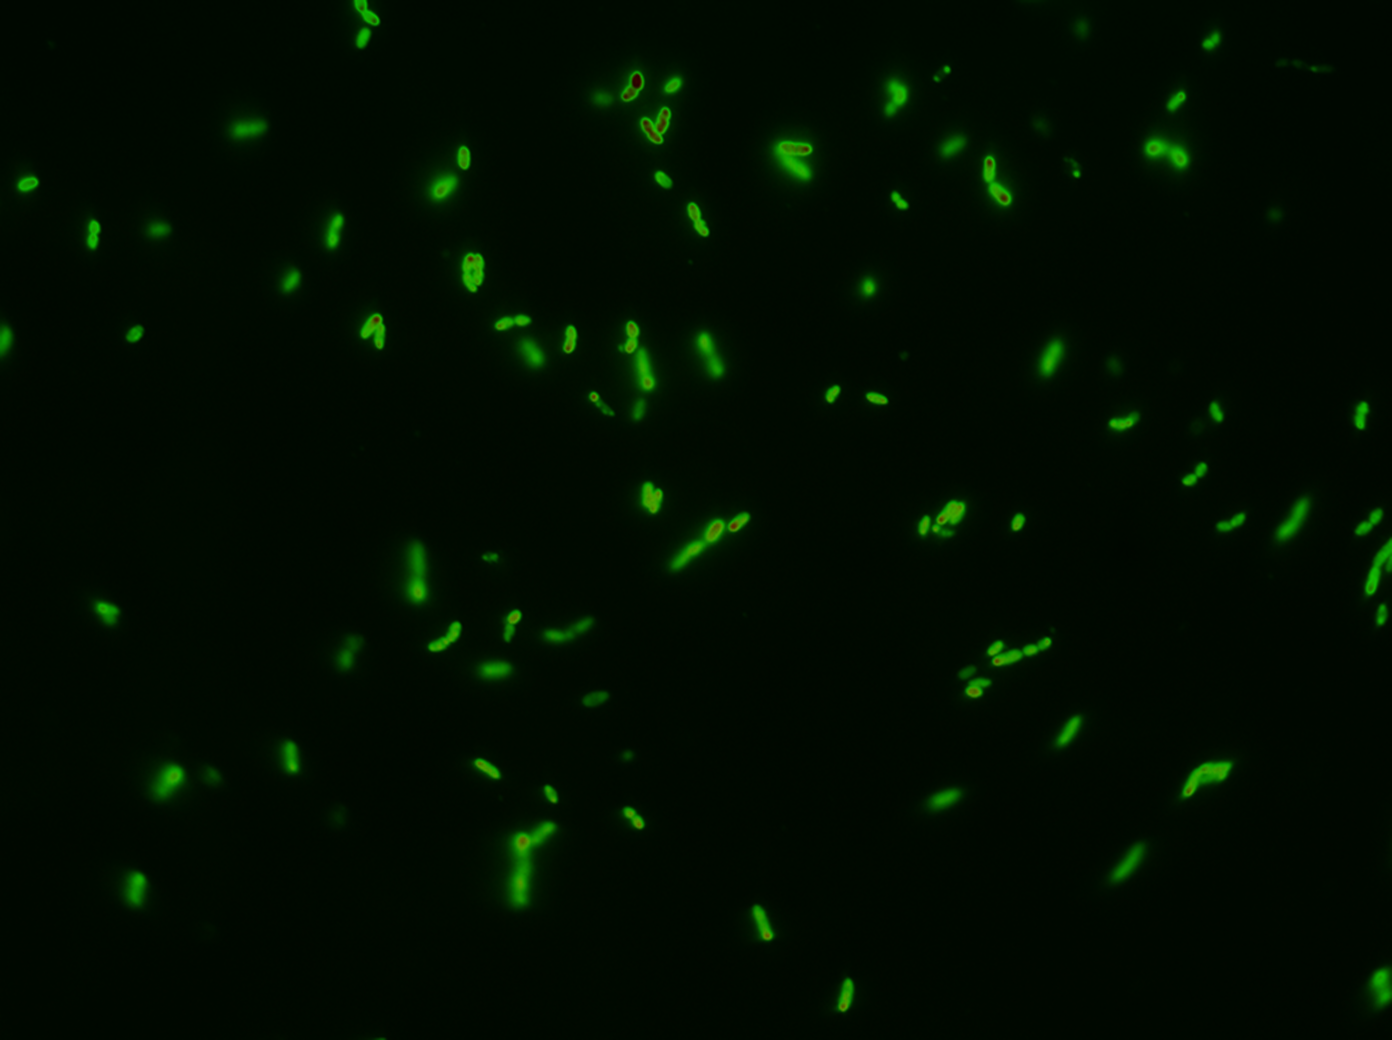
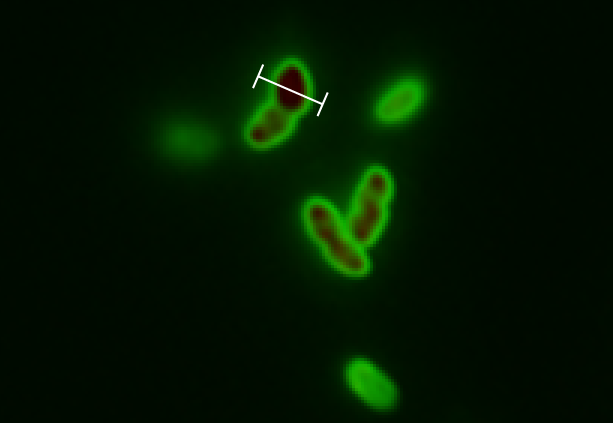
Next test was the "real thing". We wanted water-tight evidence that GFP SF was actually exported; and what better way to do this than getting pictures of it? After following our procedure for chasing GFP SF to the periplasm, we observed these images after background subtraction. Following is an image with no zoom:
Next to test our model we picked a cell this good resolution and zoomed in on this:
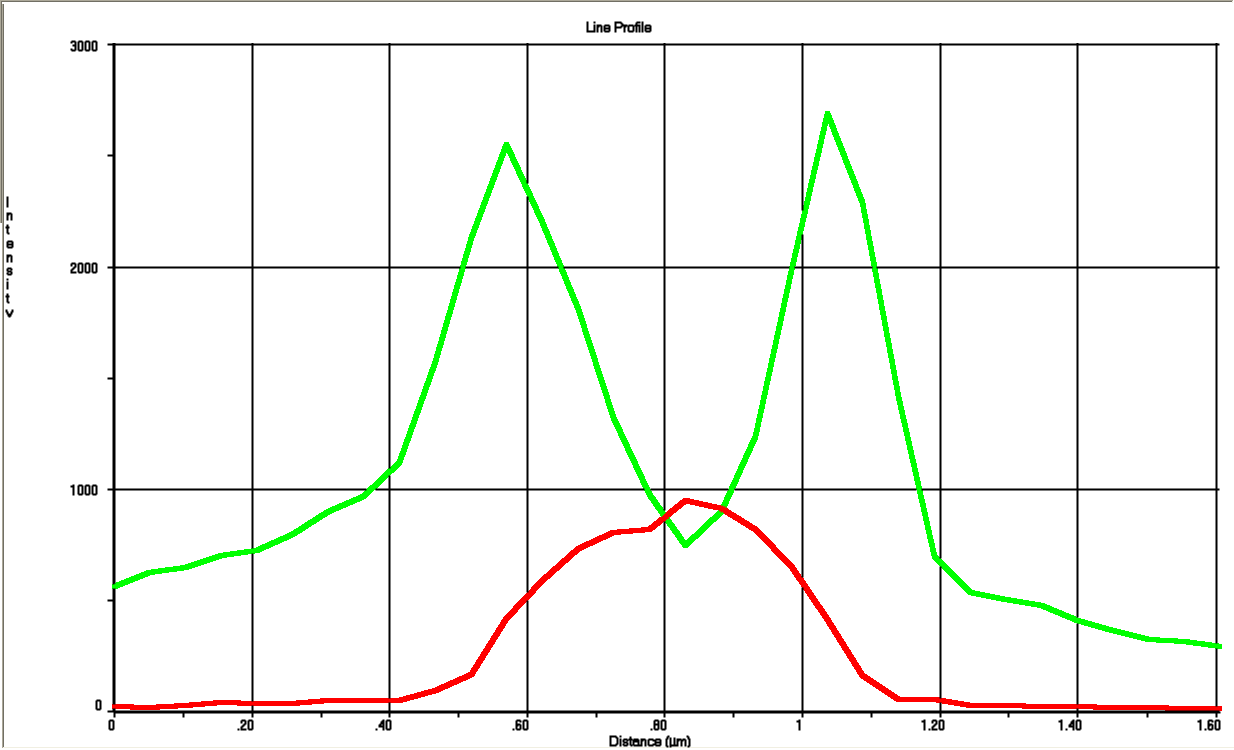
For this cell a linear profile was made that shows both the GFP and RFP signal across the cell:
These profiles closely resemble our model seen in next section.
Model of "Hello World" construct
With the mathematical equations made for making the graph above we made a interactive model that enables the user to set their own settings with regard to GFP and RFP intensity and cytoplasmic vs. periplasmic fraction. If the parameters are set well the model reassembles the images we acquired with the fluorescence microscope.
Warning
Oh no! Your browser is too old to display this contentPlease install the newest version of any of these: Chrome, Safari, Internet Explorer (Windows 7 or later only), Firefox, Opera And please come back! It's worth it! |
| Cell membrane size: | ||
| Red intesity: | ||
| Green intensity: |
Conclusions
Biobrick BBa_K1067009 successfully directs GFP SF to the periplasm of E. coli. This experiment is a proof of concept that proteins can be exported to the periplasm. There have in previous iGEM project been a confusing whether or not it was possible to export GFP to the periplasm; this experiment verifies just that and gives a procedure on how to reproduce this.
References
- Skoog, Karl, et al. "Sequential Closure of the Cytoplasm and Then the Periplasm during Cell Division in Escherichia coli." Journal of bacteriology 194.3 (2012): 584-586.
- Nour-Eldin, H. H., Geu-Flores, F., & Halkier, B. A. (2010). USER cloning and USER fusion: the ideal cloning techniques for small and big laboratories. In Plant Secondary Metabolism Engineering (pp. 185-200). Humana Press.
- Olsen, Lars Rønn, et al. "PHUSER (Primer Help for USER): a novel tool for USER fusion primer design." Nucleic acids research 39.suppl 2 (2011): W61-W67.
- Fisher, Adam C., and Matthew P. DeLisa. "Laboratory evolution of fast-folding green fluorescent protein using secretory pathway quality control." PLoS One 3.6 (2008): e2351.
- Aronson, Deborah E., Lindsey M. Costantini, and Erik L. Snapp. "Superfolder GFP is fluorescent in oxidizing environments when targeted via the Sec translocon." Traffic 12.5 (2011): 543-548.
 "
"
