Header
Sensing
Overview
The idea of this module was to transform bacteria with a plasmid that contains a promoter which senses a specific signal. Once this promoter senses the signal, it would initiate transcription of an enzyme which degrades the nanoparticle, thus releasing its contents. We decided to use pH as the specific trigger that activates the promoter. As a proof of principle, we inserted three different promoters into three plasmids in front of the BioBrick BBa_I746916 ([http://parts.igem.org/Part:BBa_I746908 BBa_I746916, Main Page]) which encodes superfolded GFP. Then, we transformed cells with these plasmids and let them grow in media with different pHs in order to check the expression.
Experiments
We chose the following three pH sensitive promoters:
1.) Hya-promoter, isolated from the Escherichia Coli K-12 MG1655 strain [http://parts.igem.org/Part:BBa_K1111002 BBa_K1111002]
2.) Cad-promoter, isolated from the Escherichia Coli K-12 MG1655 strain [http://parts.igem.org/Part:BBa_K1111004 BBa_K1111004]
3.) BioBrick BBa_J23119, a constitutive promoter that was made by the 2006 Berkley team. [http://parts.igem.org/Part:BBa_K1111005 BBa_K1111005]
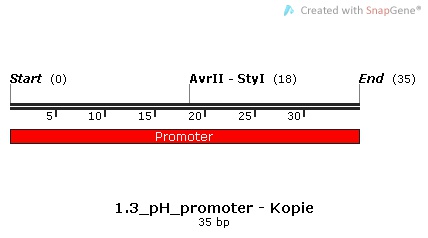
Promoter Sequences
Restriction Digest
We digested the plasmid containing the biobrick BBa_I746908 ([http://parts.igem.org/Part:BBa_I746908 BBa_I746908]) which would serve as backbone for our constructs.
PCRs and Gibson Assemblies
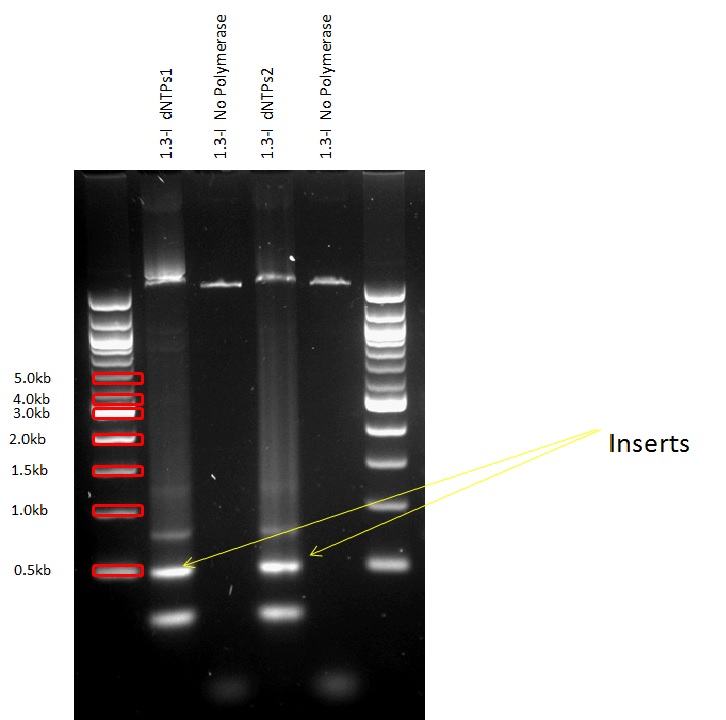
All the promoters were isolated by PCR and then assembled into the pSB1C3 Plasmid in front of the superfolded GFP.
Then, each of the constructs was used to transform DH5-alpha competent cells, which were first plated on chloramphenicol containing LB agar plates for selection of positive transformants, and then incubated into media with different pHs.
We used four media:
1.) LB-Chloramphenicol with a final pH of 5 (Adjusted with 10X MOPS+HCl)
2.) LB-Chloramphenicol with a final pH of 6 (Adjusted with 10X MOPS)
3.) LB-Chloramphenicol with a final pH of 7 (Adjusted with water)
4.) LB-Chloramphenicol with a final pH of 8.5 (with 10X HEPES)
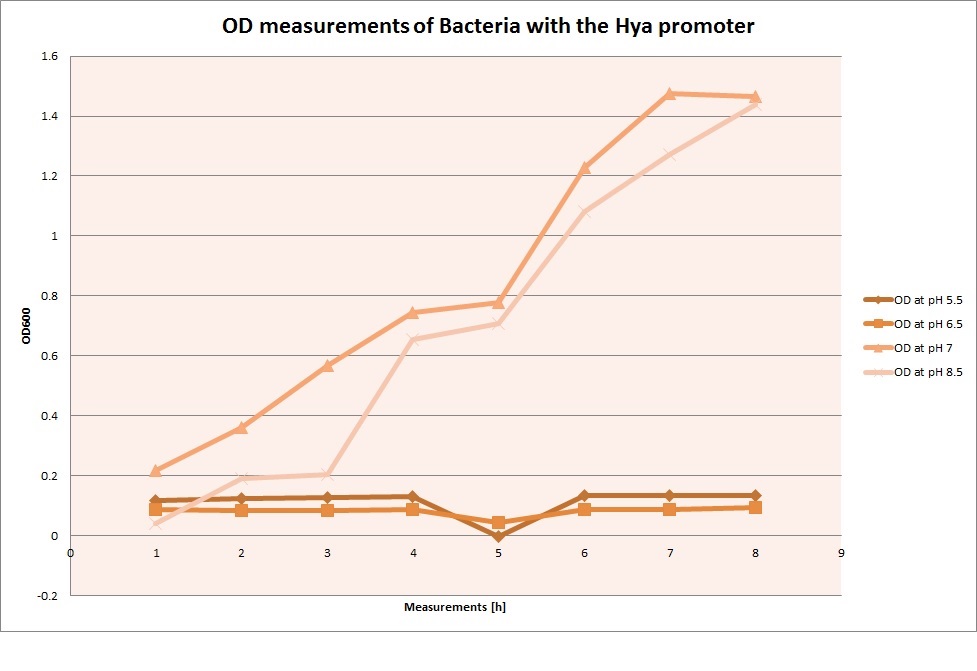
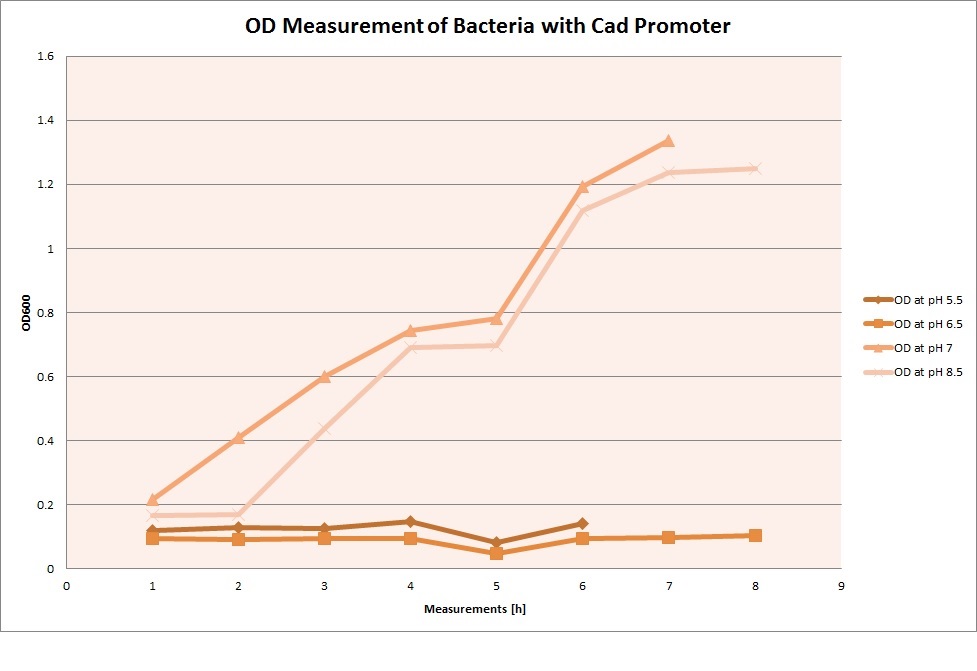
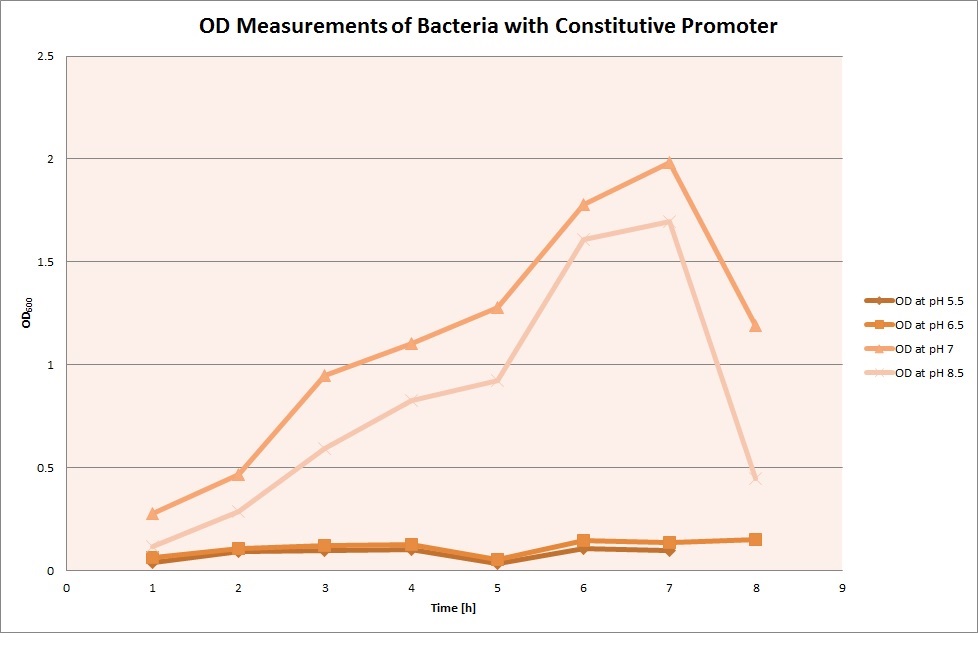
For each medium, we measured the OD of the cells. This helped us establish whether a low expression of GFP was really due to the fact that the promoters did not work, or simply resulting from the cells dying before they could initiate transcription and translation of the protein. It would also tell us whether an increase of fluorescence was only due to an accumulation of bacteria or to the actual accumulation of GFP.
OD measurements
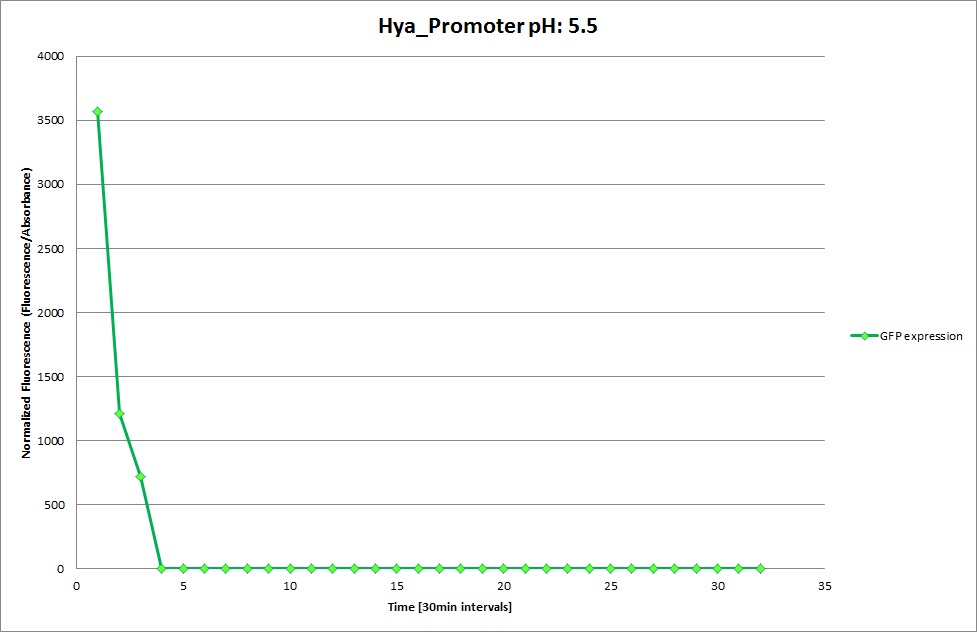
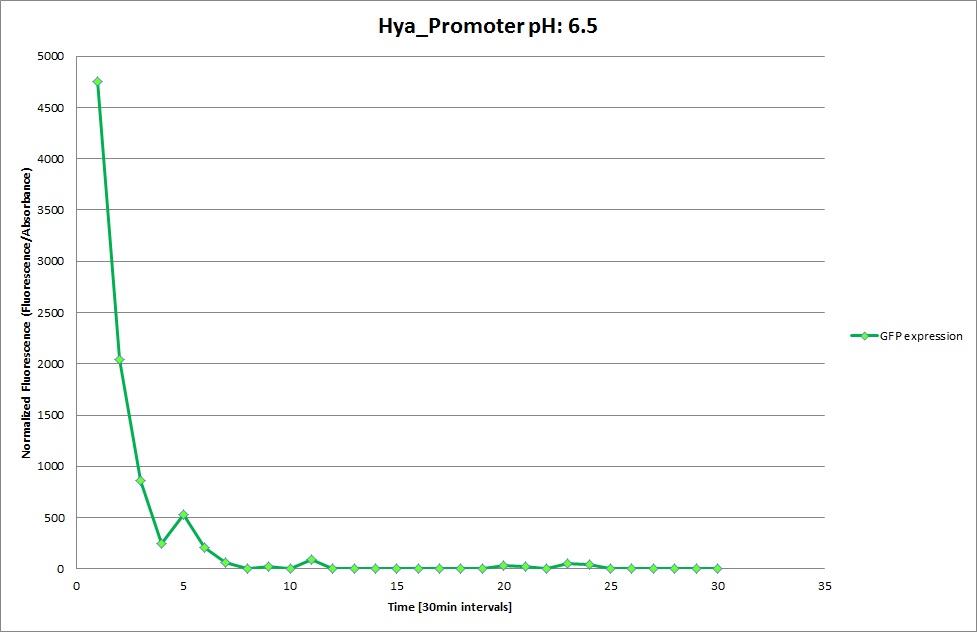
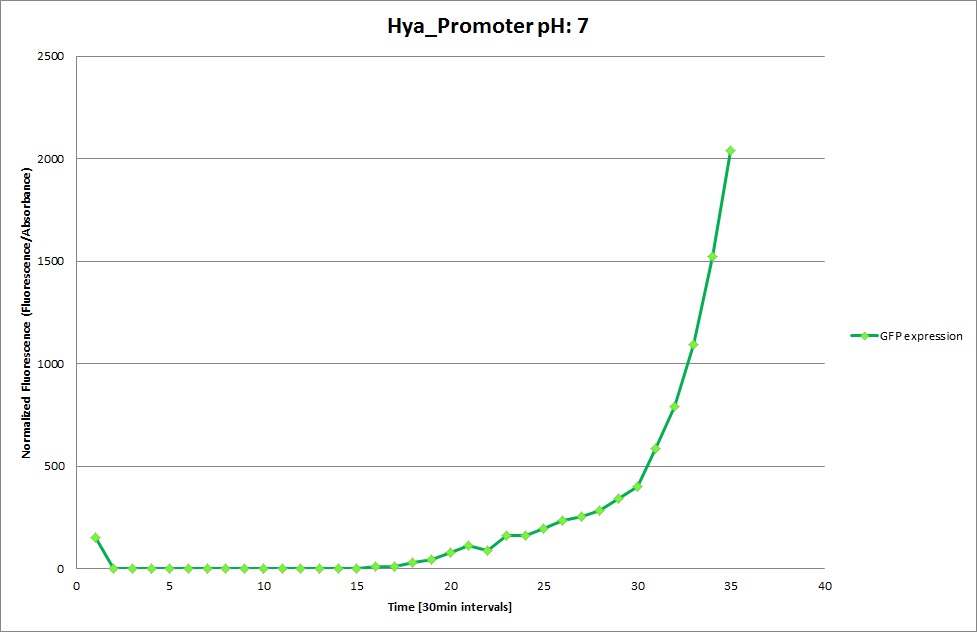
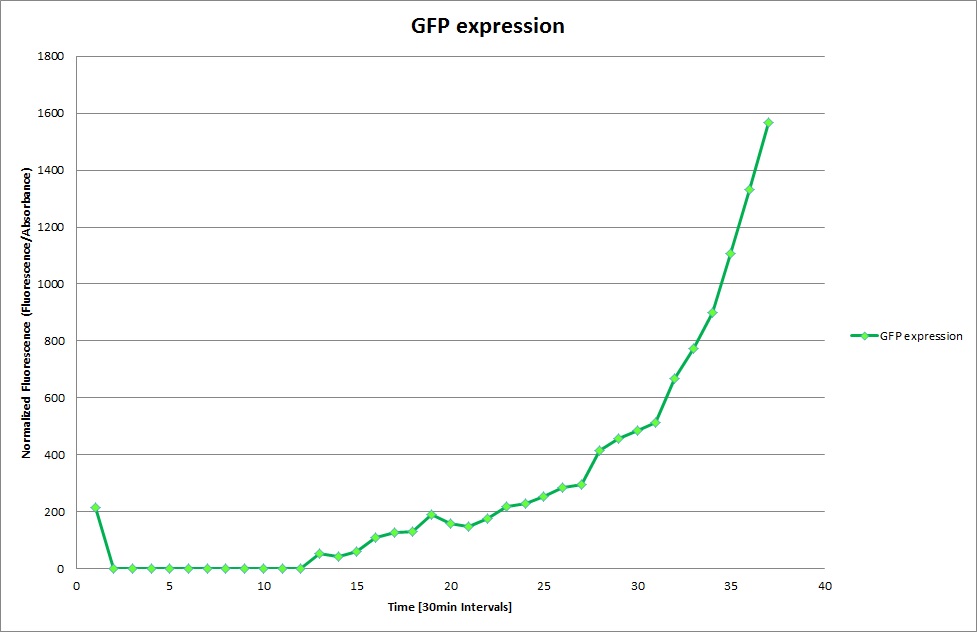
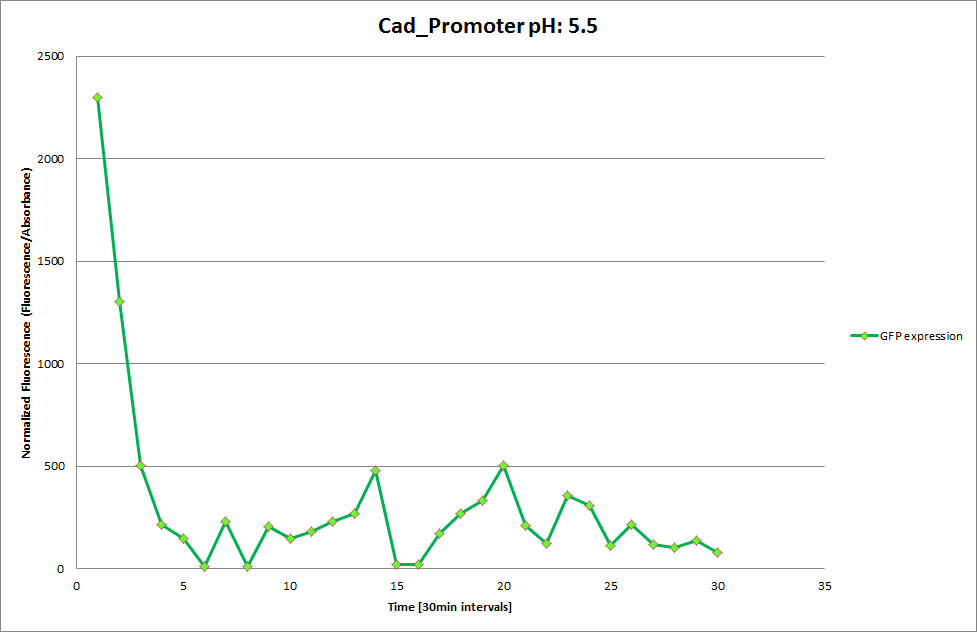
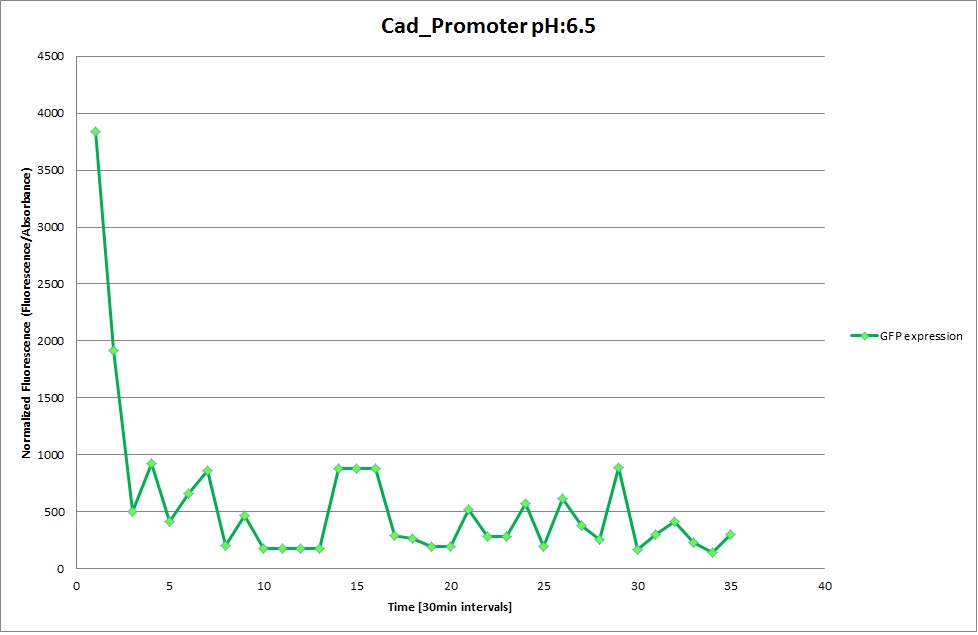
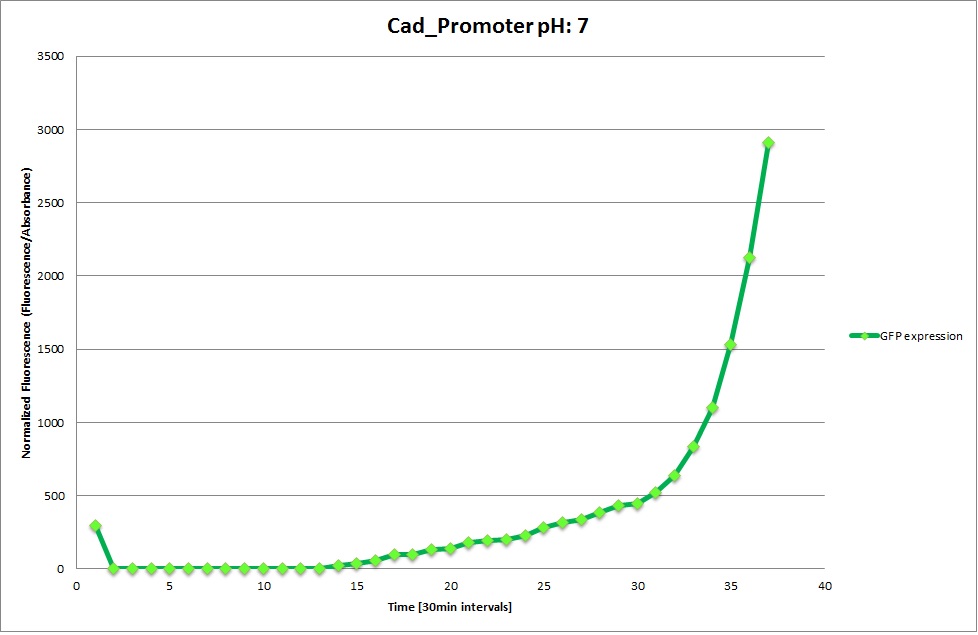
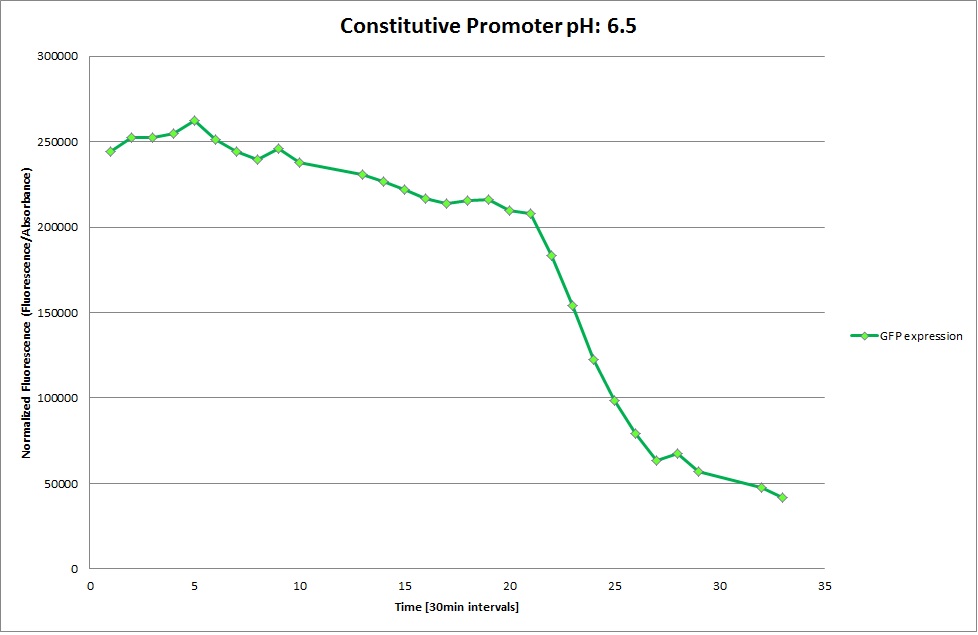
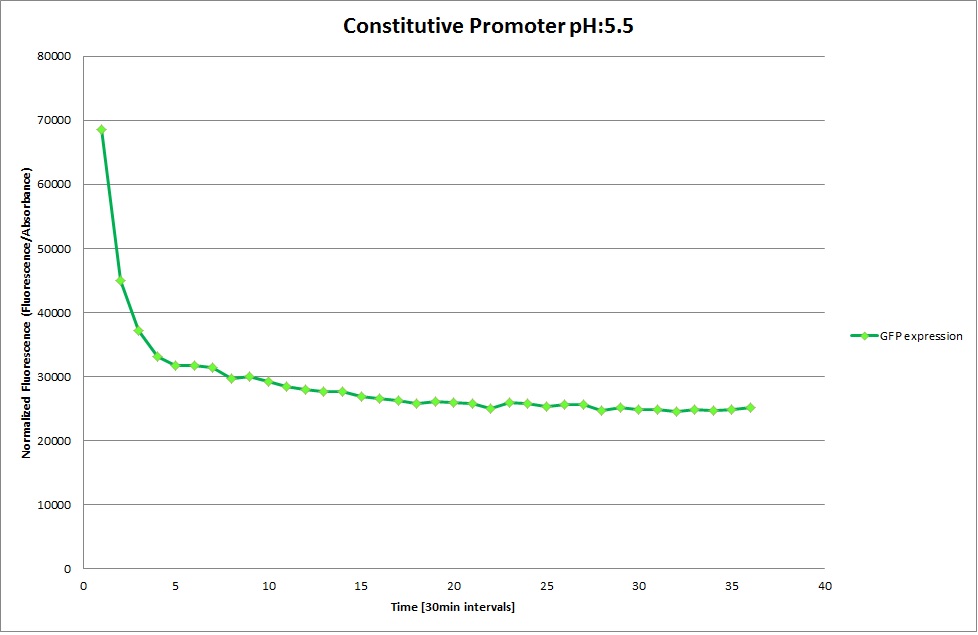
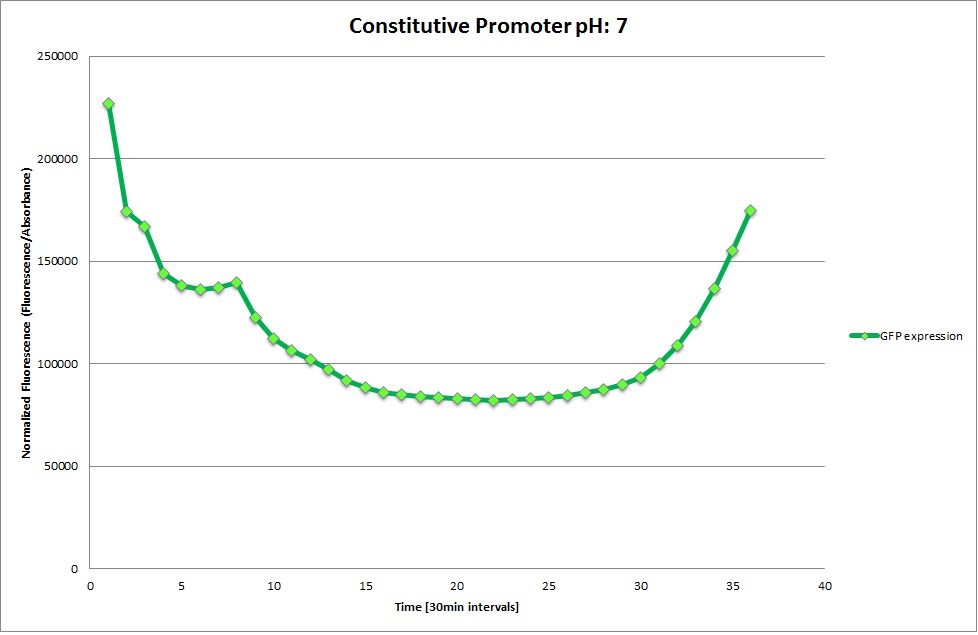
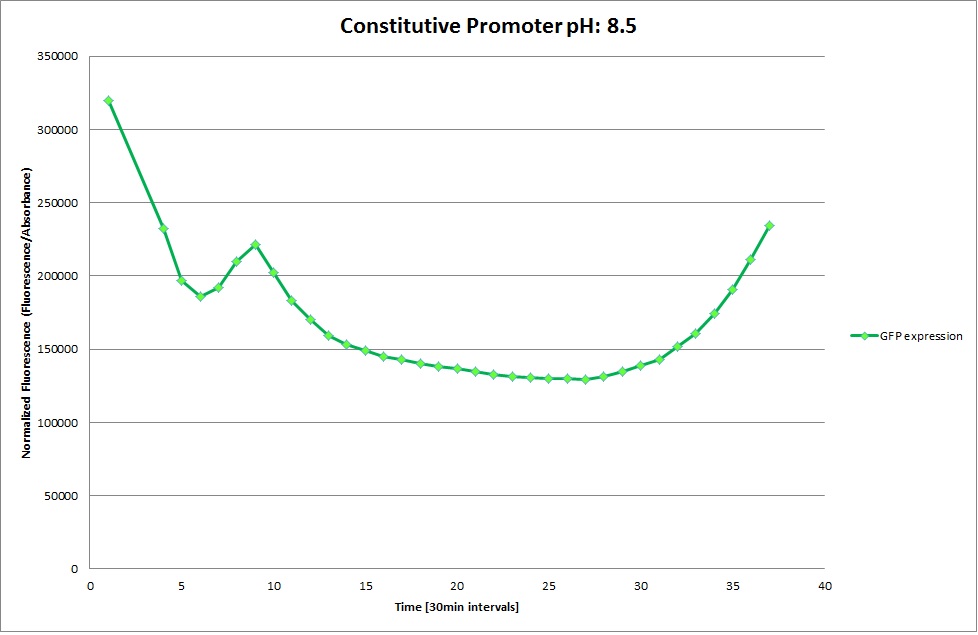
GFP expression was measured using a plate reader. We made three replicates for each promoter with each pH. Both the fluorescence and the 1:600 absorbance were measured, in order to normalize the obtained fluorescence. Then, the average for each replicate was calculated and used to establish a curve depicting GFP expression within each medium.
GFP Measurements
Hya Promoter
Cad Promoter
Constitutive Promoter
Microscopy
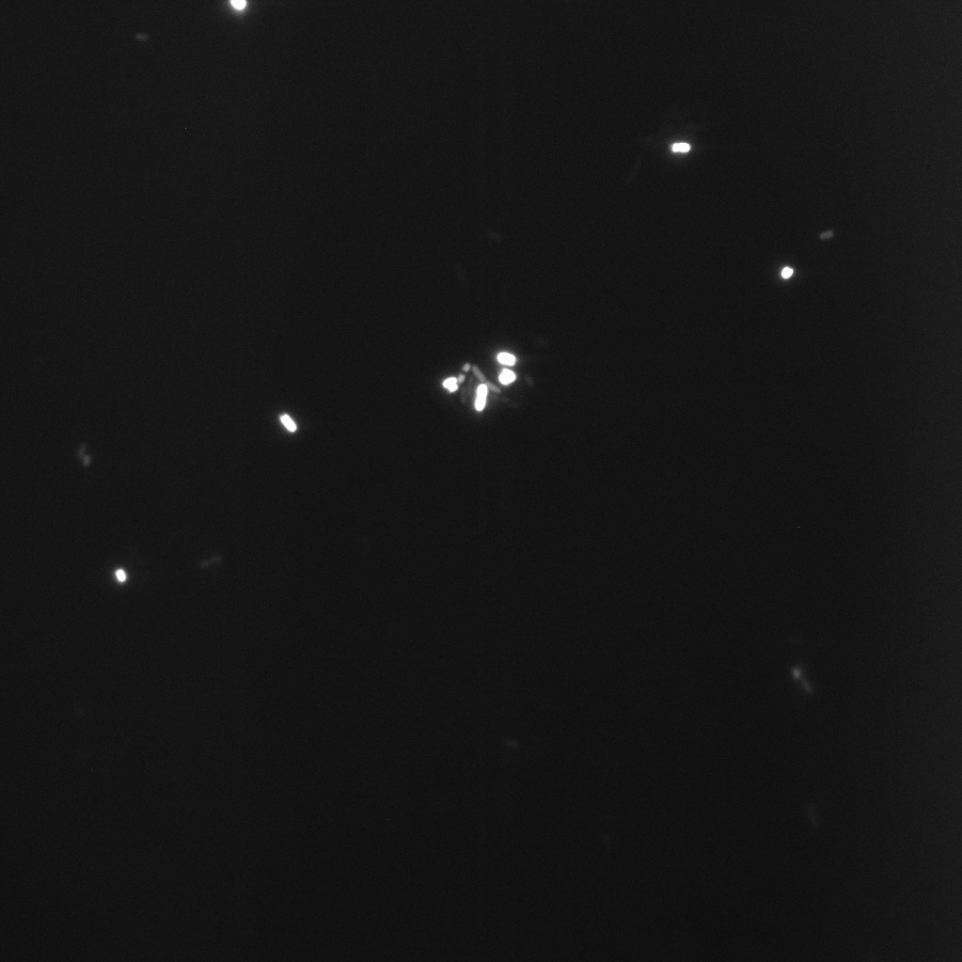
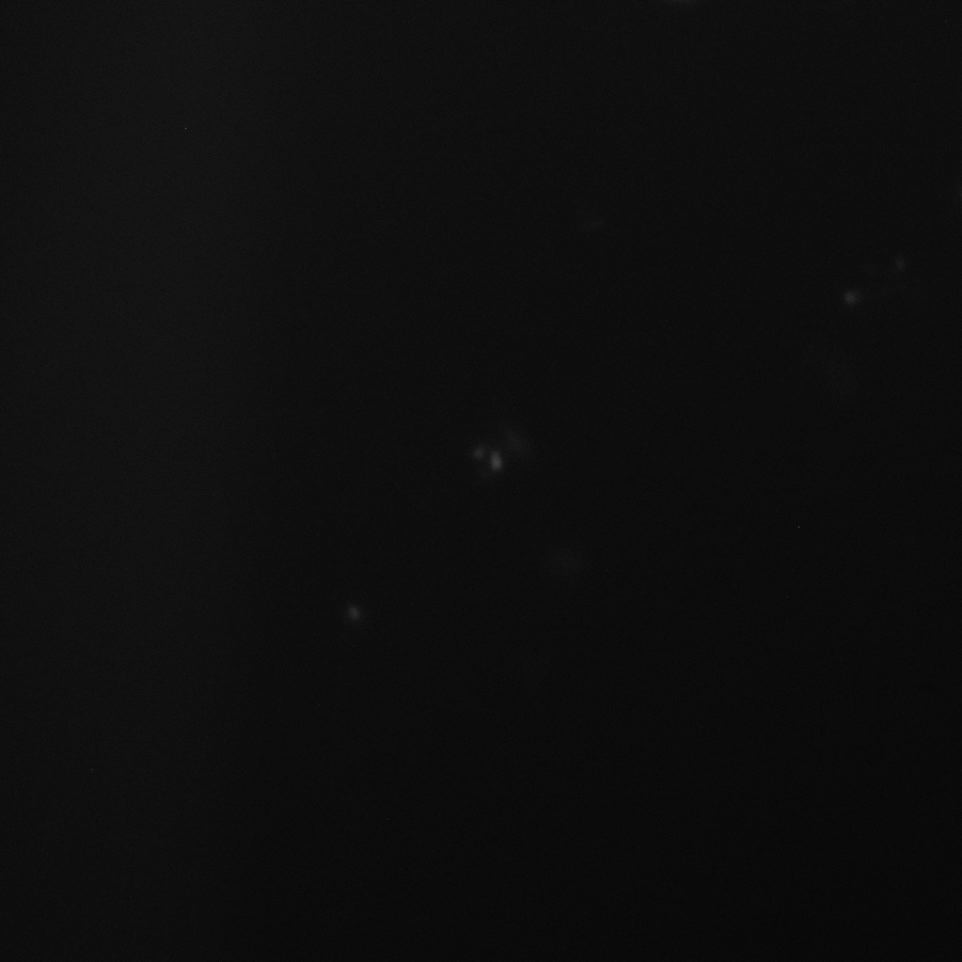
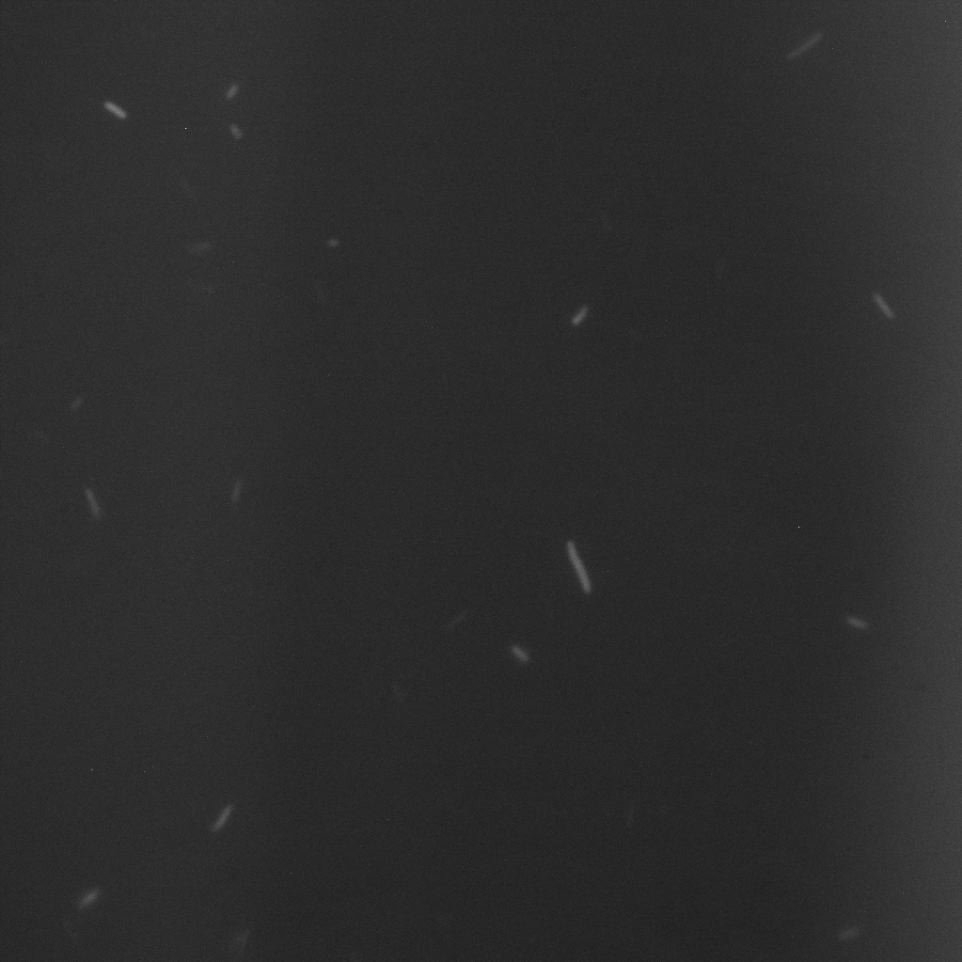
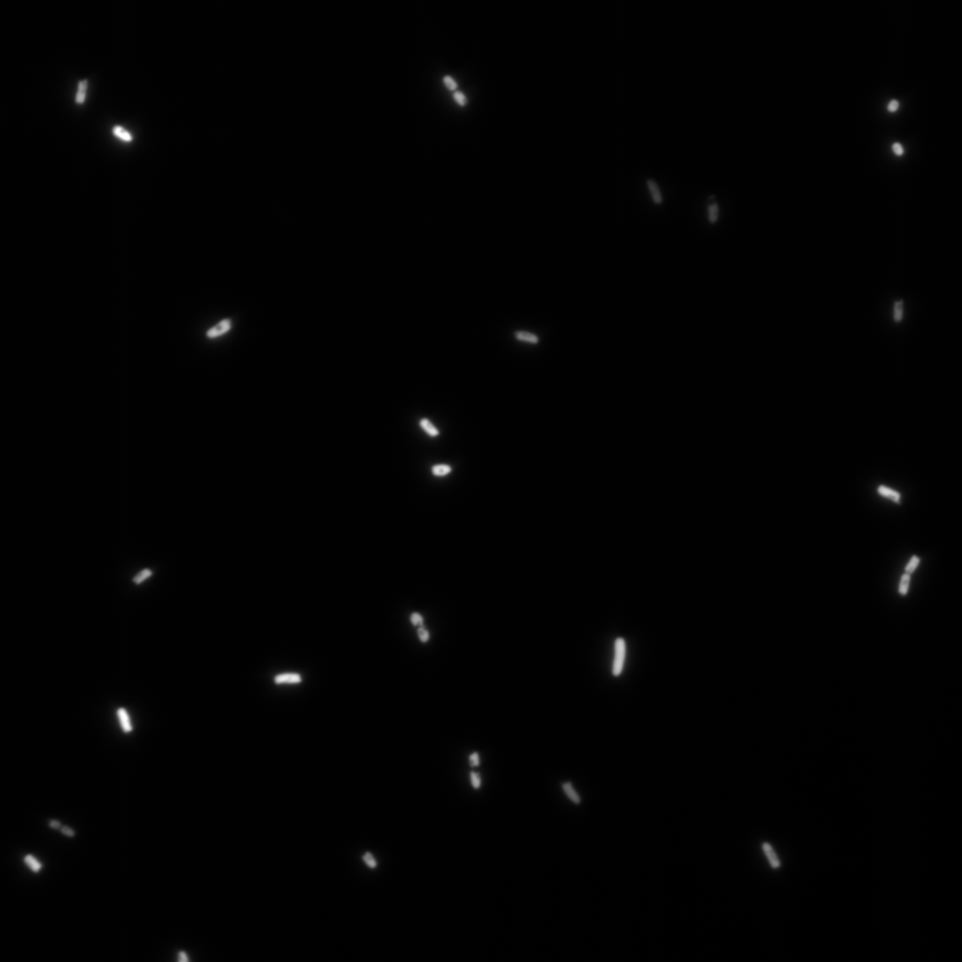
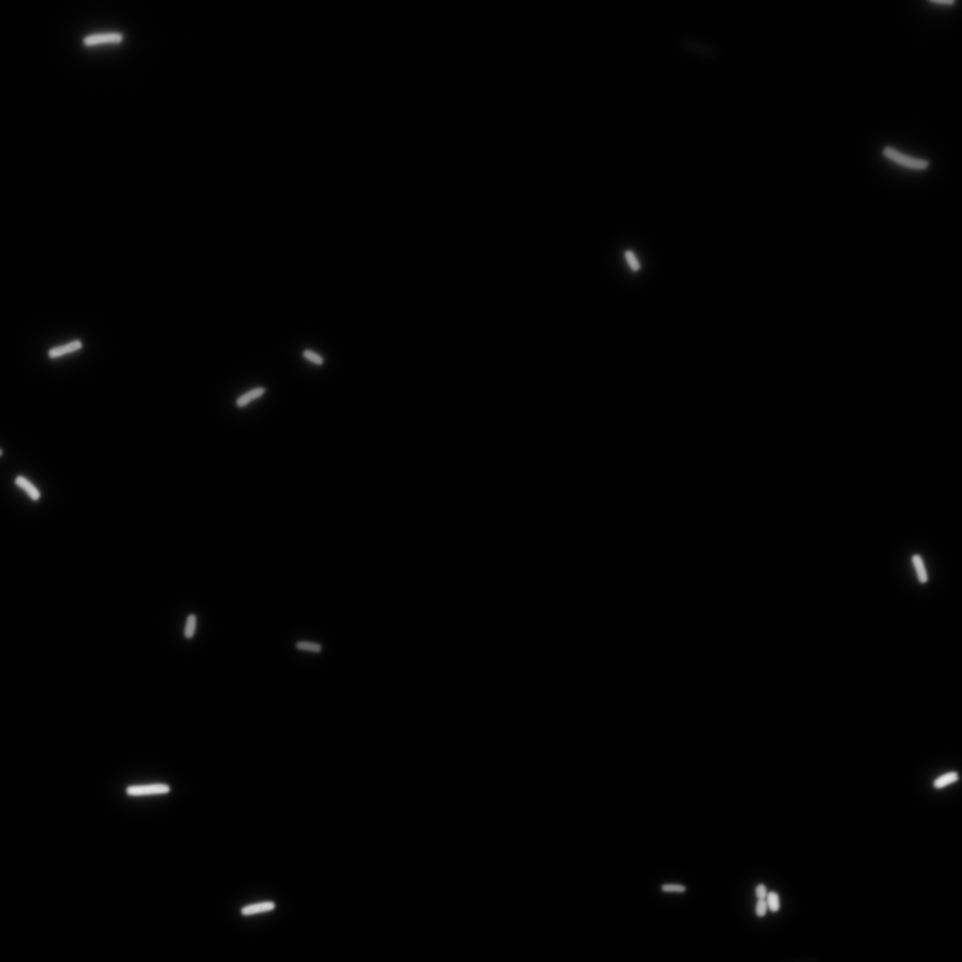
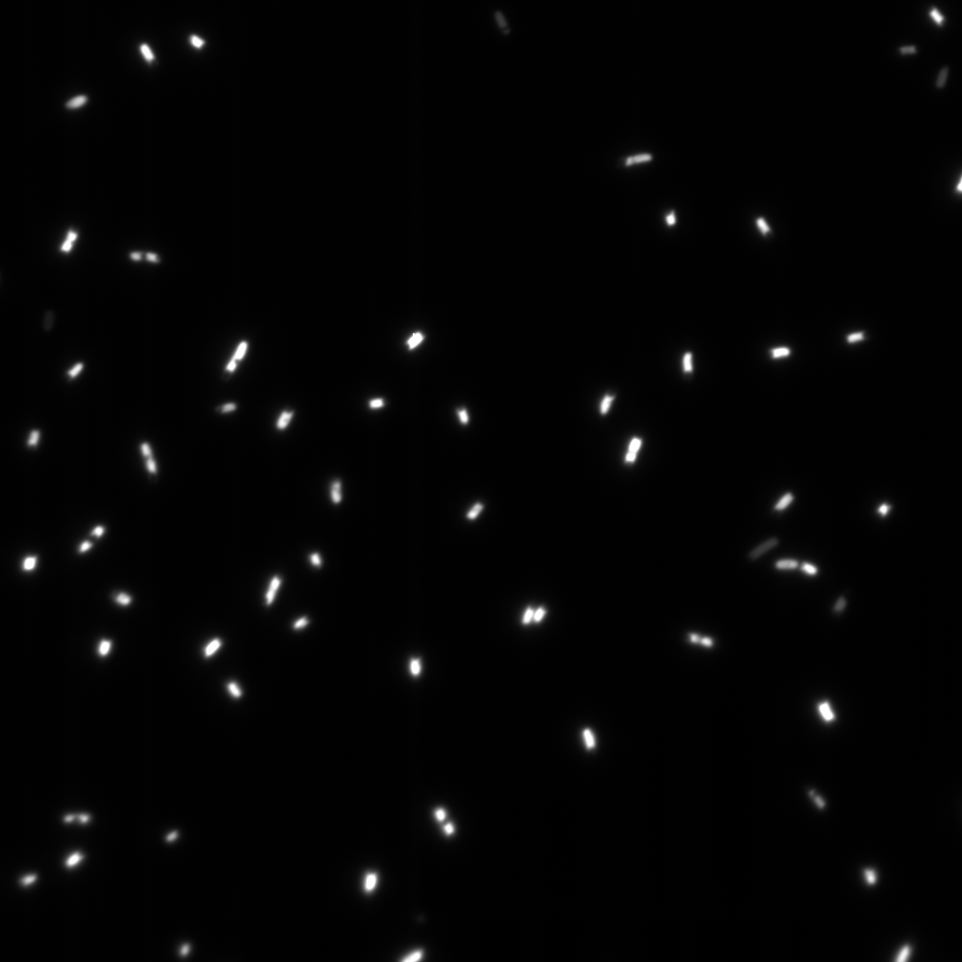
The Cells were also looked at under a microscope to qualitatively study their GFP expression.
Hya Promoter
Cad Promoter
Constitutive Promoter (Positive Control)
Note
We overexposed some of the images to be sure that there was no fluorescence in the bacteria in these media.
Expected outcome
The promoters Hya and Cad were supposed to initiate transcription upon external acidification, which would then cause the bacteria to express superfolded GFP and turn bright green. The biobrick BBa_J23119, being a constitutive promoter, would turn the bacteria green independently of their medium. For our project, the promoters were inserted in front of a gelatinase so that the later would be expressed upon arrival in an acidic medium. The bacterium would then secrete the gelatinase causing the degradation of the nanoparticle and the release of its contents.
Results
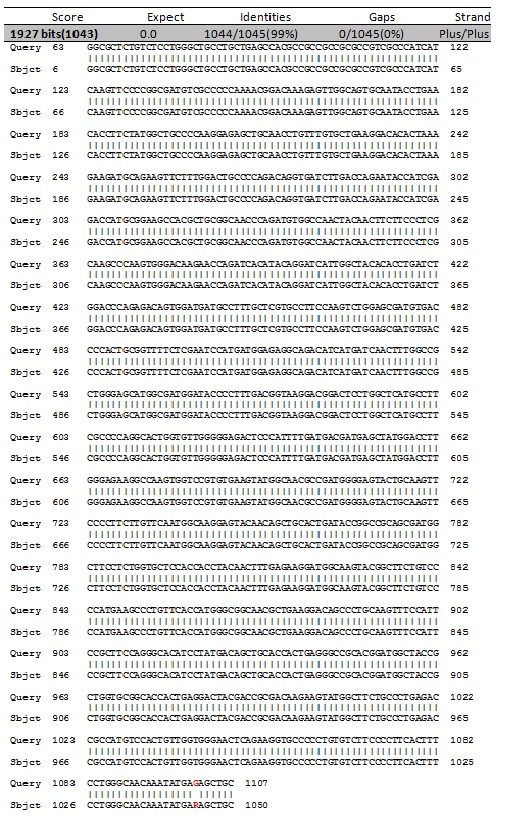
We successfully managed to PCR amplify each of the three promoters as well as to insert them by Gibson Assembly into the pSB1C3 plasmid so that they would control the expression of superfolded GFP. These assemblies were all successful, which was determined by sequencing the plasmid isolated from the positive transformants on the plate. This sequencing result showed a 100% match between the reference promoter sequence and the inserted sequence that the bacteria contained. Also, the bacteria containing the biobrick promoter turned green on the plates as well as in liquid culture, as expected.
Discussion
GFP expression under the hya and the cad promoters
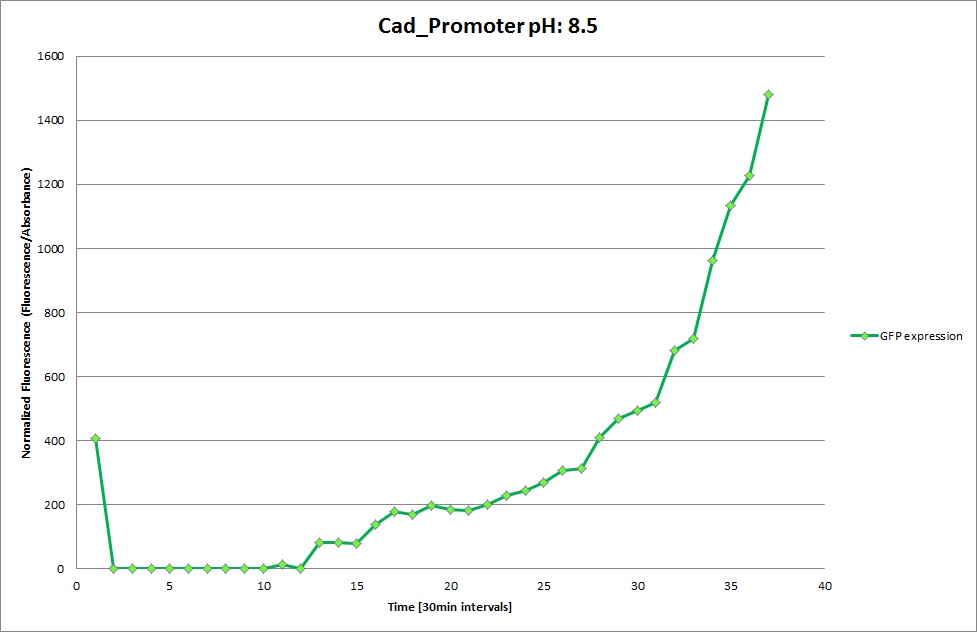
From the measurements we made on the plate reader, we were not able to conclude whether the promoters are really induced at low pH as the cells died very quickly. This was also supported by the OD measurements we took. On those graphs one can see very clearly that the cells which are in the acidic media die almost immediately. Furthermore, there was some expression in both the neutral and the basic medium. This would indicate that the promoter is either a constitutive promoter or that it is inducible but leaky.
Comparing these graphs with the microscopy pictures, one cannot say conclusively that the promoter is inducible by pH. Even though under the microscope there are only fluorescent bacteria at acidic pH, the results from the plate reader clearly indicate that there are also fluorescent bacteria at neutral and high pH. However, one can see a trend that for both the hya and the cad promoter, the fluorescence is strongest at acidic pH and weakest at basic pH under the microscope. This trend cannot be seen in the Plate Reader measurements, as the bacteria at low pH die before being able to express GFP.
Using the constitutive promoter as a positive control one can see that both hya and cad are weak promoters, as the fluorescence in the bacteria with the constitutive promoter is much stronger in acidic, neutral and basic media than the fluorescence in bacteria containing the hya or the cad promoter. Furthermore, a comparison with the constitutive promoter again supports the hypothesis that the bacteria grow best at neutral pH, as there are much more bacteria at pH 7 and at pH 6.5 or 8.5.
Conclusion
Thus, we can conclude that the hya promoter and the cad promoter work, in the sense that they in fact induce expression of GFP. But from our data, we were not able to conclusively say that they are inducible by low pH.
Nevertheless, we were able to show that they are weak promoters that can be used to express a protein that should be present at low concentrations.
With respect to our project
In order to be sure that hya and cad are induced only at low pH, we would need to do further testing. As soon as their inducibility would be confirmed, we would insert them by gibson assemly in front of either GelE gelatinase or MMP2 gelatinase. Upon arrival in a medium with pH below 7 the enzyme would be synthesized and released.
References:
[http://jb.asm.org/content/181/17/5250.full [1]] Journal of Bacteriology
Response of hya Expression to External pH in Escherichia coli
Paul W. King and Alan E. Przybyla
J.Bacteriol. 1990
[http://jb.asm.org/content/173/15/4851.abstract?sid=2a119bc7-0c26-4543-a671-d3a50521253f [2]] Journal of Bacteriology
Mutational analysis and charecterization of the Escherichia coli hya operin, which encodes [NiFe] hydrogenase1
N K Menon, J Robbins, J C Wendt, K T Shanmuagam and A E Przybyla
J. Bacteriol 1991
[http://jb.asm.org/content/174/8/2659.short [3]] Journal of Bacteriology
Nucleotode Sequence of the Escherichiea coli cad Operon: a system for neutralization of Low Extracellular pH
Shi-Yuan meng and George N. Bennett
J. Bacteriol 1992
[http://jb.asm.org/content/174/8/2670.short [4]] Journal of Bacteriology
Regulation of the Escherichia coli cad Operon: Location of a Site Required for Acid Induction
Shi-Yuan meng and George N. Bennett
J. Bacteriol 1992
Effecting
Overview
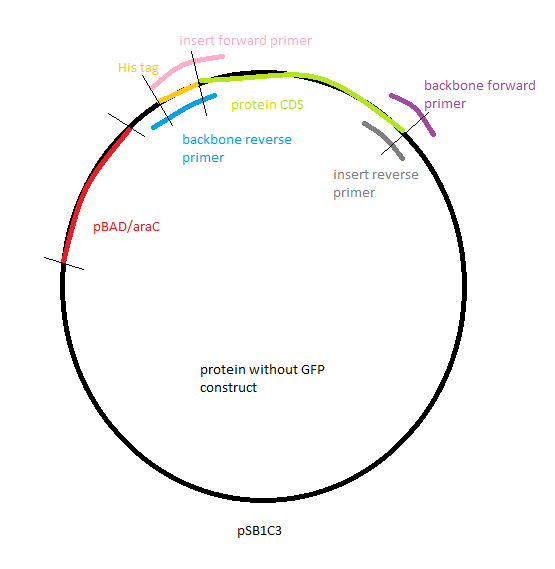
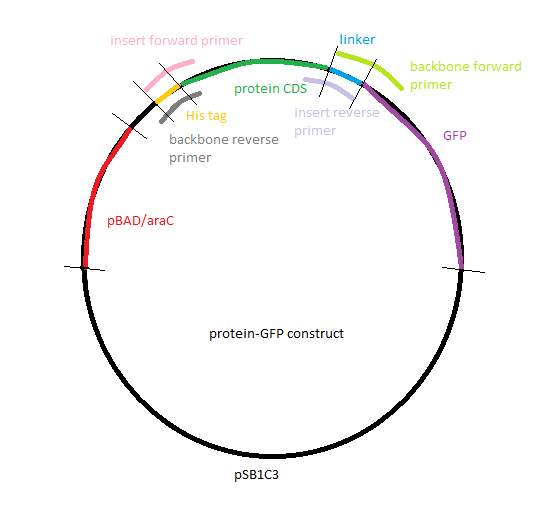
The goal of the effecting part was to build a plasmid containing an arabinose-inducible promoter driving a tagged enzyme able to cleave gelatin, the polymer used to build our nanoparticles. We chose three different enzymes that were inserted into part BBa_I746908([http://parts.igem.org/Part:BBa_I746908 [BBa_I746908, Main Page]) either between the promoter and GFP or replacing the GFP. All of the constructs were designed to have a His tag at the beginning of the protein so we could extract and purify our expressed protein.
We would then transform cells with our construct, make them express the gelatinase by inducing the promoter and then isolate and purify the protein.
Experiments
The three different enzymes that we chose to use were gelatinase E (gelE) from Gram positive bacterium E.faecalis , metalloprotease 2 (MMP2) from H. sapiens [http://plasmid.med.harvard.edu/PLASMID/GetCloneDetail.do?cloneid=2849&species=Homo%20sapiens [1]] and metalloprotease 9 (MMP9) from M. musculus. We ordered the genomic DNA of E.faecalis as well as two plasmids containing the CDSs of MMP2 and MMP9 from plasmid.med.harvard.edu.
PCR
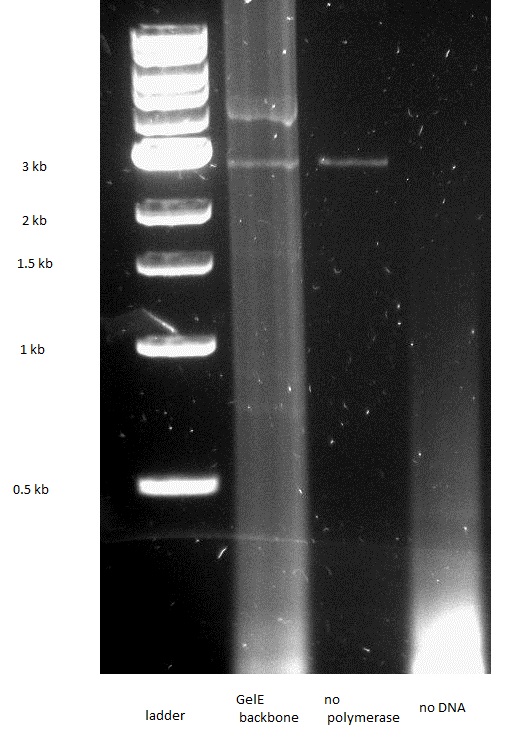
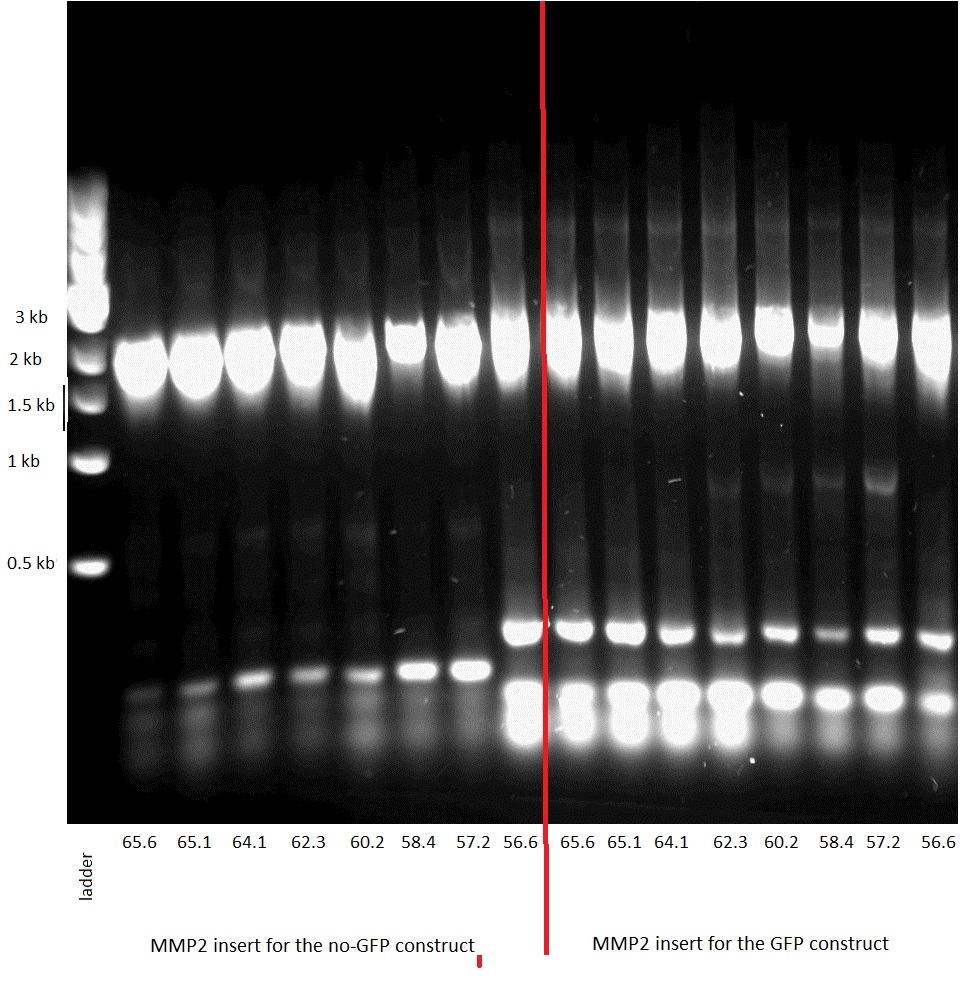
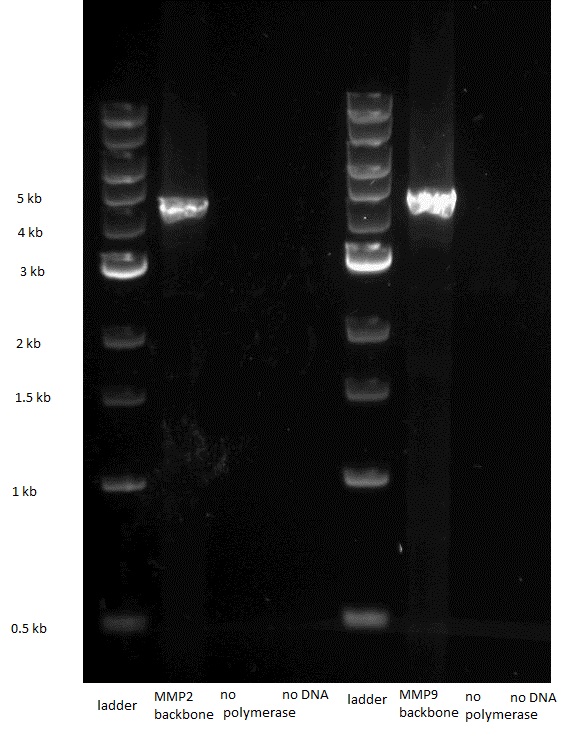
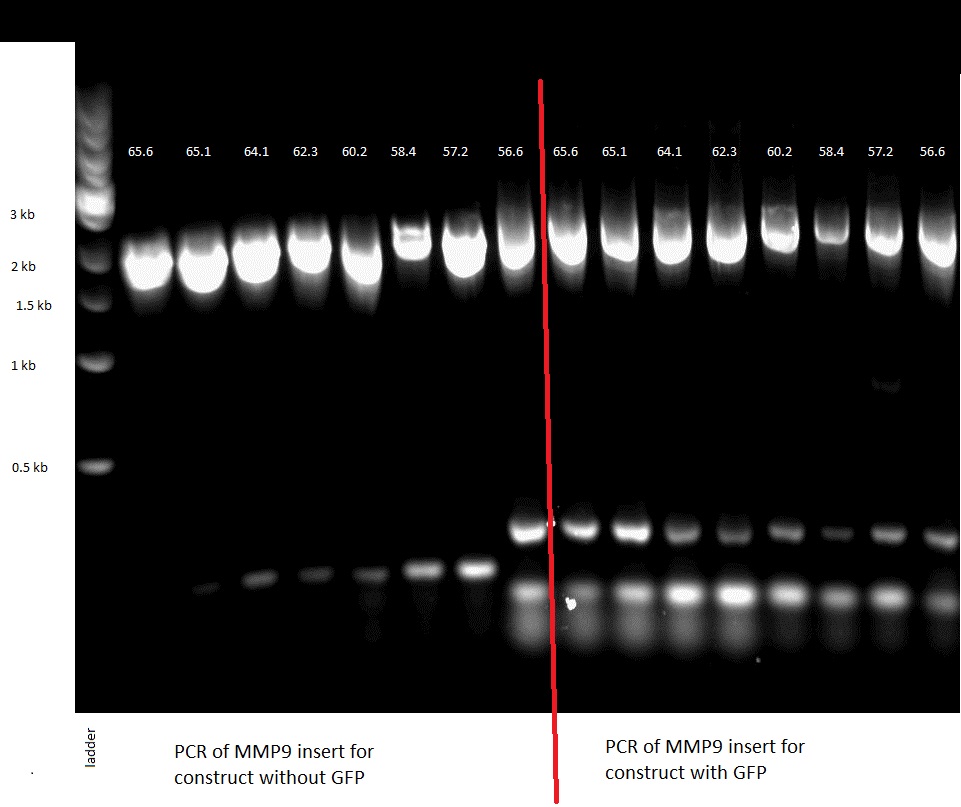
We first amplified the CDS of our three proteins by PCR. Because we had introduced a frame shift during the PCR due to our primers, we had constructs that had a stop codon in front of GFP. Thus we decided to continiue with these construct knowing that we could still purify the protein because of the His-Tag we added.
We then purified the PCR products.
Gibson Assembly
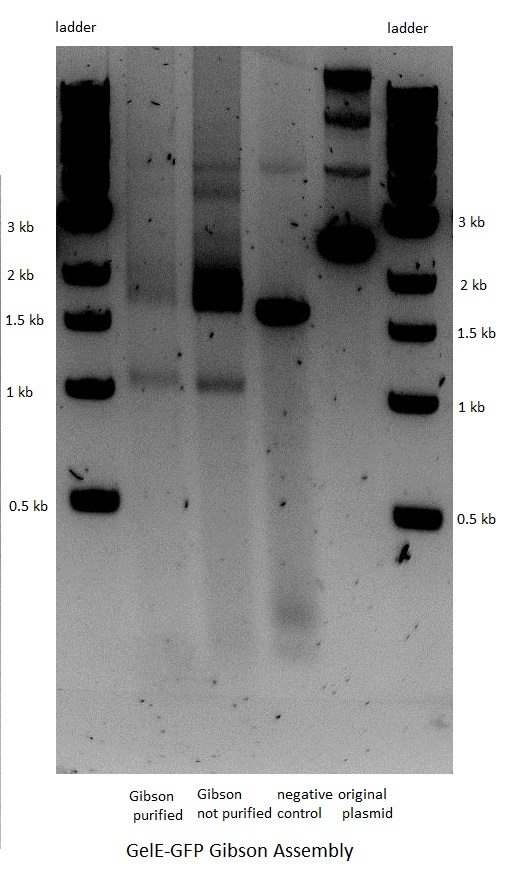
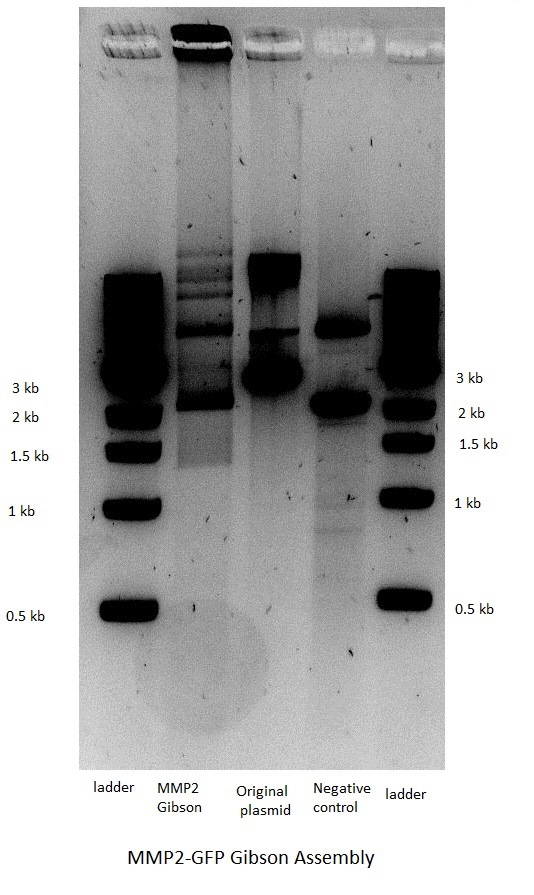
The next step was the Gibson assembly reaction which would put together the inserts and their corresponding backbones. The reaction was performed only for the constructs that should have GFP as a reporter but had a stop in front of the latter because of the above mentionned frame shift. The three other constructs that were not supposed to have GFP after the gelatinase gene were not done, as the result would have been the same.
The assembly worked for both the GelE and MMP2 constructs, but not for MMP9.
Transformation, control PCR and sequencing
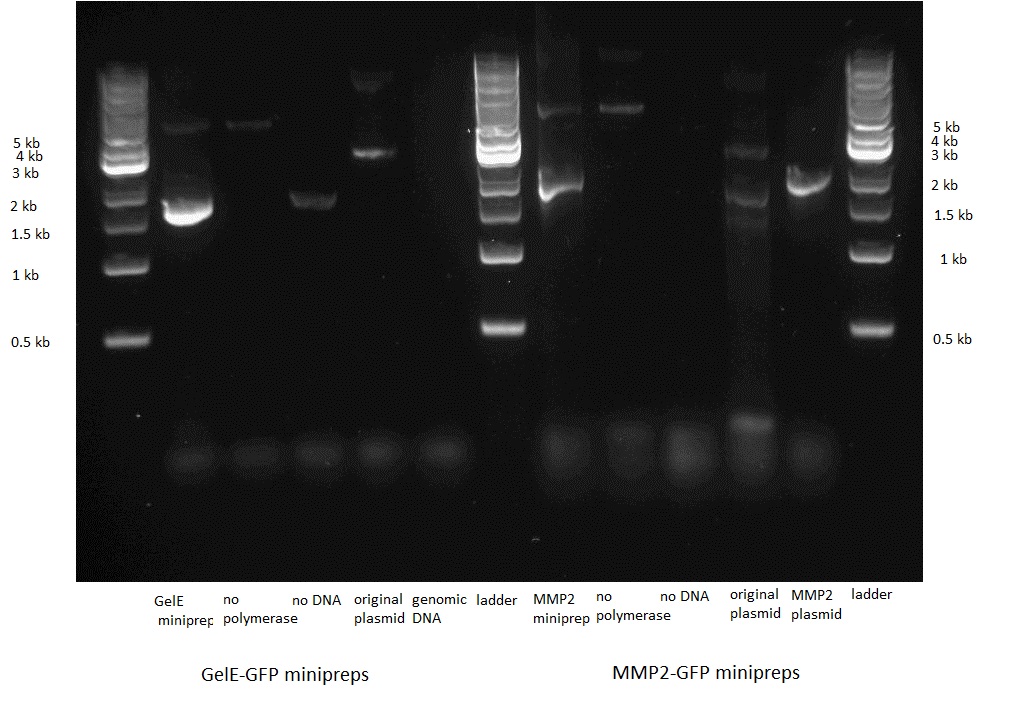
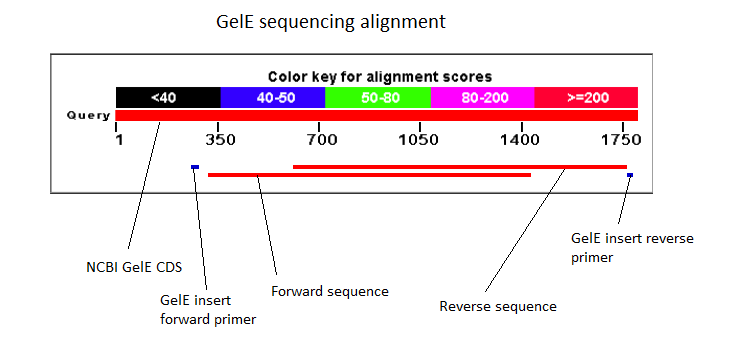
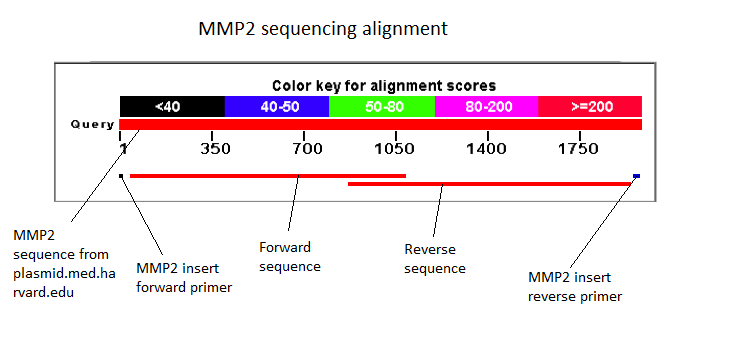
We then transformed bacteria with the two constructs. Before sending them for sequencing we did a control PCR on each using primers that were specific to the insert, i.e. the GelE and the MMP2 gene.
We also incubated the positive transformants with arabinose and looked at them under the microscope. As expected they did not express GFP.
Western Blot
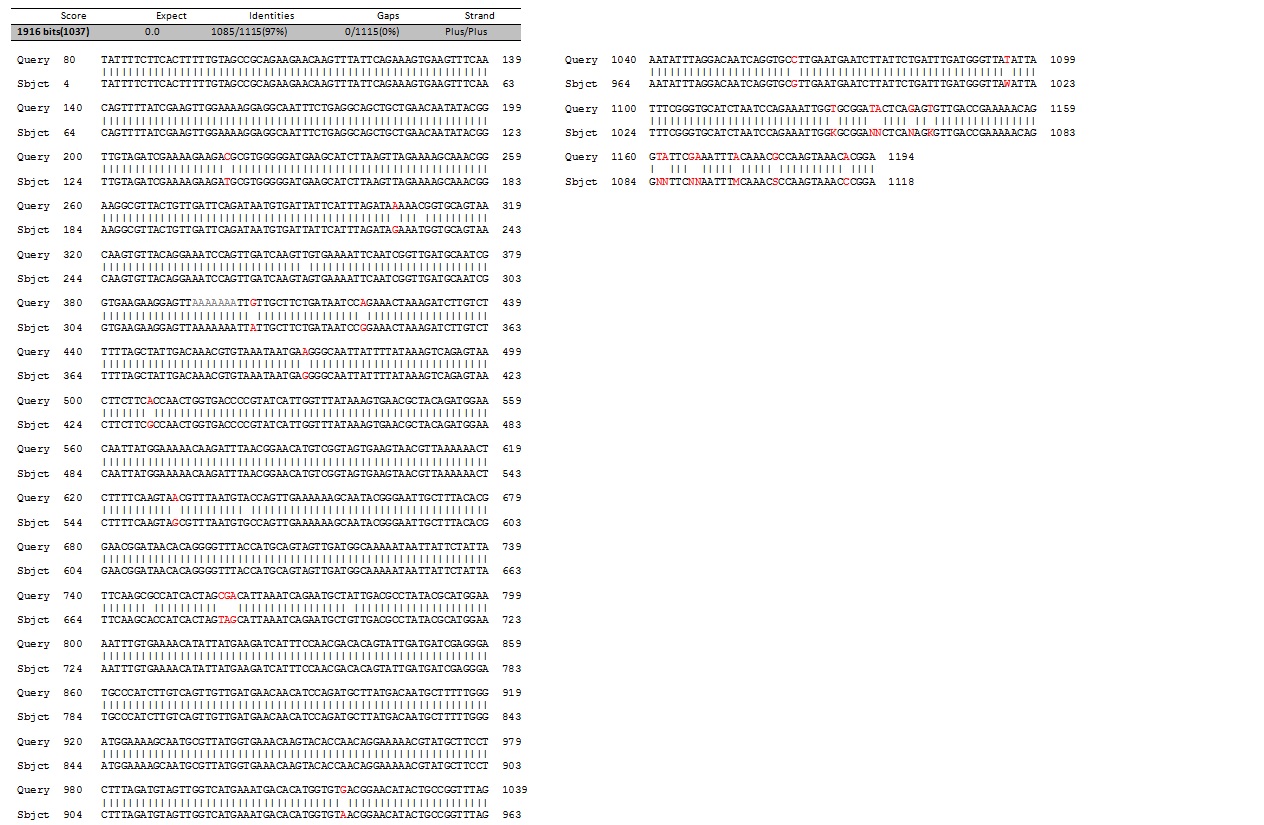
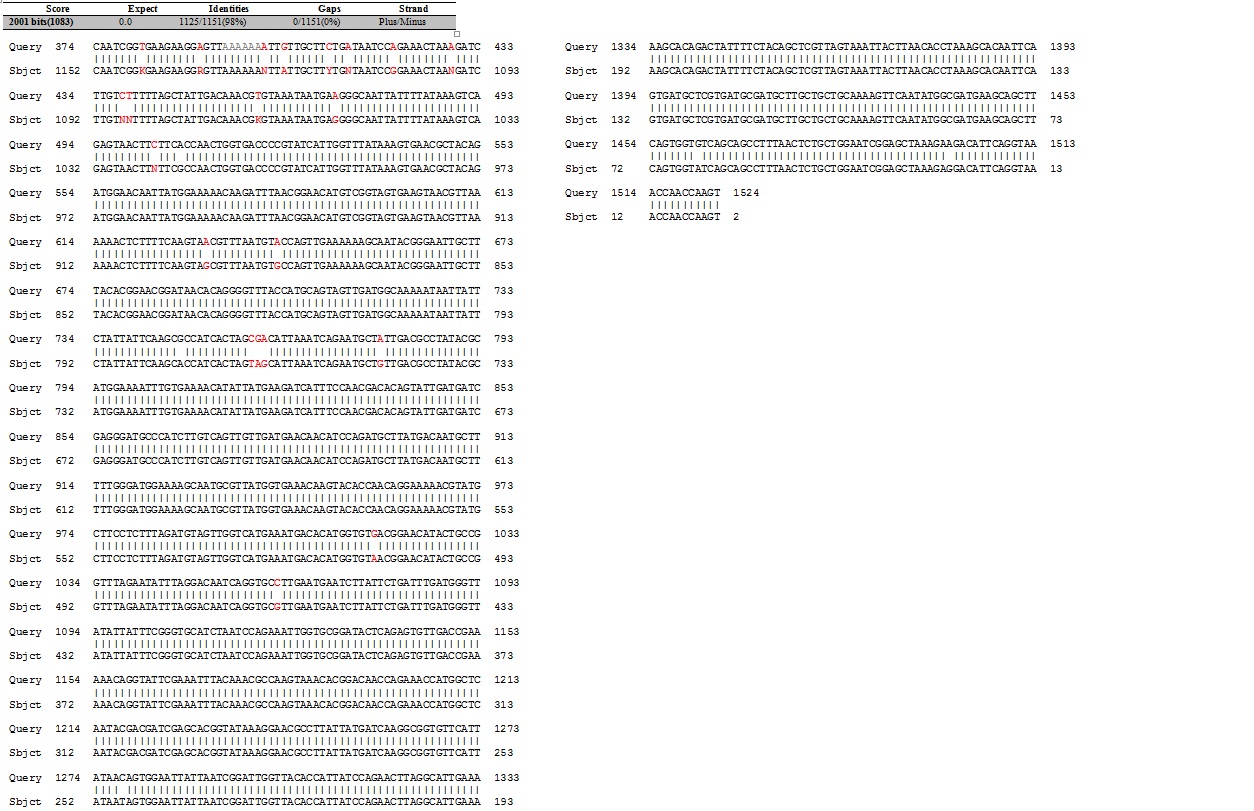
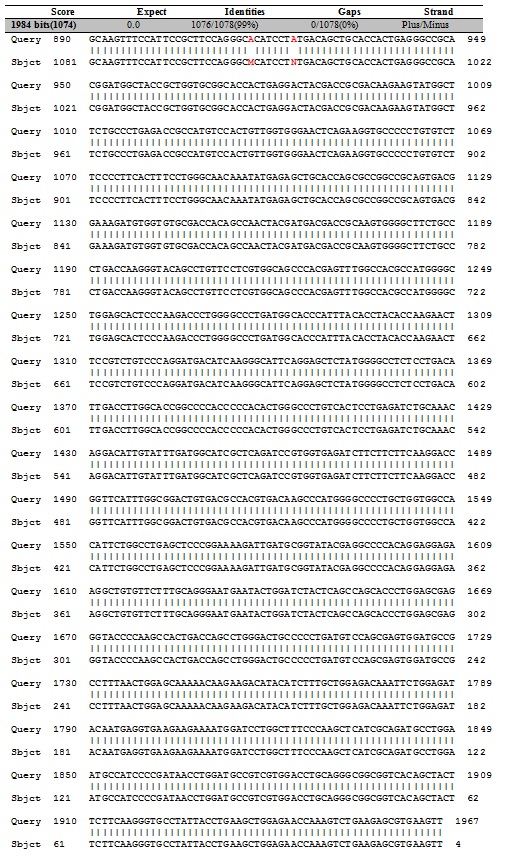
The next assay to test the expression and secretion of our proteins was a Western Blot, performed on the supernatant and cell lysate fractions of our liquid cell culture. The antibody used to detect our protein was an anti-His tag antibody, which was supposed to detect the His-tag that had been added to the CDS of our proteins. This assay unfortunately came out negative. We were unable to check for the presence of the His tag with the sequencing because the primers we used to do it did not initiate sequencing at the beginning of the protein as the sequencing starts a bit downstream of the primer binding site. The sequencing of the middle sequence showed a 97%-98% match between the insert and the reference sequence.
Protein purification and SDS-PAGE
A protein purification method under native conditions using a Ni-NTA spin kit was performed. The native conditions were chosen because we wanted to perform a digestion assay with the purified protein on the nanoparticles to assess their digestion capacities.
The lysates, flow-through, wash and final eluate (supposed to contain the purified protein) were kept and analysed with a NanoDrop before being used for an SDS-PAGE. The NanoDrop revealed that the eluates contained no protein, but that the wash fraction contained about 0.4 mg/ml of protein. Possible reasons for this were:
1) the His tag was not properly added to the protein CDS
2) the His tag was hidden in the protein structure and could not bind to the column since the purification was done under native conditions
3.) As the Kit was left at room temperature it is possible that the binding columns were defective
When we did the SDS Page did not work due to a Coomassie stain issue.
Discussion and Future
We unfortunately could not come to a satisfying final result in the effecting part of the project because we could not prove that the plasmids actually conferred to the bacteria the ability to secrete a gelatin-degrading protein. We can later perform the digestion assay with the wash fraction of the Ni-NTA purification to see whether a gelatin-degrading protein is indeed present in it. Also, the next experiment would be to redo the SDS-PAGE on the remains of the Ni-NTA purification.
To learn more about how we would continue, see Next Steps or Perspectives
 "
"


