05/08/13
From 2013.igem.org
(Difference between revisions)
TanviSinha (Talk | contribs) (→Gel Electrophoresis) |
TanviSinha (Talk | contribs) |
||
| Line 53: | Line 53: | ||
*The lanes are in the following order: | *The lanes are in the following order: | ||
**Marker, Sample 5.1, Sample 5.2, Sample 5.3, Sample 10.1, Sample 10.2, Sample 10.3, Marker. | **Marker, Sample 5.1, Sample 5.2, Sample 5.3, Sample 10.1, Sample 10.2, Sample 10.3, Marker. | ||
| - | *We were expecting to see a 2kb and 5kb band. These bands appeared for samples 5.1, 10.1 and 10.2. To determine the composition of | + | *We were expecting to see a 2kb and 5kb band. These bands appeared for samples 5.1, 10.1 and 10.2. To further determine the composition of samples, we did a single digest on the samples. |
| + | |||
| + | ==Single digest== | ||
| + | *For samples 5.1, 10.1, 10.2 and 10.3 two single digests each were made with EcoRI and PstI, giving a total of 8 samples. | ||
| + | *The samples are run on 0.8% agarose gel. | ||
Revision as of 09:15, 6 August 2013
| Home | Team | Official Team Profile | Project | Parts Submitted to the Registry | Modeling | Notebook | Safety | Attributions |
|---|
Contents |
Isolation of ligated plasmid
- The ligated plasmid- chloramphenicol backbone and limonene biobrick, were isolated from cells that were incubated overnight in broth by miniprep.
- Protocols from both Bioline kit and Thermoscientific were used for the miniprep.
- there were 6 tubes containing the plasmid.
- The plasmid concentration in each of the 6 tubes were measured using nanodrop.
- 200ng of plasmid from each of the 6 different tube was used for digestion.
| sample | volume(ul) | concentration (ng/ul) | yield(ug) |
| 5.1 | 99 | 75 | 7.4 |
| 5.2 | 100 | 44.2 | 4.4 |
| 5.3 | 98 | 46.7 | 4.6 |
| 10.1 | 46 | 61.8 | 2.84 |
| 10.2 | 44 | 77.1 | 3.39 |
| 10.3 | 47 | 13.7 | 0.64 |
Digestion of ligated plasmid
- Master Mix (changes were made from the protocol)
- 2ul of NEB Buffer
- 1ul of EcoRI
- 1ul of PstI
- varying concentration of dH2O and plasmid depending on overall concentration of plasmid in each tube.
- Final volume of each of the 6 tubes was 20ul.
Gel Electrophoresis
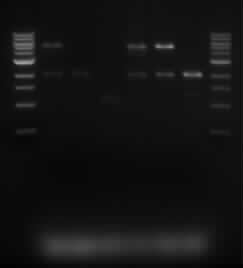
- The product of digestion was run on agarose gel
- This was done in order to confirm the presence of the limonene biobrick
- The lanes are in the following order:
- Marker, Sample 5.1, Sample 5.2, Sample 5.3, Sample 10.1, Sample 10.2, Sample 10.3, Marker.
- We were expecting to see a 2kb and 5kb band. These bands appeared for samples 5.1, 10.1 and 10.2. To further determine the composition of samples, we did a single digest on the samples.
Single digest
- For samples 5.1, 10.1, 10.2 and 10.3 two single digests each were made with EcoRI and PstI, giving a total of 8 samples.
- The samples are run on 0.8% agarose gel.
 "
"
