Team:TU Darmstadt/result
From 2013.igem.org
| Line 143: | Line 143: | ||
<font size="3" color="#F0F8FF" face="Arial regular"> | <font size="3" color="#F0F8FF" face="Arial regular"> | ||
<p text-aligne:left style="margin-left:50px; margin-right:50px"> | <p text-aligne:left style="margin-left:50px; margin-right:50px"> | ||
| + | |||
<b>Growth curves:</b><br> | <b>Growth curves:</b><br> | ||
| + | |||
In order to determine the influence of the induced constructs mKate and LssmOrange on the BL21DE3 cells, growth curves were generated. During a time period of 8 h the ODs of the samples were measured at a wavelength of 600 nm in time steps of 15 min. The measurement was started at an OD<sub>600nm</sub> value of 0.3. With the help of the following formulas the growth rate k and the doubling time t<sub>d</sub> were calculated: | In order to determine the influence of the induced constructs mKate and LssmOrange on the BL21DE3 cells, growth curves were generated. During a time period of 8 h the ODs of the samples were measured at a wavelength of 600 nm in time steps of 15 min. The measurement was started at an OD<sub>600nm</sub> value of 0.3. With the help of the following formulas the growth rate k and the doubling time t<sub>d</sub> were calculated: | ||
<br> | <br> | ||
| Line 149: | Line 151: | ||
<br> | <br> | ||
The calculated values of k and t<sub>d</sub> of the competent cells BL21DE3 with the mKate or LssmOrange construct were compared to the level of the wild type strain to reveal possible toxicity of the constructs. In the following diagrams the OD<sub>600</sub>, respectively the ln OD<sub>600</sub> values, are plotted against the time. In the table below the resulting values of the growth rate k and the doubling time t<sub>d</sub> are listed. <br><br> | The calculated values of k and t<sub>d</sub> of the competent cells BL21DE3 with the mKate or LssmOrange construct were compared to the level of the wild type strain to reveal possible toxicity of the constructs. In the following diagrams the OD<sub>600</sub>, respectively the ln OD<sub>600</sub> values, are plotted against the time. In the table below the resulting values of the growth rate k and the doubling time t<sub>d</sub> are listed. <br><br> | ||
| + | |||
Graph!<br> | Graph!<br> | ||
| + | |||
Caption:Growth curves of BL21DE3 WT, BL21DE3 mKate and BL21DE3LSSmOrange. The OD<sub>600</sub> values are plotted against the time [min]. <br> | Caption:Growth curves of BL21DE3 WT, BL21DE3 mKate and BL21DE3LSSmOrange. The OD<sub>600</sub> values are plotted against the time [min]. <br> | ||
| + | |||
Graph!<br> | Graph!<br> | ||
| + | |||
Caption: Semi-logarithmic growth curves of BL21DE3 WT, BL21DE3 mKate and BL21DE3LSSmOrange. The ln (OD<sub>600</sub> values) are plotted against the time [min].<br><br><br> | Caption: Semi-logarithmic growth curves of BL21DE3 WT, BL21DE3 mKate and BL21DE3LSSmOrange. The ln (OD<sub>600</sub> values) are plotted against the time [min].<br><br><br> | ||
Table: The growth rate k and the doubling time t<sub>d</sub> of BL21DE3 WT, BL21DE3 mKate and BL21DE3LSSmOrange.<br> | Table: The growth rate k and the doubling time t<sub>d</sub> of BL21DE3 WT, BL21DE3 mKate and BL21DE3LSSmOrange.<br> | ||
Revision as of 22:48, 3 October 2013
Our results
LSSmOrange:
LSSmOrange is an orange fluorescent protein that we want to use for FRET, we us it as a donor. In an
actual paper Daria M. Shcherbakova[1] showed that LSSmOrange has an excitation maximum by
437 nm and an emission maximum by 572 nm.
In the following diagram (graph 1) one can see our results with our own expressed LSSmOrange. The
colored dots show the different maximums. The excitation maximum is at 415 nm, another at 453 nm
and our measured emission maximum is at 564 nm. This aberration changes nothing
on the FRET system. The excitation maximum is big enough to stimulate mKate, the other fluorescent
protein. Of course, we checked also the emission and excitation of our Bl21DE3 cells (data
not shown) and we can eliminate the theories that these cells disturb this florescence measurement.
Graph 1 "Bl21DE3pLys[pBR-IBA2-Lssmorange]"
Caption: Excitation Spectrum (dashed line) and emission spectrum (solid line) from
LssmOrange with marked maximums.
mKate:
mKate2 is a red fluorescent protein that we want to use as a acceptor for FRET. According to Evrogen[2]
mKate2 has an excitation maximum at 588 nm and an emission maximum at 633 nm. The
diagram below (graph 2, colored dots) shows that the excitation maximum is at 579 nm and the
emission maximum is 611 nm. The first peak does not look exactly like a single peak, but we can see a
clear maximum. The problem for our FRET system is the very low intensity which results
in the next diagram (graph 3) in a huge difference of intensity of the two fluorescence
proteins.
Graph 2 "Bl21DE3pLys[pBR-IBA2-mKate]"
Caption:Excitation Spectrum (dashed line) and emission spectrum (solid line) of
mKate with marked maximums.
FRET:
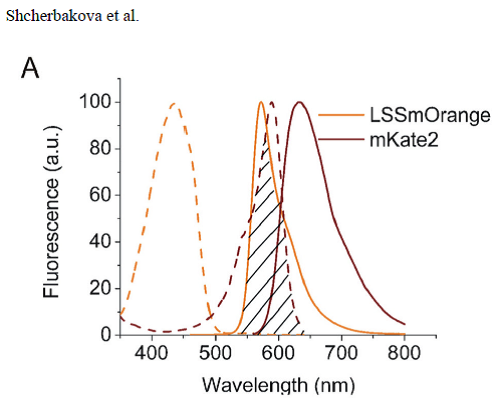
Both diagrams in an overlay shows us the FRET system. LSSmOrange is the donor and mKate is the
acceptor. For an optimum in FRET, it should display a stronger overlap between the emission maximum of LssmOrange and the excitation maximum of mKate.
Graph 3 "FRET pair LSSmOrange-mKate"
Caption:Overlay of figure 1 and figure 2.
The next figure is from the paper of M. Shcherbakova. In this figure one can
clearly see the overlap between donor and acceptor in an optimal FRET system.

(dashed line = excitation spectrum, solid line = emission spectrum)
Growth curves:
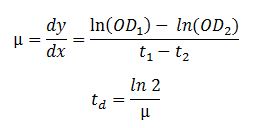
In order to determine the influence of the induced constructs mKate and LssmOrange on the BL21DE3 cells, growth curves were generated. During a time period of 8 h the ODs of the samples were measured at a wavelength of 600 nm in time steps of 15 min. The measurement was started at an OD600nm value of 0.3. With the help of the following formulas the growth rate k and the doubling time td were calculated:

The calculated values of k and td of the competent cells BL21DE3 with the mKate or LssmOrange construct were compared to the level of the wild type strain to reveal possible toxicity of the constructs. In the following diagrams the OD600, respectively the ln OD600 values, are plotted against the time. In the table below the resulting values of the growth rate k and the doubling time td are listed.
Graph!
Caption:Growth curves of BL21DE3 WT, BL21DE3 mKate and BL21DE3LSSmOrange. The OD600 values are plotted against the time [min].
Graph!
Caption: Semi-logarithmic growth curves of BL21DE3 WT, BL21DE3 mKate and BL21DE3LSSmOrange. The ln (OD600 values) are plotted against the time [min].
Table: The growth rate k and the doubling time td of BL21DE3 WT, BL21DE3 mKate and BL21DE3LSSmOrange.
TABLE
As can be seen in the two diagrams, the course of the growth curves are similar. The growth rate as well as the doubling time of the wild type BL21DE3 and the one including the LSSmOrange construct are almost identical. The growth rate of the strain including the mKate construct is slightly lower and therefore the doubling time is around 5 minutes higher. All in all, the differences of the samples including the constructs compared to the wild type BL21DE2 are neglectable low. Therefore, it can be assumed that the construct mKate as well as LSSmOrange are not toxic for the BL21DE3 cells and have no or a neglectable low influence on the growth of the cells.
References
[1] J Am Chem Soc. 2012 May 9; 134(18): 7913–7923. doi:10.1021/ja3018972
Daria M. Shcherbakova, An orange fluorescent protein with a large Stokes shift for
single-excitation multicolor FCCS and FRET imaging.
[2] http://www.evrogen.com/products/basicFPs.shtml
 "
"