 "
"


Header
Contents |
Overview
We adressed the following question :
How can one bind Nanoparticles to bacteria?

Once we knew we wanted to bind nanoparticles to bacteria we needed an idea how to connect those two components. We came up with the idea to use one of the strongest non covalent interactions existing in nature, the interaction between streptavidin and biotin with a Kd of 10-14 mol/l. Streptavidin is a tetrameric protein, each of the four subunits can bind one biotin. The streptavidin-biotin complex is resistant against different pHs, temperatures and detergents. Moreover streptavidin binding is highly specific.
So, in order to achieve our device and couple nanoparticles to bacteria, these latters need to express streptavidin on its surface on one sied and the nanoparticles need to be biotynilated on the other side.
INP-Streptavidin
E.Coli are Gram-negative bacteria and they have two membranes, an inner one and an outer one, separated by a periplasmic space. Furthermore, the outer membrane is covered with a glycocalix, a layer of sugars.
 There are different strategies to express a heterologous protein on the outer membrane of E.coli. Peptides can be fused with outer membrane proteins, or on fimbriae, fused to beta-autotransporters or lipoproteins, as for example the (Lpp)-OmpA protein which was used by the igem team 2006 of Harvard and the igem team 2009 of Washington. But then there is also another promising display system that uses ice nucleation protein (INP) from Pseusomonas syringae, which is a glycosyl-phosphatidyliositol anchored outer membrane protein. The GPI anchor is normally used by eukaryotes, so to see this motif in prokaryotes is quite unique. Over 90% of INP is found in the outer membrane when it is expressed in E.coli (Wolber et al). It has successfully been used for cell surface display of enzymes, single-chain antibodies and antigens.
Jung et al ([1]) successfully expressed functional levansucrase (47 KDa) on the surface of E.coli by fusing it to INP. Streptavidin is only 14 kDa, so we assumed that it should be even easier for the E.coli to export it.
There are different strategies to express a heterologous protein on the outer membrane of E.coli. Peptides can be fused with outer membrane proteins, or on fimbriae, fused to beta-autotransporters or lipoproteins, as for example the (Lpp)-OmpA protein which was used by the igem team 2006 of Harvard and the igem team 2009 of Washington. But then there is also another promising display system that uses ice nucleation protein (INP) from Pseusomonas syringae, which is a glycosyl-phosphatidyliositol anchored outer membrane protein. The GPI anchor is normally used by eukaryotes, so to see this motif in prokaryotes is quite unique. Over 90% of INP is found in the outer membrane when it is expressed in E.coli (Wolber et al). It has successfully been used for cell surface display of enzymes, single-chain antibodies and antigens.
Jung et al ([1]) successfully expressed functional levansucrase (47 KDa) on the surface of E.coli by fusing it to INP. Streptavidin is only 14 kDa, so we assumed that it should be even easier for the E.coli to export it.
Streptavidin originates from the bacterium Streptomyces avidinii (link ncbi link). It is a tetrameric protein, which means it has 4 subunits, each of them can bind a biotin molecule. For our Biobricks we used different kinds of streptavidin.
The Biobrick BBa_K1111014 contains streptavidin that was cloned out of the Biobrick BBa_K283010.
The Biobrick BBa_K1111012 has the coding sequence of a monomeric streptavidin, which means only one of the four subunits of streptavidin is able to bind to biotin. This decreases the dissociation rate. The plasmid containing the sequence was provided by the laboratory of Mark Howarth at Oxford university Dept. of Biochemistry (http://users.ox.ac.uk/~bioc0756/MyWebs/activesite/index.htm).
The Biobrick BBa_K1111013 was designed to serve as a negative control for our experiments, it contains a dead version of streptavidin, which means it doesn’t bind to biotin.
Our Biobricks

Roter Bereich
Bla
Blauer Bereich
Bla
Schwarzer Bereich
Bla
INP-YFP Characterization
There was already a Biobrick that contained INP in the registry (BBa_K523013), so we decided to use it. It was designed by the Edinburgh igem team of 2011 (https://2011.igem.org/Team:Edinburgh/Cell_Display). This Biobrick encodes a fusion protein of a truncated and codon optimized INP and yellow fluorescent protein (YFP) under control of the LacZ promoter. The INP is truncated, it only contains the first 211 and last 97 amino acids that are normally encoded by the inaK gene. This is enough to target it to the outer membrane.
We improved the Biobrick BBa_K523013 by extensively characterizing it.
We used confocal microscopy (Thanks to Thierry Laroche from the "plateforme technologique de bio-imagerie et imagerie otpique" for operating the microscope) to see if it was expressed and eventually show surface localization.


Looking at E.Coli we noticed that fluorescence was localized in specific spots, that the team of Edinburgh didn’t describe. We continued characterizing this biobrick by first determing the percentage of bacteria that was fluorescent, approximatively 30% of E.coli expressed YFP. We also counted the percentage of fluorescent bacteria that showed these dots of very strong fluorescence, around XX%. We started looking for an explanation for this phenomena and found in the literature, that INP forms aggregates in the cell membrane [2], to have good ice nucleation abilities. So it suggests that this also happens if INP is fused to another protein, which seems to be the case.
The team of Edinburgh grew bacteria and lysed them. After centrifugation, they looked where the fluorescence seemed concentrated. On the transformed bacteria, it was mainly the pellet that appeared fluorescent, meaning that the fusion protein was embedded in the membrane. The negative control, in contrast, showed fluorescence in the pellet as well as in the supernatant with the same intensity. This method was used because their microscopy was not good enough.
Like this team, we didn't succed to proof surface localization with the intrinsic fluorescence of the YFP. There was a signal, which was a goo sign, but quite diffuse. So we came up with an alternative strategy an immunofluorescent assay with an anti GFP antibody (which also binds to YFP because of their close conformations) (Thanks to XXX for providing us with the antibody). Then we made images with the microscope first a bright field, then exiting the YFP, and finally exiting the Antibody (red) By superimposing the images we could show nicely the two different fluorescent signals are colocalized. This proofs conclude that the fusion protein between INP and YFP is exported to the outer membrane.


Results
In the following section, you will find the results concerning our cell surface display work.
Our first experimental steps were to perform Polymerase Chain Reactions (PCR) in order to isolate the different streptavidins.
Here is the nomenclature we will further use:

1)Initially used plasmid:
INP_EYFP Biobrick: BBa_523013
Streptavidin Alive: BBa_K1111010
Streptavidin Dead: BBa_K1111011
Streptavidin iGEM: BBa_K283010.
2) PCR reactions products
INP_construct = BBa_K523013 after PCR without EYFP
SA = Streptavidin Alive; SD = Streptavidin Dead
SI = Streptavidin iGEM.
3) Gibson reaction product names:
ISA = INP_Streptavidin Alive gibson product BBa_K1111012
ISD = INP_Streptavidin Dead gibson productBBa_K1111013
ISI = INP_Streptavidin iGEM BBa_K283010 gibson productBBa_K1111014


The previous Gels show that our PCR reactions to amplify coding sequences went fine. The DNA fragments migrated at the expected sizes written under each images.
The Gibson Assembly reaction to obtain our biobricks worked as expected, with twe bands seen in the lane corresponding to Gibson product.
Then another way to verify that our Gibson assembly reaction potentially worked was to tranform cells with the Gibson products. The transformed DH5α competent cells should be able to grow on an antibiotic medium thanks to the resistance provided by the plasmid. The only problem with this second verification is that the Gibson product could still contain parental plasmid,which insertion in cells can also lead to cells resistance and survival. So to verify is there is carry over of the initial plasmids, we made controls but here you are not provided with the transformation plates and their controls because they worked as expected. You can only observe plates containing cells from the glycerol stocks we made of our gibson products .


As the other checks did not provide informations about possible mutations, we also sent our constructs for sequencing, using VR and VF2 iGEM primers but also another forward primer we designed ourselves. The sequencing results were also good, the protein is well inserted and there is no frame shift. You can see the sequencing results using the following iGEM registry links: results_ISA ; results_ISD ;results_ISI .
So up to now, with the previous information we had on our contructs, we could simply conclude that our basic cloning strategy worked.
Then moving on, we needed to test if the protein was expressed, if it was well localised at the outer membrane and the functional.
We thus designed immunostaining assays to verify localisation at the outer membrane and biotin-staining assay for the protein functionnality (see protocols).
Then we visualized the samples using a NIKON Eclipse TI inverted microscope [1] and also a Confocal microscope [2], which is one of the most powerful.
unfortunatly for all these assays, we didn't have an appropriate positive control as our constructs were newly designed by ourselves.
Inverted Microscopy
The eight following images represent only the construct ISA. You can observe the bright field images followed by their corresponding composite images (bright field file merged with fluorescent file).


.jpg)


The next images show the competent cells we use as negative controls, in the same conditions as explained above.
These results are followed by the images corresponding to the two other constructs ISD and ISI.

.jpg)


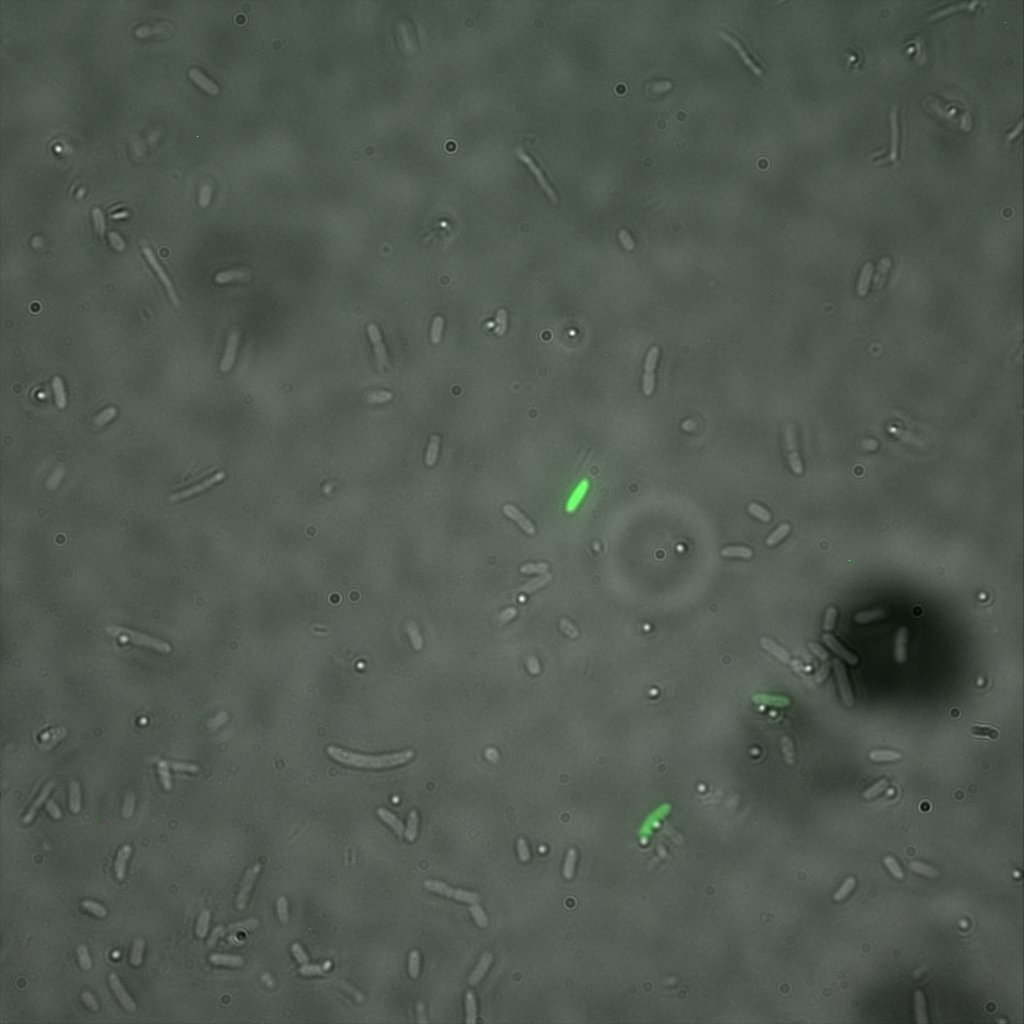
We thus decided to incubate ISA, ISD, ISI cells and competent cells with the some biotinylated nanoparticles conjugated with TexRed reporter.
This time again you can observe in the following pictures, nanoparticles (red) but and cells, but we cannot tell if they are attached or not.


Confocal Microscopy
Focusing on the biotin assays, we did the confocal experiment to better characterize this observed phenotypes. You can observe the results below (Figure 9 to 12).


To conclude on the confocal microscopy, we were not able to distinguish weather the biotin molecules were inside or on the outside of the cells. And also we can see that some cells in the negative control are fluorescent.
With the previous we cannot make a conclusion on the localisation of our fusion proteins but more, it is hard to say if the protein is indeed expressed.
Growth curve and Western Blot
We did a western blot seeking for the ~50kDa bands corresponding to our protein. For this experiment we use a FITC conjugated, anti-streptavidin polyclonal Antibody. Despite the gel quality, you can see in the following picture, band of the desired size.
Finally we did a growth curve of the cells containing our constructs. For this last experiment, the cells were inoculated overnigth with 1mM IPTG. In the morning they were ininitially diluted to a certain OD and then the OD was regularly measured. We can see that the insertion of our plasmid affects the growth of E. coli cells.

Discussion
Our idea was to clone a fusion protein made of INP and Streptavidin that will be able to target streptavidin at the cell surface. This streptavidin could then further be used to attached biotinylated nanoparticules to the cells. We thus designed assays to clone this fusion protein and verify its functionality and localization. For the biotin assay, we were expecting ISA, ISI cells to bind to biotin and ISD, competent cells to not bind to it. We had the right patterns for ISA and ISI. We thus though that we had things working, but by repeating experiments several times and looking carefully at the competent and the ISD cells we found that the fluorescent cells also had the same characteristics as the ISA and ISI cells, which is unfortunately a contradictory result. We also had our immunostaining experiments that didn’t work, but the western blot results were positive.
So knowing that we did all this very carefully with a strict scientific approach we came to the conclusion that our protein is expressed but localised inside the cells. It might be that it is not well folded preventing the fusion product to behave exactly like BBa_K523013 protein.
References
[1] Surface display of Zymomonas mobilis levansucrase by using the ice-nucleation protein of Pseudomonas syringae, Jung HC, Lebeault JM, Pan JG. (1998) [2] Clustering of ice nucleation protein correlates with ice nucleation activity, Mueller GM, Wolber PK, Warren GJ. (1990)