 "
"
Team:KU Leuven/Project/Ecological/Modelling
From 2013.igem.org
| Line 41: | Line 41: | ||
<p> | <p> | ||
Because of friction and obstacles on the earth’s surface, wind speed varies with altitude. Generally, the velocity decreases with increasing altitude. For the part above the crops we can use the logarithmic wind profile is appropriate. The formula for this profile is | Because of friction and obstacles on the earth’s surface, wind speed varies with altitude. Generally, the velocity decreases with increasing altitude. For the part above the crops we can use the logarithmic wind profile is appropriate. The formula for this profile is | ||
| - | <center><img src="https://static.igem.org/mediawiki/2013/3/37/Wind-profile.png" alt="Wind profile" /></center> | + | <center><img src="https://static.igem.org/mediawiki/2013/3/37/Wind-profile.png" alt="Wind profile" /></center><br /> |
with u representing the velocity. Here d accounts for an upward shift above a vegetative cover. The relation d=0.63 x z<sub>c</sub> is suggested, where z<sub>c</sub> is the height of the crops. The length z<sub>0</sub> is called the roughness length and is often supposed to be about one tenth of z<sub>c</sub>. | with u representing the velocity. Here d accounts for an upward shift above a vegetative cover. The relation d=0.63 x z<sub>c</sub> is suggested, where z<sub>c</sub> is the height of the crops. The length z<sub>0</sub> is called the roughness length and is often supposed to be about one tenth of z<sub>c</sub>. | ||
</p> | </p> | ||
Revision as of 13:13, 10 September 2013


Secret garden
Congratulations! You've found our secret garden! Follow the instructions below and win a great prize at the World jamboree!
- A video shows that two of our team members are having great fun at our favourite company. Do you know the name of the second member that appears in the video?
- For one of our models we had to do very extensive computations. To prevent our own computers from overheating and to keep the temperature in our iGEM room at a normal level, we used a supercomputer. Which centre maintains this supercomputer? (Dutch abbreviation)
- We organised a symposium with a debate, some seminars and 2 iGEM project presentations. An iGEM team came all the way from the Netherlands to present their project. What is the name of their city?
Now put all of these in this URL:https://2013.igem.org/Team:KU_Leuven/(firstname)(abbreviation)(city), (loose the brackets and put everything in lowercase) and follow the very last instruction to get your special jamboree prize!


The Ecological Model
Ultimately our project aims to reduce crop loss because of aphid infestation. Given the time span of the competition, it is impossible to conduct a field experiment for this. Therefore we attempt to predict the effect of our pheromones on the ecology through a series of modeling steps.
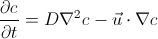
Diffusion and convection of the pheromones
The first step is to calculate the concentration of the pheromones released in the environment. When a colony of E. coligy in what form so ever is placed in a field, the produced substances will be transported in the air by diffusion and convection. Diffusion is always present, whereas the source of the convection term is the wind. In order to establish a realistic model, certain parameters are needed. Therefore approximate diffusion coefficients and air velocity were searched. Production of the pheromones by the colony was coupled with the other modeling approach <link to Sander’s text>.
Diffusion coefficients
Because we found no measured diffusion coefficients of the pheromones in literature, estimations were made with a calculator based on methods described in i. Using the average supplied by the calculator, the results are 4.62 x 10⁻⁶ m2/s for E-beta-farnesene and 6.33 x 10⁻⁶ m2/s for methyl salicylate. The conditions supplied were a pressure of 1 atm and a temperature of 15 °C.
Wind speed
Because of friction and obstacles on the earth’s surface, wind speed varies with altitude. Generally, the velocity decreases with increasing altitude. For the part above the crops we can use the logarithmic wind profile is appropriate. The formula for this profile is
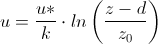
with u representing the velocity. Here d accounts for an upward shift above a vegetative cover. The relation d=0.63 x zc is suggested, where zc is the height of the crops. The length z0 is called the roughness length and is often supposed to be about one tenth of zc.

Figure xǀtext
Figure xǀ text.