 "
"
Team:TU Darmstadt/Modelling/Statistics
From 2013.igem.org
| (23 intermediate revisions not shown) | |||
| Line 15: | Line 15: | ||
{ | { | ||
background-color: white; | background-color: white; | ||
| - | background-image: url("/wiki/images/ | + | background-image: url("/wiki/images/5/5c/Hintergrund_Grün(ohne_Header%2C_Logo_und_Schlagschatten).jpg"); |
background-attachment: scroll; | background-attachment: scroll; | ||
background-position: 50% 0; | background-position: 50% 0; | ||
| Line 26: | Line 26: | ||
{ | { | ||
background: white; | background: white; | ||
| - | background-image: url( | + | background-image: url("/wiki/images/2/2f/Header_%28mit_Logo%29.jpg"); |
margin: 0 auto; | margin: 0 auto; | ||
height:250px ; | height:250px ; | ||
| Line 35: | Line 35: | ||
background-repeat: no-repeat; | background-repeat: no-repeat; | ||
background-size: 100% 100% ; | background-size: 100% 100% ; | ||
| - | border-style: none; | + | border-style: none;;} |
| - | } | + | |
| - | + | ||
#p-logo { display:none;} | #p-logo { display:none;} | ||
.firstHeading {display:none;} | .firstHeading {display:none;} | ||
p {line-height:1.5em; margin:0 0 15px; text-align:justify; color:white;} | p {line-height:1.5em; margin:0 0 15px; text-align:justify; color:white;} | ||
h1 {font-size:1.8em; font-weight:400; margin:0 0 12px;} | h1 {font-size:1.8em; font-weight:400; margin:0 0 12px;} | ||
| + | |||
| + | |||
#mm_icon1 | #mm_icon1 | ||
{ | { | ||
position: absolute; | position: absolute; | ||
| - | top: | + | top: 300px; |
left: 200px; | left: 200px; | ||
} | } | ||
| Line 52: | Line 52: | ||
#mm_icon2 | #mm_icon2 | ||
{ | { | ||
| - | position: | + | position: relative; |
| - | top: | + | top: 170px; |
left: 350px; | left: 350px; | ||
} | } | ||
| Line 67: | Line 67: | ||
{ | { | ||
position: absolute; | position: absolute; | ||
| - | top: | + | top: 320px; |
left: 230px; | left: 230px; | ||
background:white; | background:white; | ||
| Line 80: | Line 80: | ||
{ | { | ||
position: absolute; | position: absolute; | ||
| - | top: | + | top: 670px; |
left: 350px; | left: 350px; | ||
background:white; | background:white; | ||
| Line 108: | Line 108: | ||
position:absolute; | position:absolute; | ||
top:10px; | top:10px; | ||
| - | left: | + | left:500px; |
z-index: 5; | z-index: 5; | ||
} | } | ||
</style> | </style> | ||
| + | |||
| + | |||
| + | <center> | ||
| + | <!-- central main menu --> | ||
| + | |||
| + | <br> | ||
| + | <br> | ||
| + | |||
| + | |||
<!-- Taskbar --> | <!-- Taskbar --> | ||
<div id="taskbar"> | <div id="taskbar"> | ||
| Line 121: | Line 130: | ||
<img alt="Problem" src="/wiki/images/6/66/Darmstadt_green_Problem.jpg" width="100" height="30"></a> | <img alt="Problem" src="/wiki/images/6/66/Darmstadt_green_Problem.jpg" width="100" height="30"></a> | ||
| - | |||
| - | |||
<a href="https://2013.igem.org/Team:TU_Darmstadt/result"> | <a href="https://2013.igem.org/Team:TU_Darmstadt/result"> | ||
| Line 141: | Line 148: | ||
<a href="https://2013.igem.org/Team:TU_Darmstadt/modelling"> | <a href="https://2013.igem.org/Team:TU_Darmstadt/modelling"> | ||
| - | <img alt="team" src="/wiki/images/ | + | <img alt="team" src="/wiki/images/5/53/09._Modelling_(angewählt).jpg" width="110" height="30"></a> |
<a href="https://2013.igem.org/Team:TU_Darmstadt/labbook"> | <a href="https://2013.igem.org/Team:TU_Darmstadt/labbook"> | ||
| Line 150: | Line 157: | ||
</div> | </div> | ||
| + | |||
| + | <br> | ||
| + | <br><br> | ||
| + | |||
| + | <br> | ||
| + | <center> | ||
| + | <a href="https://2013.igem.org/Team:TU_Darmstadt/modelling"> | ||
| + | <font size="8" color="#F0F8FF" face="Arial regular">Modelling |</font> | ||
| + | </a> | ||
| + | <a href="https://2013.igem.org/Team:TU_Darmstadt/modelling/Statistics"> | ||
| + | <font size="8" color="#F0F8FF" face="Arial regular">Statistics |</font> | ||
| + | </a> | ||
| + | <a href="https://2013.igem.org/Team:TU_Darmstadt/modelling/Structure"> | ||
| + | <font size="8" color="#F0F8FF" face="Arial regular">Structure </font> | ||
| + | </a> | ||
| + | </center> | ||
<!-- Überschrifft --> | <!-- Überschrifft --> | ||
<center> | <center> | ||
<br> | <br> | ||
| + | |||
<br> | <br> | ||
<br> | <br> | ||
| - | + | <h2><font size="6" color="#F0F8FF" face="Arial regular"> Information Theory </font></h2> | |
| - | <h2><font size="6" color="#F0F8FF" face="Arial regular"> | + | |
<div id="all"> | <div id="all"> | ||
<body> | <body> | ||
| Line 163: | Line 186: | ||
<font size="3" color="#F0F8FF" face="Arial regular"> | <font size="3" color="#F0F8FF" face="Arial regular"> | ||
<p text-aligne:left style="margin-left:50px; margin-right:50px"> | <p text-aligne:left style="margin-left:50px; margin-right:50px"> | ||
| - | + | ||
| + | <font size="5" color="#F0F8FF" face="Arial regular">The DKL Analysis</font> | ||
| + | <br> | ||
| + | <br> | ||
| + | |||
| + | |||
| + | In information theory the Kullback-Leibler-Divergence (DKL<sup><span style="color:blue">[1]</span></sup>) describes and quantifies the distance between | ||
| + | two distributions P and Q. Where P denotes an experimental distribution, it is compared with Q, a reference distribution. DKL is also known as ‘relative entropy’ as well as ‘mutual information’. | ||
| + | Although DKL is often used as a metric or distance measurement, it is not a true measurement because it is not symmetric. | ||
| + | |||
| + | <br> | ||
| + | <br> | ||
| + | |||
<center> | <center> | ||
<img alt="DKL" src="/wiki/images/7/71/DKL.png" width="555" height="138"> | <img alt="DKL" src="/wiki/images/7/71/DKL.png" width="555" height="138"> | ||
</center> | </center> | ||
| + | |||
<br> | <br> | ||
<br> | <br> | ||
<br> | <br> | ||
| + | <font size="3" color="#F0F8FF" face="Arial regular"> | ||
| + | <p text-aligne:left style="margin-left:50px; margin-right:50px"> | ||
| + | Here, P(i) and Q(i) denote the densities of P and Q at a position i. | ||
| + | In our study, we use the DKL to describe the distances of the survey datasets from the human practice project. | ||
| + | Therefore, we have to calculate a histogram out of the different datasets. Here, it is important to perform a constant binsize. In this approach we assume that a hypothetical distribution Q is uniformly distributed. | ||
| + | To achieve this, we grate an appropriate test data set with the random generator runif in R. | ||
| + | |||
| + | </p></font> | ||
<br> | <br> | ||
| + | <br> | ||
| + | |||
| + | <br> | ||
| + | |||
| + | </body> | ||
| + | |||
| + | |||
| + | |||
| + | |||
| + | <h2><font size="6" color="#F0F8FF" face="Arial regular">Results</font></h2> | ||
| + | |||
<br> | <br> | ||
<br> | <br> | ||
<font size="3" color="#F0F8FF" face="Arial regular"> | <font size="3" color="#F0F8FF" face="Arial regular"> | ||
<p text-aligne:left style="margin-left:50px; margin-right:50px"> | <p text-aligne:left style="margin-left:50px; margin-right:50px"> | ||
| - | + | To validate the significance of our data we gathered in our human practice survey, we computed the DKL between our contestants and an artificial random distribution. High DKL values indicate a significant distribution. | |
| - | + | ||
| - | </p | + | </p> |
<br> | <br> | ||
| + | |||
| + | <center> | ||
| + | |||
| + | <img alt="Test" src="/wiki/images/e/ea/DKL2.png" width="400" height="400"> | ||
| + | |||
<br> | <br> | ||
| + | <font size="3" color="#F0F8FF" face="Arial regular"> | ||
| + | <p text-aligne:left style="margin-left:50px; margin-right:50px"> | ||
| + | |||
<br> | <br> | ||
| + | |||
| + | As can be seen in the graphic above, the DKL concerning our contestants indicate a significant data acquisition. For detailed analysis, see : <a href="https://2013.igem.org/Team:TU_Darmstadt/humanpractice/Results"><font size="3" color="#F0F8FF" face="Arial regular"><b>Human resource / results</b></a> | ||
| + | </p> | ||
<br> | <br> | ||
| + | |||
<center> | <center> | ||
| - | <img alt="Test" src="/wiki/images/ | + | |
| + | <img alt="Test" src="/wiki/images/c/c4/Gender_Produkts.png" width="400" height="400"> | ||
</center> | </center> | ||
| - | </ | + | |
| + | <br> | ||
| + | |||
| + | <font size="3" color="#F0F8FF" face="Arial regular"> | ||
| + | <p text-aligne:left style="margin-left:50px; margin-right:50px"> | ||
| + | |||
| + | If we focus on the general opinion of male vs female contestants regarding basic research, we can observe a similar density distribution among the sexes. However, there seem to be more men, who tend to vote in the extreme end of the scale, with a tendency towards a positive opinion. | ||
| + | </p> | ||
| + | <br> | ||
| + | |||
| + | <center> | ||
| + | |||
| + | <img alt="Test" src="/wiki/images/7/79/XXGender.png" width="400" height="400"> | ||
| + | |||
| + | </center> | ||
| + | |||
| + | <br> | ||
| + | <font size="3" color="#F0F8FF" face="Arial regular"> | ||
| + | <p text-aligne:left style="margin-left:50px; margin-right:50px"> | ||
| + | |||
| + | If correlated to their age, men and women show the same density distribution. | ||
| + | |||
| + | </p> | ||
| + | <br><br><br> | ||
| + | |||
| + | <h2><font size="6" color="#F0F8FF" face="Arial regular">References</font></h2> | ||
| + | |||
| + | <br> | ||
| + | <br> | ||
| + | <ol> | ||
| + | <li style="margin-left:15px; margin-right:50px; text-align:justify">Kullback, S.; Leibler, R.A. (1951) <i>On Information and Sufficiency</i> Annals of Mathematical Statistics 22 (1): 79–86. doi:10.1214/aoms/1177729694. MR 39968.</li> | ||
| + | </ol> | ||
| + | |||
| + | |||
</html> | </html> | ||
Latest revision as of 02:42, 5 October 2013
Information Theory
The DKL Analysis
In information theory the Kullback-Leibler-Divergence (DKL[1]) describes and quantifies the distance between
two distributions P and Q. Where P denotes an experimental distribution, it is compared with Q, a reference distribution. DKL is also known as ‘relative entropy’ as well as ‘mutual information’.
Although DKL is often used as a metric or distance measurement, it is not a true measurement because it is not symmetric.

Here, P(i) and Q(i) denote the densities of P and Q at a position i. In our study, we use the DKL to describe the distances of the survey datasets from the human practice project. Therefore, we have to calculate a histogram out of the different datasets. Here, it is important to perform a constant binsize. In this approach we assume that a hypothetical distribution Q is uniformly distributed. To achieve this, we grate an appropriate test data set with the random generator runif in R.
Results
To validate the significance of our data we gathered in our human practice survey, we computed the DKL between our contestants and an artificial random distribution. High DKL values indicate a significant distribution.
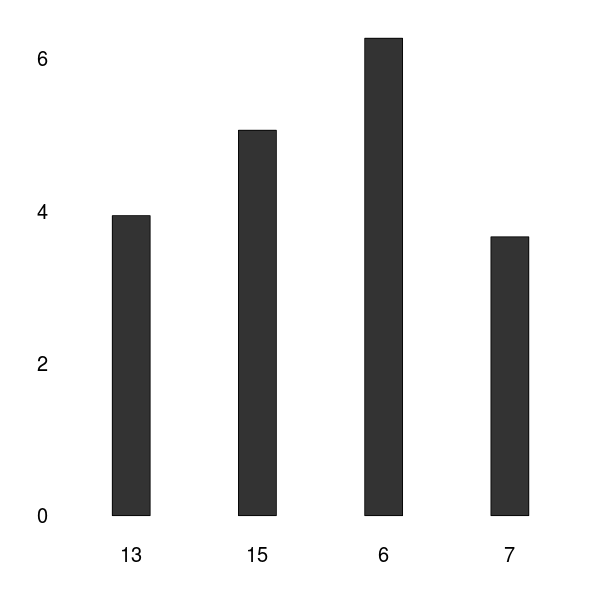
As can be seen in the graphic above, the DKL concerning our contestants indicate a significant data acquisition. For detailed analysis, see : Human resource / results
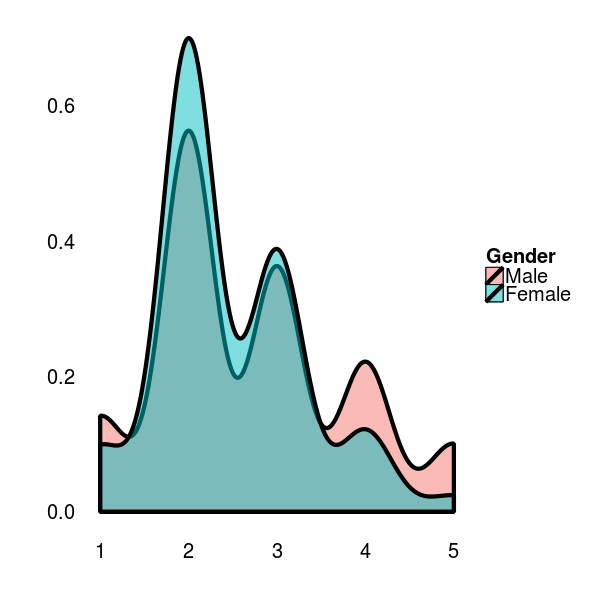
If we focus on the general opinion of male vs female contestants regarding basic research, we can observe a similar density distribution among the sexes. However, there seem to be more men, who tend to vote in the extreme end of the scale, with a tendency towards a positive opinion.

If correlated to their age, men and women show the same density distribution.
References
- Kullback, S.; Leibler, R.A. (1951) On Information and Sufficiency Annals of Mathematical Statistics 22 (1): 79–86. doi:10.1214/aoms/1177729694. MR 39968.