 "
"
Team:Tsinghua-A/md
From 2013.igem.org
Overview
Construction of Networks And Description Mathematical Description -- ODE Equations
We based on the Michealis-Menten Equation and Hill Equation to describe the kinetics of gene regulatory networks. The M-M Equation and Hill Equation describe the relationship between the production rate of products and the concentration of substrate.
M-M Equations of activation (monotone-increasing) and inhibition (monotone-decreasing) are defined as:
〖f(X)〗_activition=CX/(K+X)
〖f(X)〗_inhibition=CK/(K+X)
Hill Equations of activation (monotone-increasing) and inhibition (monotone-decreasing) are defined as:
〖f(X)〗_activition=(CX^n)/(K^n+X^n )
〖f(X)〗_inhibition=(CK^n)/(K^n+X^n )
(C is a constant, K is called half maximal effective concentration and n is called hill coefficient.)
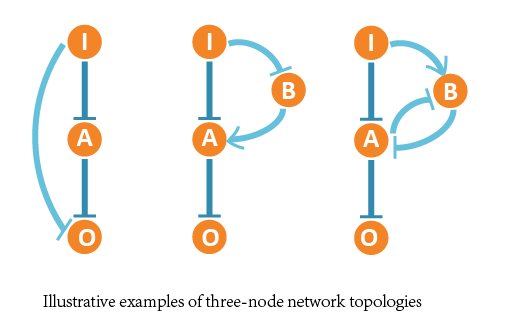
In our project, we aimed at all three-node network structures, and each contains 4 nodes (1 input node, 2 regulatory nodes and 1 output node) and vast possible regulatory edges among them.
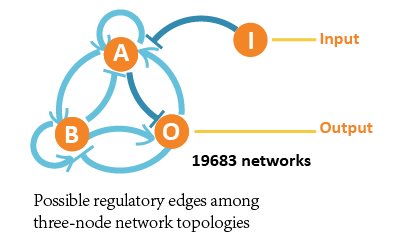
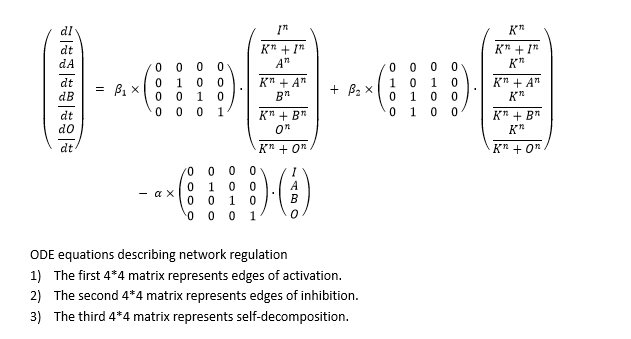
 So we formed ODE equation sets to describe the mutual relationships and form networks. The ODE equation sets involve two 4*4 matrices to respectively bring in the activating effect and inhibitive effect, and a column vector for self-decomposition.
 In our wet lab part, we synthetized network and constructed plasmids transferred into Hela cells, and we made some adjustment in our design for a better realization in experiment:
We assumed that input (I) is not regulated by the network and remained constant.
We fixed two certain edges (I inhibits A, A inhibits O), because when constructing the system, the components to function as inducers are quite few. So we tend to use 2 repressors to substitute it.
We limited the maximum number of regulatory nodes to 2 restrict the problem to an acceptable scale.
We chose relative parameters close to the actual experiments in our simulation. According to previous research, we guaranteed that most parameters are within the already confirmed range, such as reaction rate.
In our wet lab part, we synthetized network and constructed plasmids transferred into Hela cells, and we made some adjustment in our design for a better realization in experiment:
We assumed that input (I) is not regulated by the network and remained constant.
We fixed two certain edges (I inhibits A, A inhibits O), because when constructing the system, the components to function as inducers are quite few. So we tend to use 2 repressors to substitute it.
We limited the maximum number of regulatory nodes to 2 restrict the problem to an acceptable scale.
We chose relative parameters close to the actual experiments in our simulation. According to previous research, we guaranteed that most parameters are within the already confirmed range, such as reaction rate.
Experimental Characterization
We took advantage of another fluorescent protein(mkate ) as reference gene, which has no influence in our design. Published literature generally supports the view that in transient transfections, fluorescence depends linearly on the copy number of transfected plasmids (Tseng et al, 1997; Pollard et al, 1998;Cohenet al,2009; Schwakeet al, 2010). While strictly speaking, this reporter level also depends on many other potentially fluctuating parameters such as global synthesis and degradation rates(Leonidas Bleris et al,2011),it is more legitimately use the normalized quotient to instead of the value of EYFP.
 Apparently, the output of circuit C is lower than circuit B .Having the negative feedback compared with circuit B, the expression of EYFP in circuit A is strongest.
Then we analysed the output of constructed designs varies with the DNA copy number. Facing with the difficulty of counting the copy number directly, we employed the reference gene to reflect .We think the copy number is high when the expression intensity of mkate is strong. One hundred thousand positive Hela cells was collected to obtain the relationship between EYFP and make.
Apparently, the output of circuit C is lower than circuit B .Having the negative feedback compared with circuit B, the expression of EYFP in circuit A is strongest.
Then we analysed the output of constructed designs varies with the DNA copy number. Facing with the difficulty of counting the copy number directly, we employed the reference gene to reflect .We think the copy number is high when the expression intensity of mkate is strong. One hundred thousand positive Hela cells was collected to obtain the relationship between EYFP and make.
 From the figure 2, we learned with the increase of the expression intensity of makte, the specific valve of EYFP and mkate decreases. In another word, the circuit A’s output reaches saturation fast with the increase of copy number. We came to a conclusion circuit A’s adaptation to DNA copy number is higher than circuit B’s. So, the negative feedback works.
Parts
| Name | description | Part Type | Designer |
| K1116000 | LacI with miR-21 and miR-FF3 target | Composite | Lei Wei |
| K1116001 | LacI with miR-21 and miR-FF5 target | Composite | Shuguang Peng |
| K1116002 | TRE-LacI with miR-21 and miR-FF3 target | Composite | Shuguang Peng |
| K1116003 | TRE-LacI with miR-21 and miR-FF5 target | Composite | Shuguang Peng |
| K1116004 | CAG-EYFP-miRNA-FF3 | Composite | Shuguang Peng |
| K1116005 | CAG-Cerulean-hsa-miR-21 | Composite | Shuguang Peng |
Discussion
Due to some restrictions in wetlab, we only finished the above-mentioned experiment. We found that the number of Hela cells who possesses high copy number is comparatively low. We also noticed the circuit C’s output is higher than expected in Figure 1.This may cause wrong judge when use the design to detect miR-21. Some measures will be taken to solve this question. Besides, we are going to endeavor to construct the other networks mentioned in modeling work.